| Param | Original file | Final file |
|---|---|---|
| Filename | modeM0/AS1A14_083T03_9000006548_56123cztM0_level2.fits | modeM0/AS1A14_083T03_9000006548_56123cztM0_level2_quad_clean.evt |
| Size (bytes) | 1,280,090,880 | 266,650,560 |
| Size | 1.2 GB | 254.3 MB |
| Events in quadrant A | 11,924,369 | 1,700,544 |
| Events in quadrant B | 10,350,952 | 1,889,283 |
| Events in quadrant C | 11,664,802 | 1,632,609 |
| Events in quadrant D | 11,931,676 | 1,504,431 |
| Mode M0 | |||
|---|---|---|---|
| Quadrant | BADHDUFLAG | Total packets | Discarded packets |
| A | 0 | 49901 | 4 |
| B | 0 | 44322 | 4 |
| C | 0 | 48517 | 4 |
| D | 0 | 50160 | 4 |
| Mode SS | |||
|---|---|---|---|
| Quadrant | BADHDUFLAG | Total packets | Discarded packets |
| A | 0 | 396 | 0 |
| B | 0 | 396 | 0 |
| C | 0 | 396 | 0 |
| D | 0 | 396 | 0 |
| Mode M9 | |||
|---|---|---|---|
| Quadrant | BADHDUFLAG | Total packets | Discarded packets |
| A | 0 | 12 | 0 |
| B | 0 | 12 | 0 |
| C | 0 | 12 | 0 |
| D | 0 | 12 | 0 |
| Quadrant | Total seconds | Saturated seconds | Saturation percentage |
|---|---|---|---|
| A | 19541 | 1018 | 5.209559% |
| B | 19541 | 514 | 2.630367% |
| C | 19541 | 804 | 4.114426% |
| D | 19541 | 979 | 5.009979% |
Noise dominated data is calculated using 1-second bins in cleaned event files. If a bin has >2000 counts, and if more than 50% of those come from <1% of pixels, then it is considered to be noise-dominated and hence unusable.
| Quadrant | # 1 sec bins | Bins with >0 counts | Bins with >2000 counts | High rate bins dominated by noise | Noise dominated (total time) | Noise dominated (detector-on time) | Marked lightcurve |
|---|---|---|---|---|---|---|---|
| A | 20721 | 19544 | 604 | 604 | 2.91% | 3.09% | 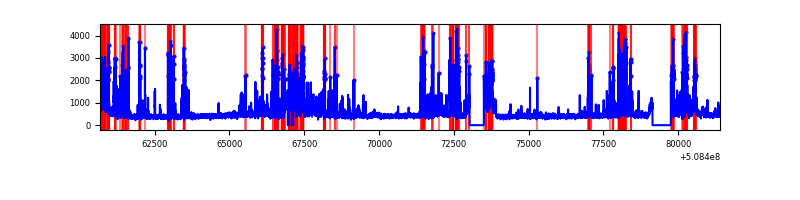 |
| B | 20721 | 19543 | 96 | 96 | 0.46% | 0.49% | 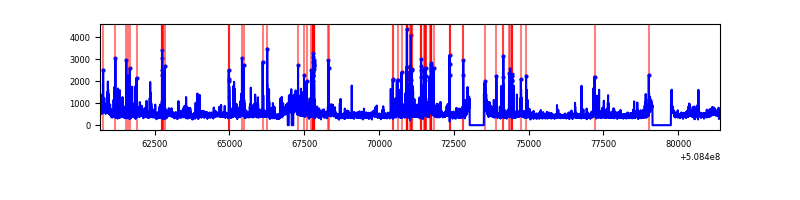 |
| C | 20721 | 19544 | 296 | 296 | 1.43% | 1.51% | 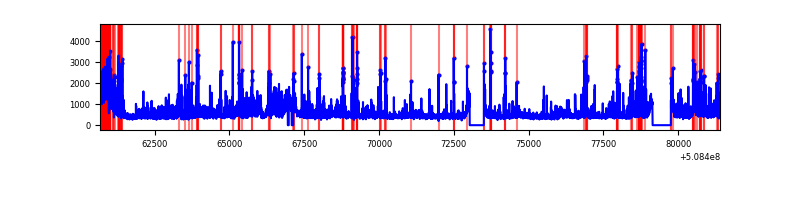 |
| D | 20721 | 19544 | 660 | 660 | 3.19% | 3.38% | 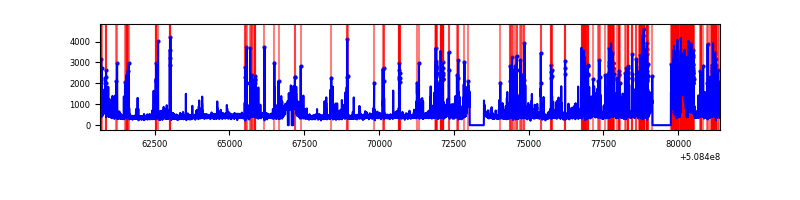 |
Top three noisy pixels from each quadrant. If the there are fewer than three noisy pixels in the level2.evt file, extra rows are filled as -1
| Pixel properties | Quadrant properties | ||||||
|---|---|---|---|---|---|---|---|
| Quadrant | DetID | PixID | Counts | Sigma | Mean | Median | Sigma |
| A | 7 | 64 | 1516734 | 2997.93 | 2053 | 2000 | 505.3 |
| A | 12 | 115 | 1326625 | 2621.67 | 2053 | 2000 | 505.3 |
| A | 15 | 32 | 859512 | 1697.17 | 2053 | 2000 | 505.3 |
| B | 9 | 254 | 622962 | 1399.6 | 2076 | 2000 | 443.7 |
| B | 4 | 171 | 442363 | 992.54 | 2076 | 2000 | 443.7 |
| B | 4 | 156 | 400565 | 898.33 | 2076 | 2000 | 443.7 |
| C | 9 | 38 | 1302114 | 2386.44 | 2021 | 2003 | 544.8 |
| C | 15 | 148 | 726233 | 1329.37 | 2021 | 2003 | 544.8 |
| C | 12 | 254 | 432996 | 791.12 | 2021 | 2003 | 544.8 |
| D | 8 | 240 | 1725349 | 3092.1 | 1998 | 1911 | 557.4 |
| D | 2 | 120 | 996263 | 1784.01 | 1998 | 1911 | 557.4 |
| D | 2 | 249 | 766428 | 1371.66 | 1998 | 1911 | 557.4 |
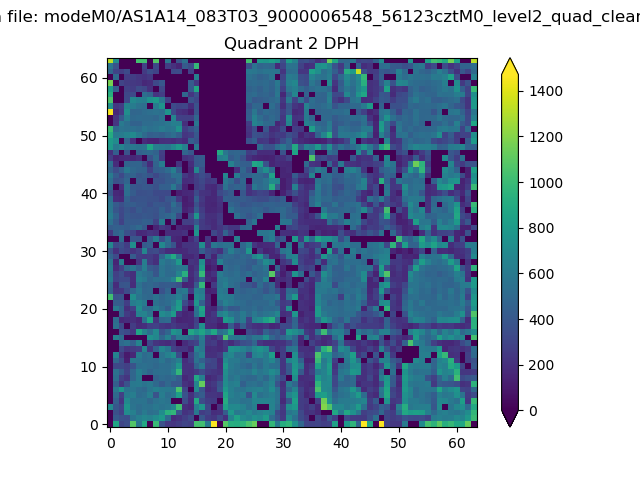
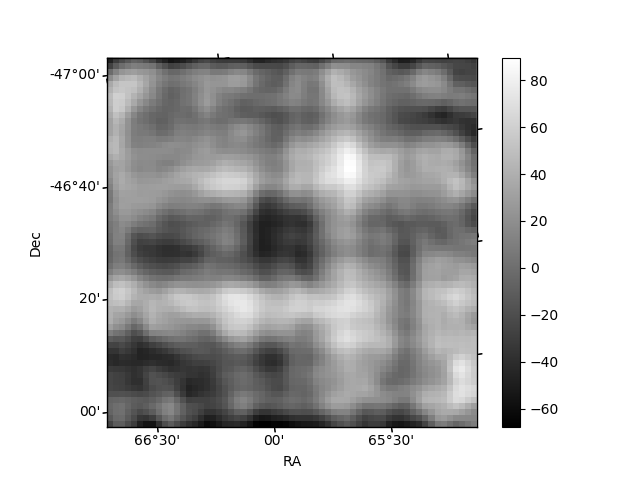
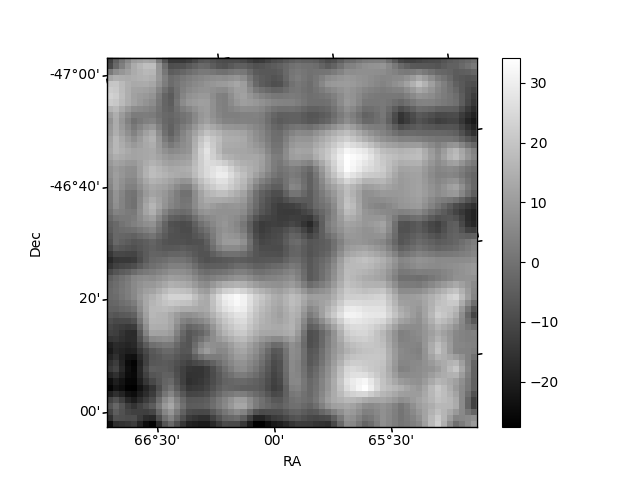
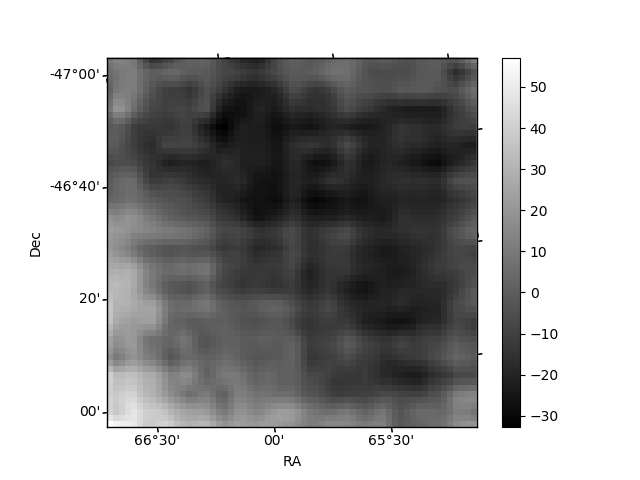
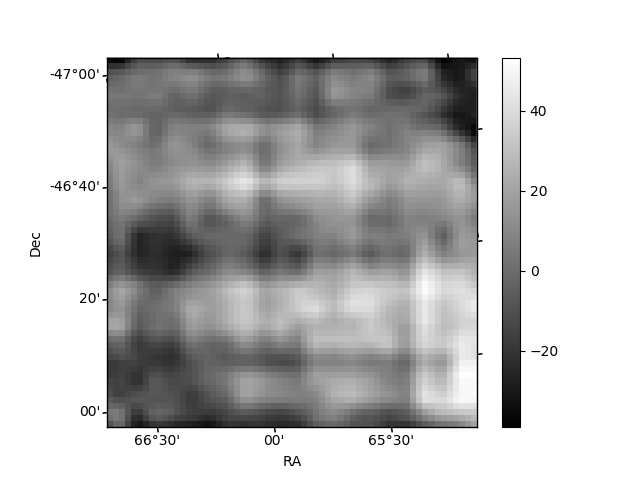
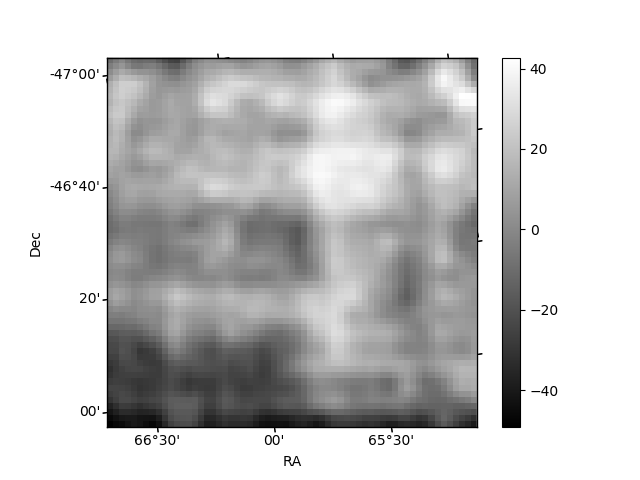
Histogram calculated using DETX and DETY for each event in the final _common_clean file
| Quadrant A | 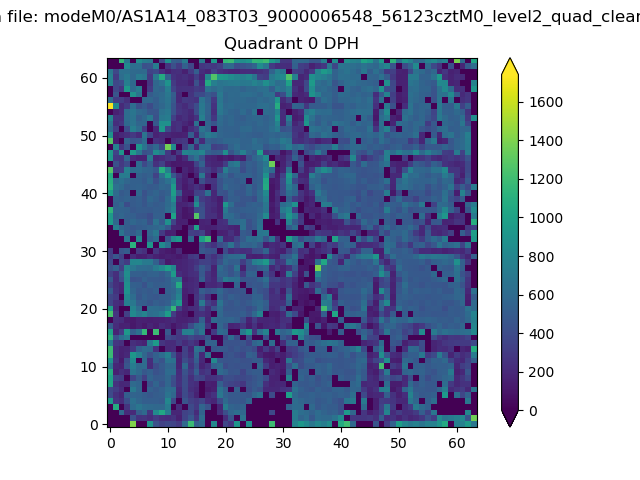 |
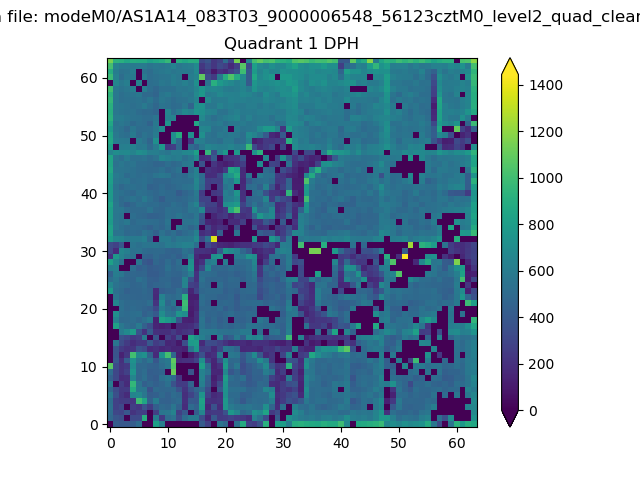 |
Quadrant B |
|---|---|---|---|
| Quadrant D | 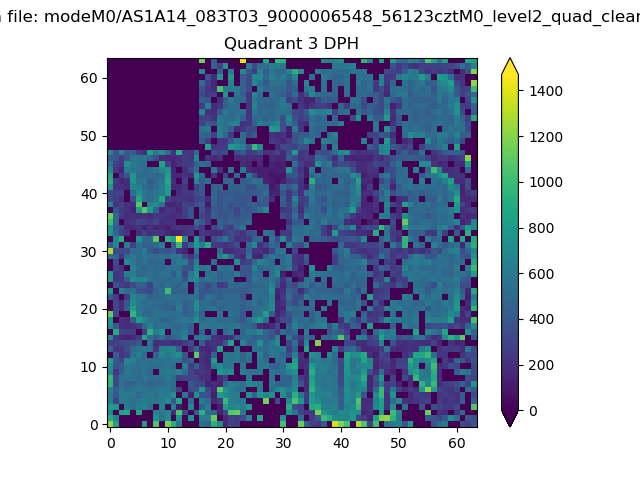 |
 |
Quadrant C |
| Plot type | Count rate plots | Images |
|---|---|---|
| Comparison with Poisson distribution Blue bars denote a histogram of data divided into 1 sec bins. Red curve is a Poisson curve with rate = median count rate of data. |
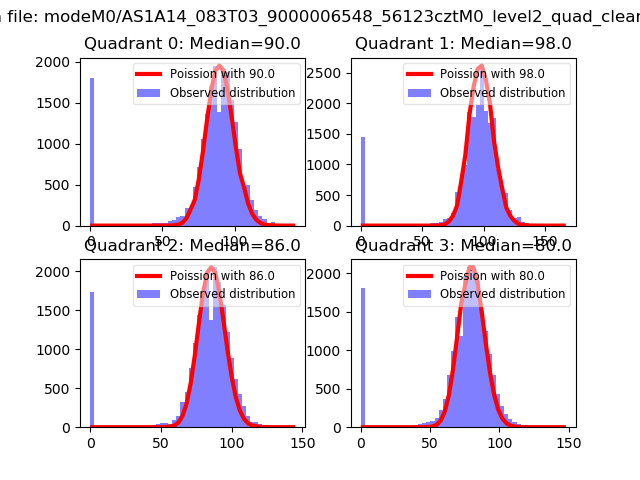 |
 |
| Quadrant-wise count rates Data is divided into 100 sec bins |
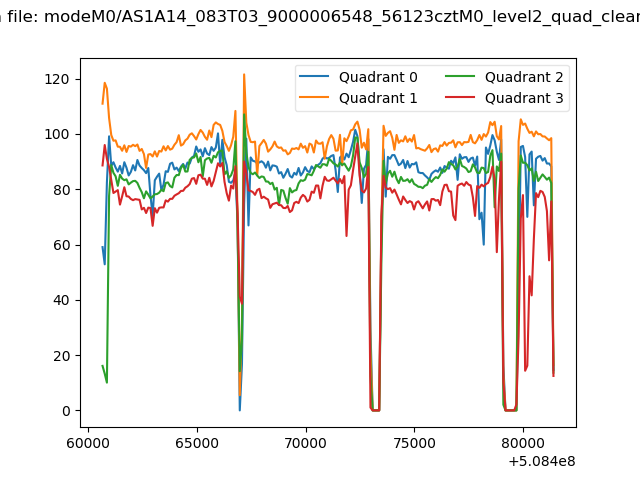 |
|
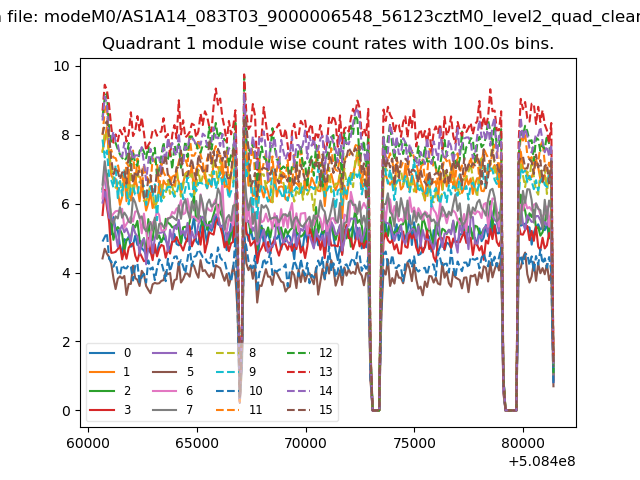
| Module-wise count rates for Quadrant A Data is divided into 100 sec bins |
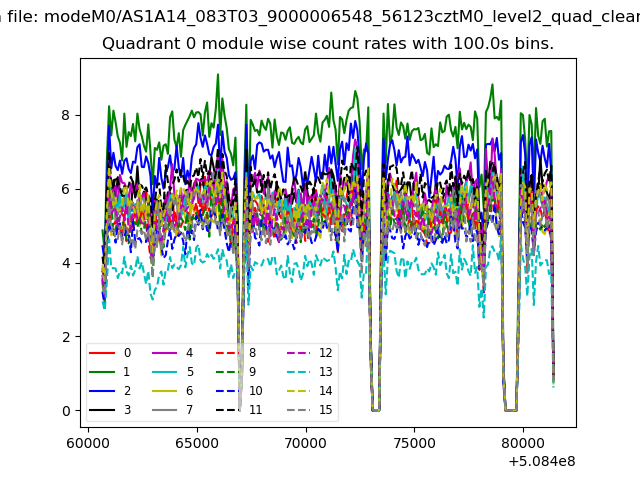 |
 |
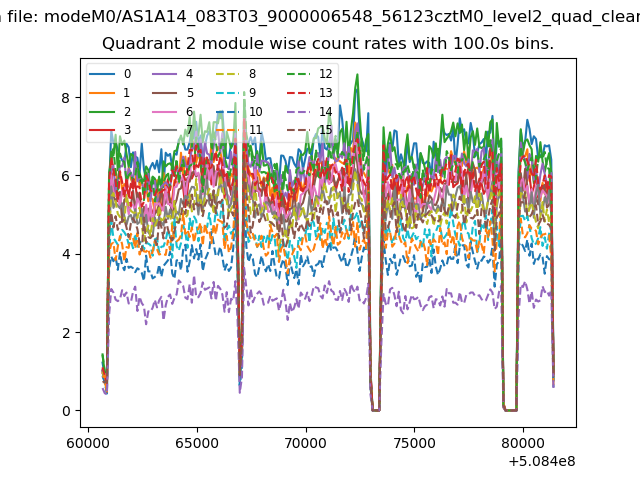
| Module-wise count rates for Quadrant B Data is divided into 100 sec bins |
 |
 |
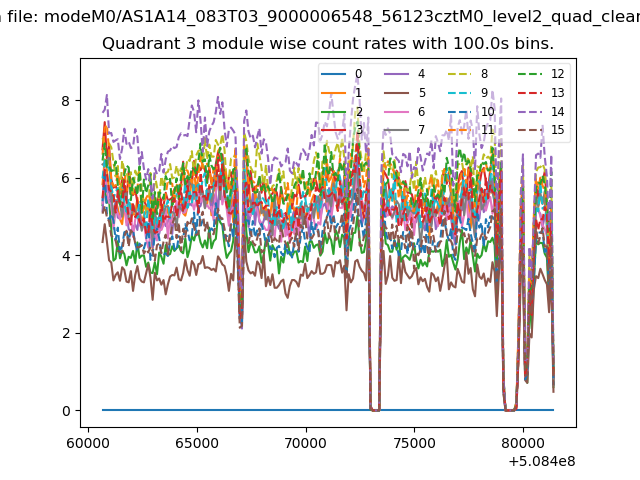
| Module-wise count rates for Quadrant C Data is divided into 100 sec bins |
 |
 |
| Module-wise count rates for Quadrant D Data is divided into 100 sec bins |
 |
 |
| Parameter | Plot |
|---|---|
| CZT HV Monitor | 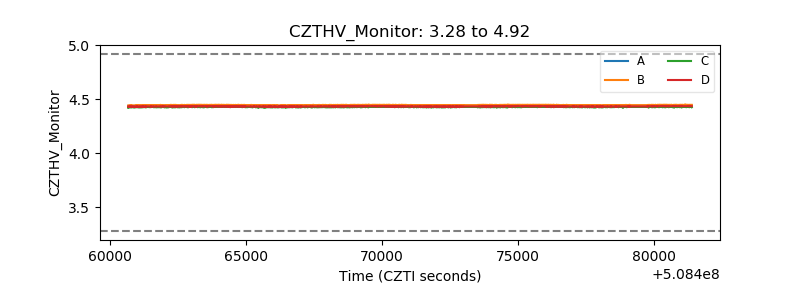 |
| D_VDD | 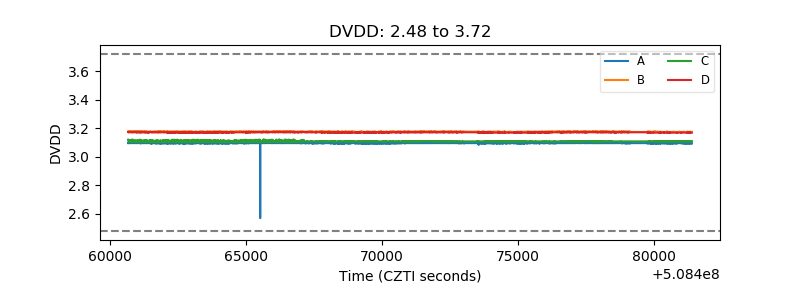 |
| Temperature 1 | 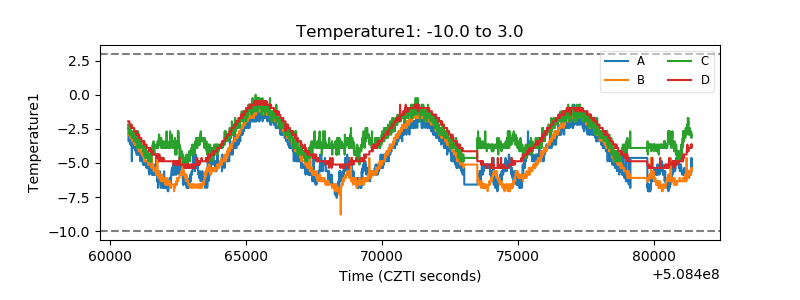 |
| Veto HV Monitor | 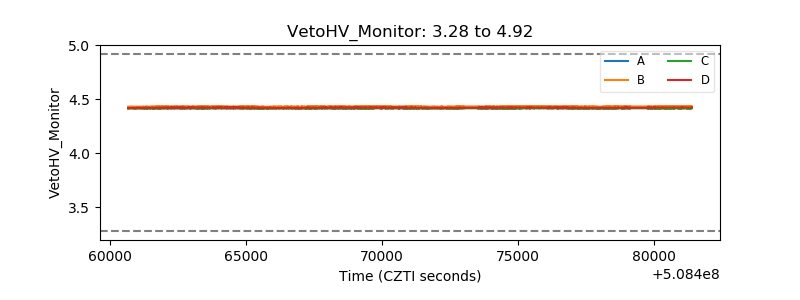 |
| Veto LLD | 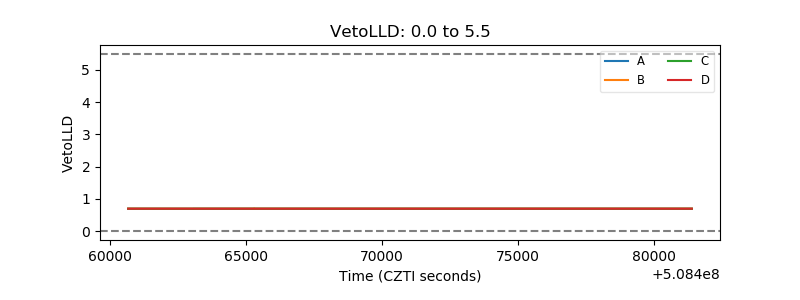 |
| Alpha Counter | 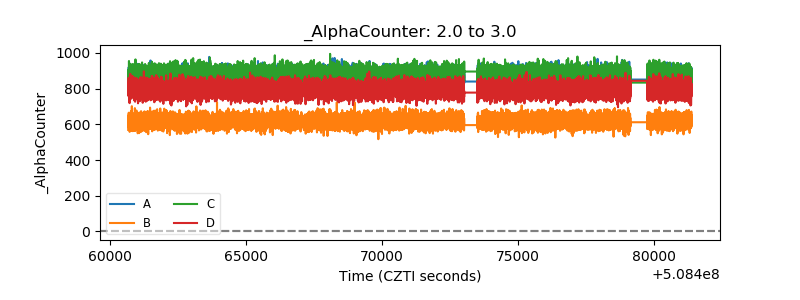 |
| _CPM_Rate | 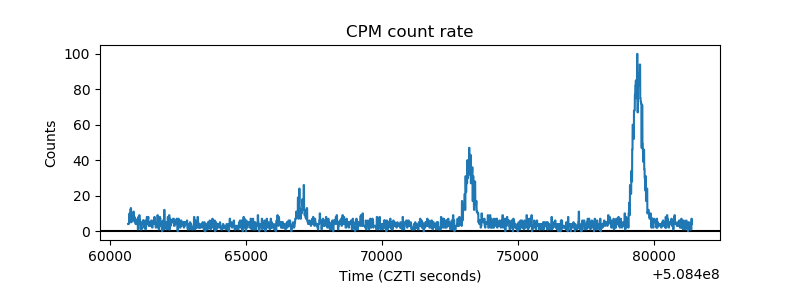 |
| CZT Counter | 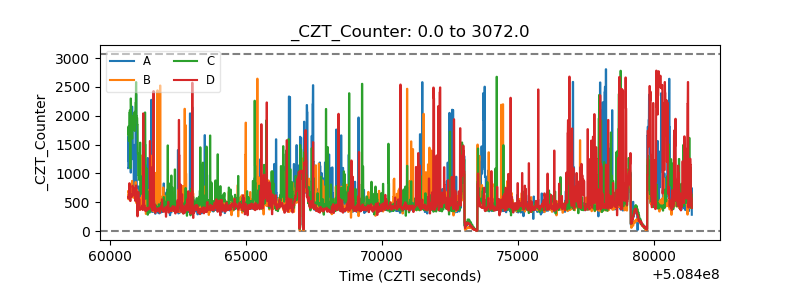 |
| +2.5 Volts monitor |  |
| +5 Volts monitor | 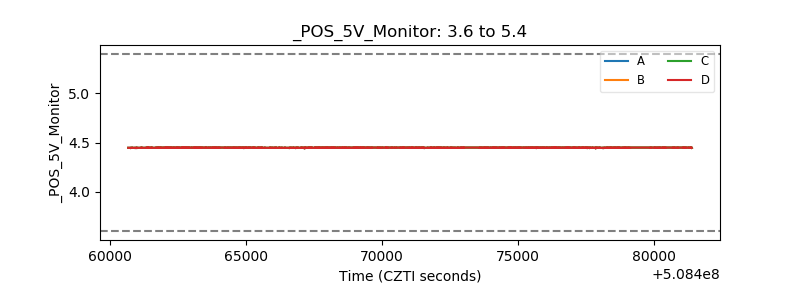 |
| _ROLL_ROT | 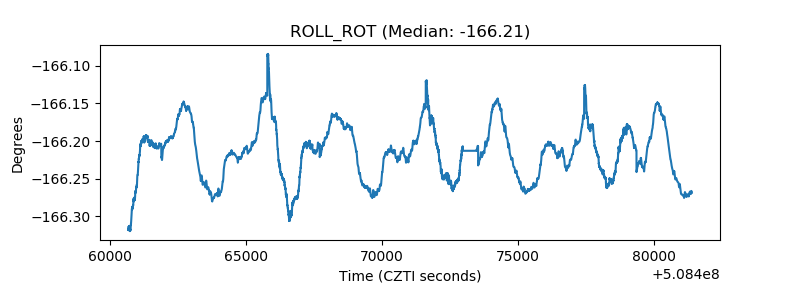 |
| _Roll_DEC | 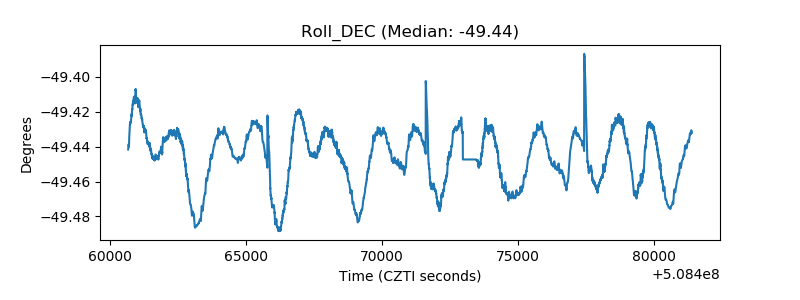 |
| _Roll_RA | 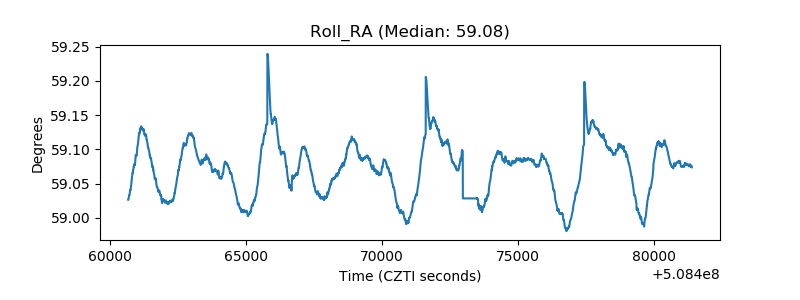 |
| Veto Counter | 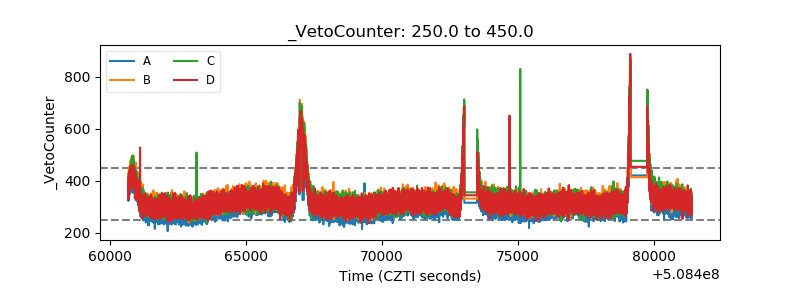 |