| Param | Original file | Final file |
|---|---|---|
| Filename | modeM0/AS1A14_083T03_9000006548_56124cztM0_level2.fits | modeM0/AS1A14_083T03_9000006548_56124cztM0_level2_quad_clean.evt |
| Size (bytes) | 577,857,600 | 95,028,480 |
| Size | 551.1 MB | 90.6 MB |
| Events in quadrant A | 6,584,150 | 566,990 |
| Events in quadrant B | 3,717,617 | 696,060 |
| Events in quadrant C | 5,671,621 | 584,075 |
| Events in quadrant D | 4,874,588 | 542,854 |
| Mode M0 | |||
|---|---|---|---|
| Quadrant | BADHDUFLAG | Total packets | Discarded packets |
| A | 0 | 24486 | 4 |
| B | 0 | 15899 | 2 |
| C | 0 | 21721 | 2 |
| D | 0 | 19655 | 2 |
| Mode SS | |||
|---|---|---|---|
| Quadrant | BADHDUFLAG | Total packets | Discarded packets |
| A | 0 | 144 | 0 |
| B | 0 | 144 | 0 |
| C | 0 | 144 | 0 |
| D | 0 | 144 | 0 |
| Mode M9 | |||
|---|---|---|---|
| Quadrant | BADHDUFLAG | Total packets | Discarded packets |
| A | 0 | 9 | 0 |
| B | 0 | 10 | 0 |
| C | 0 | 10 | 0 |
| D | 0 | 10 | 0 |
| Quadrant | Total seconds | Saturated seconds | Saturation percentage |
|---|---|---|---|
| A | 6988 | 1102 | 15.769891% |
| B | 6988 | 212 | 3.033772% |
| C | 6988 | 609 | 8.714940% |
| D | 6988 | 640 | 9.158558% |
Noise dominated data is calculated using 1-second bins in cleaned event files. If a bin has >2000 counts, and if more than 50% of those come from <1% of pixels, then it is considered to be noise-dominated and hence unusable.
| Quadrant | # 1 sec bins | Bins with >0 counts | Bins with >2000 counts | High rate bins dominated by noise | Noise dominated (total time) | Noise dominated (detector-on time) | Marked lightcurve |
|---|---|---|---|---|---|---|---|
| A | 7813 | 6989 | 876 | 876 | 11.21% | 12.53% | 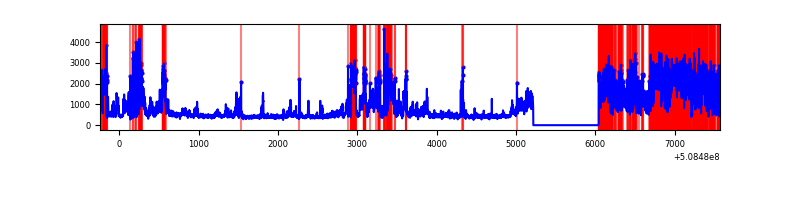 |
| B | 7813 | 6989 | 43 | 43 | 0.55% | 0.62% | 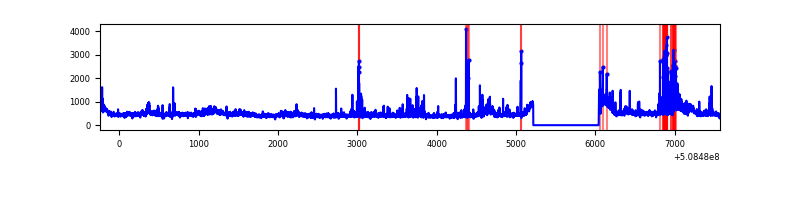 |
| C | 7813 | 6988 | 310 | 310 | 3.97% | 4.44% | 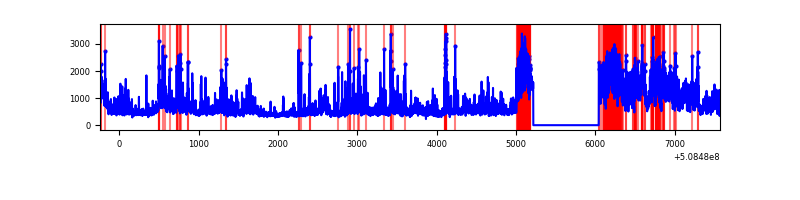 |
| D | 7813 | 6989 | 481 | 481 | 6.16% | 6.88% | 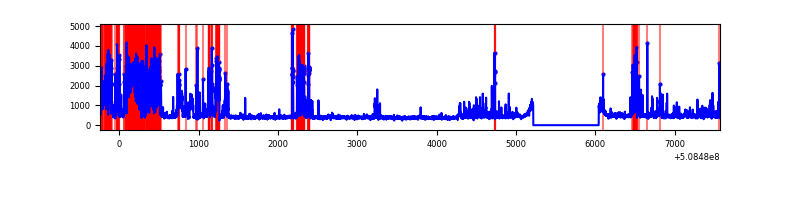 |
Top three noisy pixels from each quadrant. If the there are fewer than three noisy pixels in the level2.evt file, extra rows are filled as -1
| Pixel properties | Quadrant properties | ||||||
|---|---|---|---|---|---|---|---|
| Quadrant | DetID | PixID | Counts | Sigma | Mean | Median | Sigma |
| A | 12 | 115 | 3470971 | 19523.08 | 715 | 695 | 177.8 |
| A | 8 | 253 | 99905 | 558.14 | 715 | 695 | 177.8 |
| A | 0 | 8 | 68567 | 381.83 | 715 | 695 | 177.8 |
| B | 9 | 254 | 259615 | 1628.64 | 742 | 714 | 159.0 |
| B | 4 | 156 | 231032 | 1448.83 | 742 | 714 | 159.0 |
| B | 0 | 199 | 86603 | 540.29 | 742 | 714 | 159.0 |
| C | 9 | 38 | 2088421 | 10662.14 | 718 | 710 | 195.8 |
| C | 12 | 254 | 285496 | 1454.43 | 718 | 710 | 195.8 |
| C | 12 | 249 | 141407 | 718.55 | 718 | 710 | 195.8 |
| D | 8 | 240 | 1409619 | 7073.85 | 709 | 676 | 199.2 |
| D | 2 | 252 | 216571 | 1083.94 | 709 | 676 | 199.2 |
| D | 8 | 160 | 152240 | 760.95 | 709 | 676 | 199.2 |
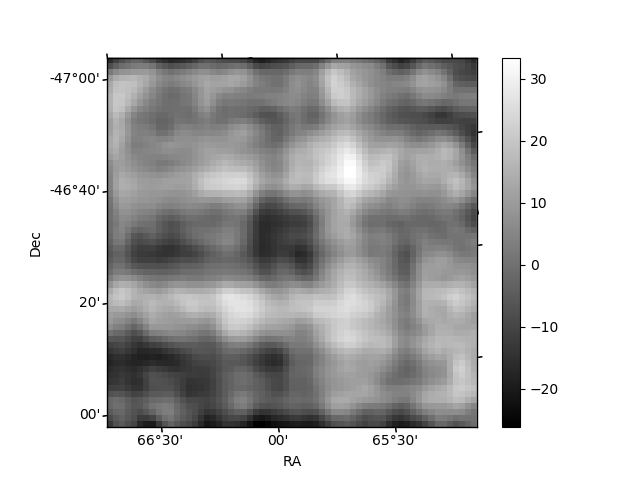
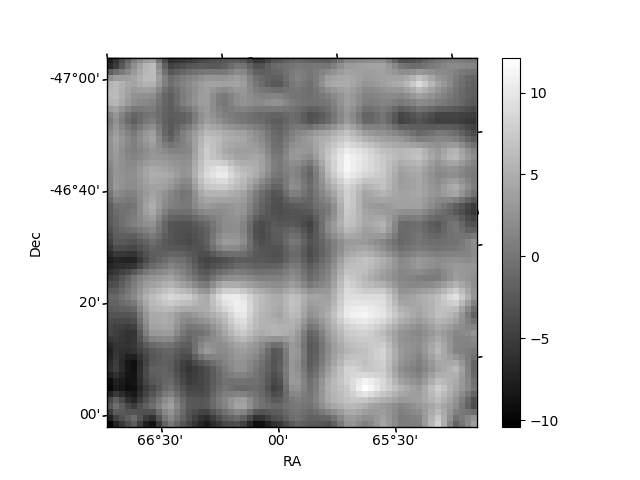
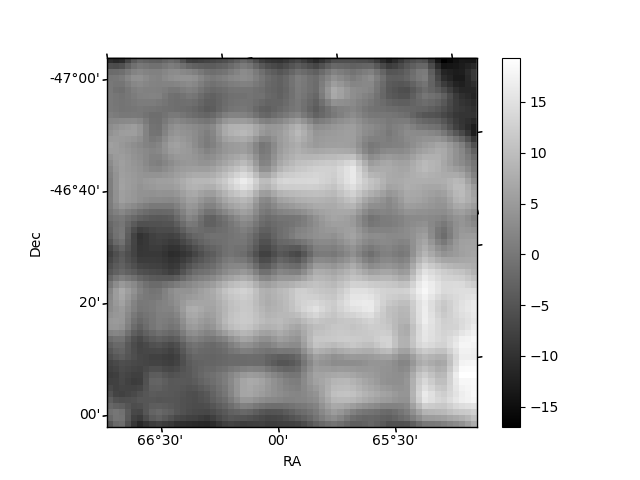
Histogram calculated using DETX and DETY for each event in the final _common_clean file
| Quadrant A | 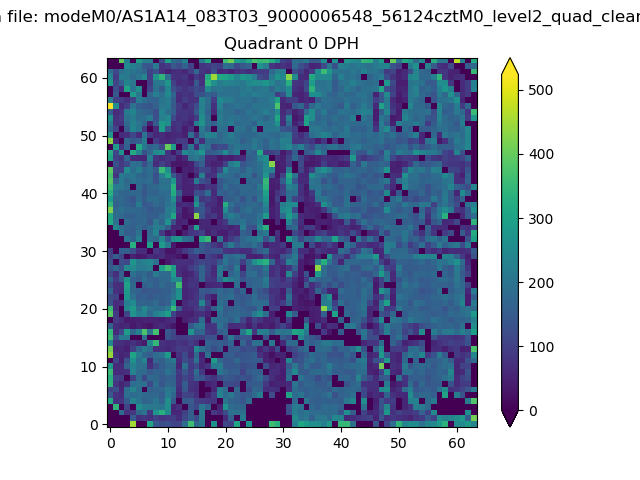 |
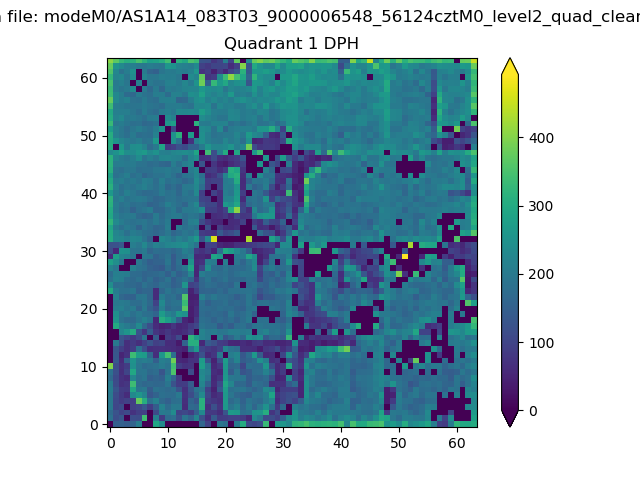 |
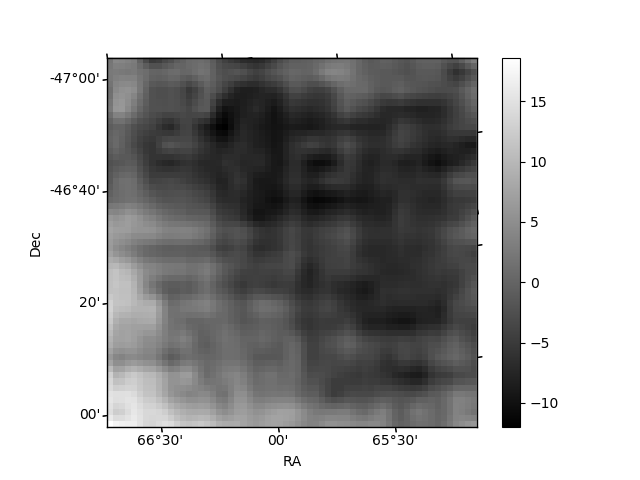
Quadrant B |
|---|---|---|---|
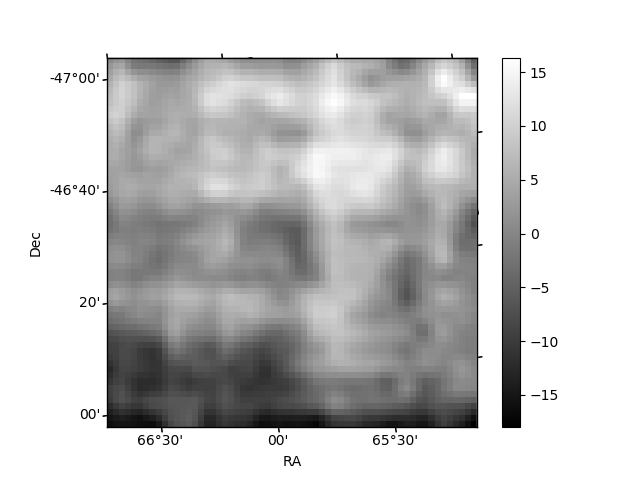
| Quadrant D | 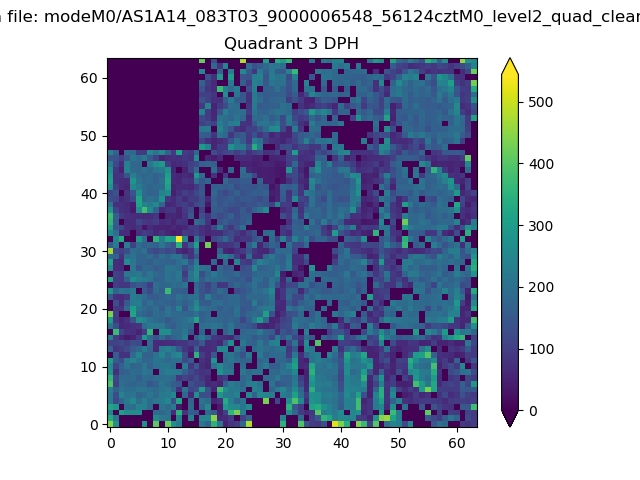 |
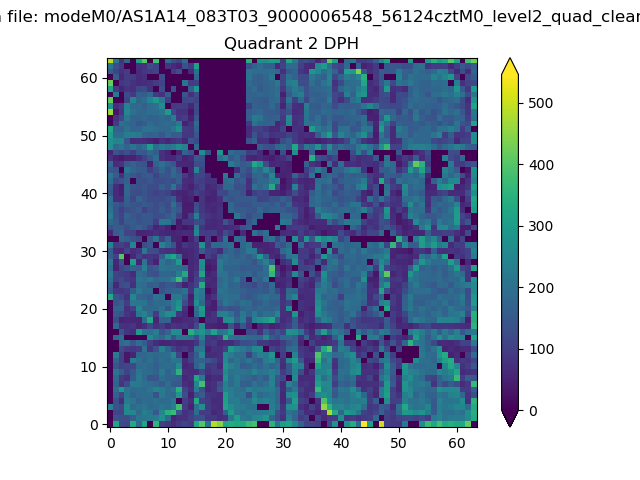 |
Quadrant C |
| Plot type | Count rate plots | Images |
|---|---|---|
| Comparison with Poisson distribution Blue bars denote a histogram of data divided into 1 sec bins. Red curve is a Poisson curve with rate = median count rate of data. |
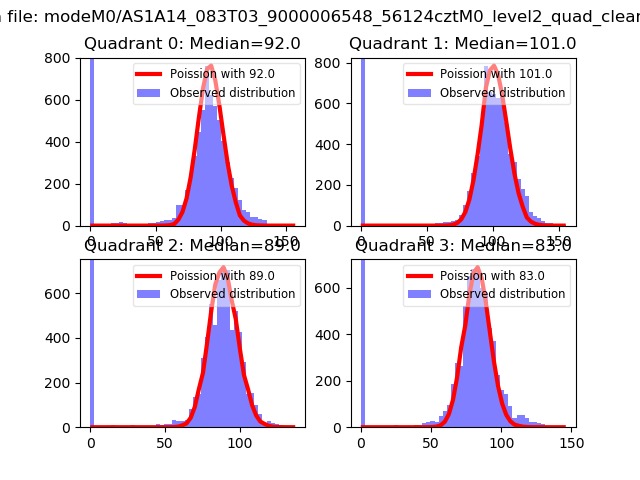 |
 |
| Quadrant-wise count rates Data is divided into 100 sec bins |
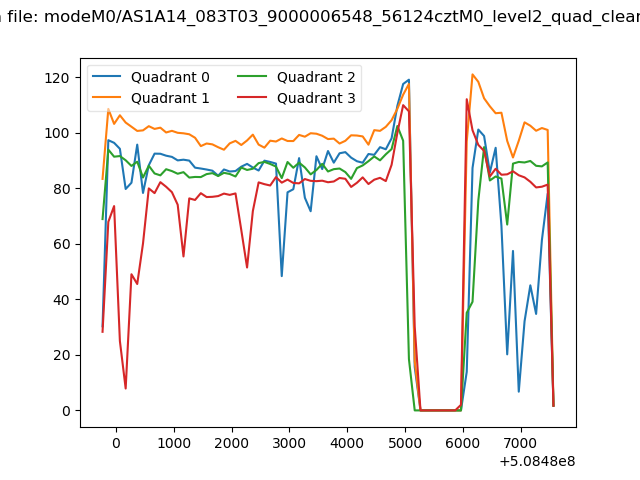 |
|
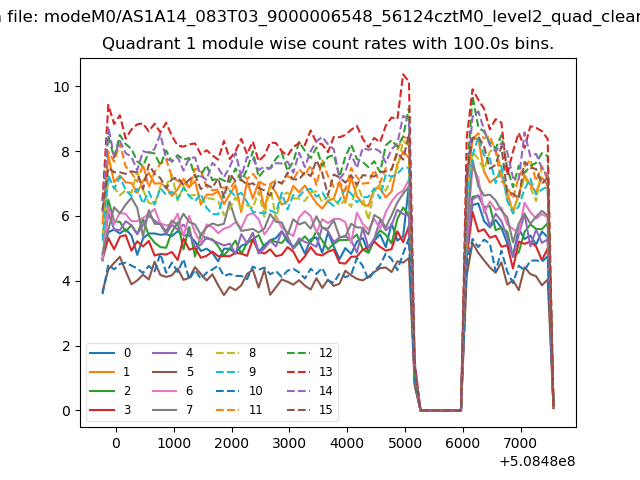
| Module-wise count rates for Quadrant A Data is divided into 100 sec bins |
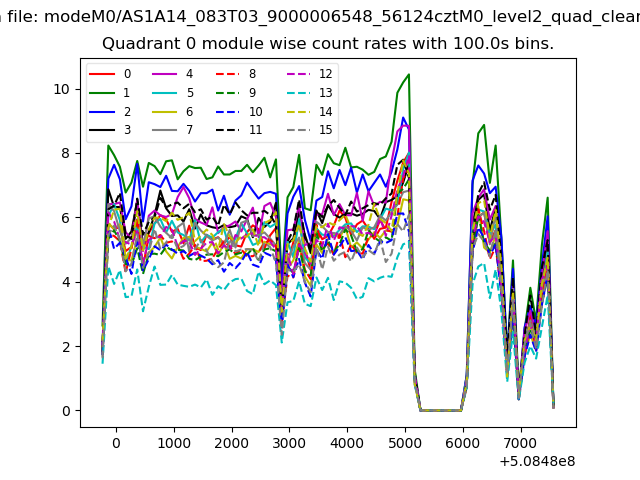 |
 |
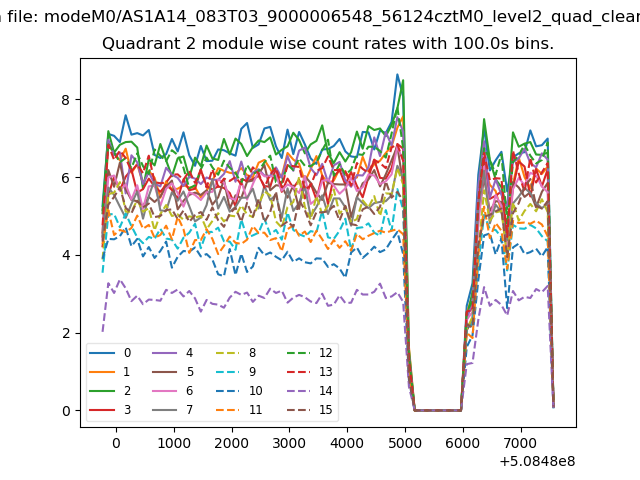
| Module-wise count rates for Quadrant B Data is divided into 100 sec bins |
 |
 |
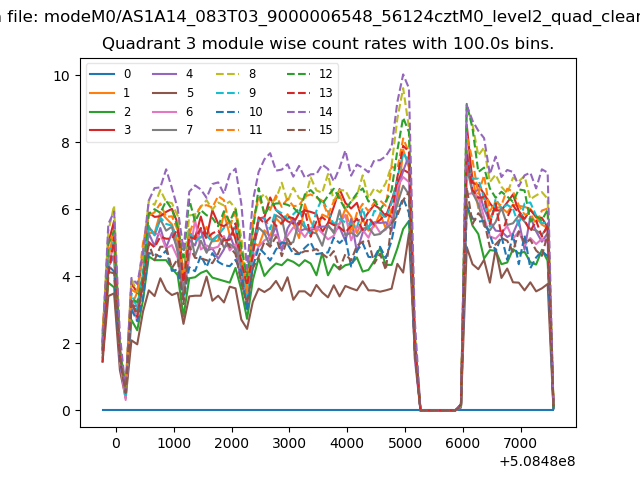
| Module-wise count rates for Quadrant C Data is divided into 100 sec bins |
 |
 |
| Module-wise count rates for Quadrant D Data is divided into 100 sec bins |
 |
 |
| Parameter | Plot |
|---|---|
| CZT HV Monitor | 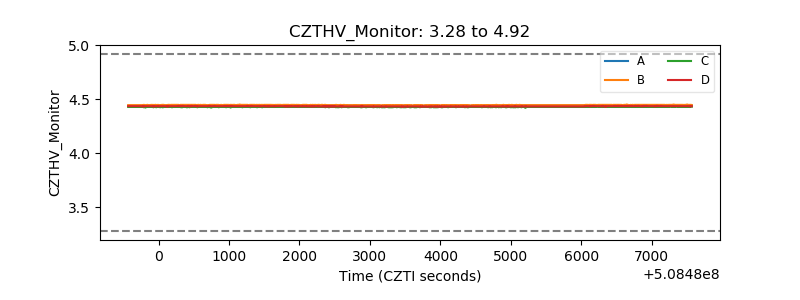 |
| D_VDD | 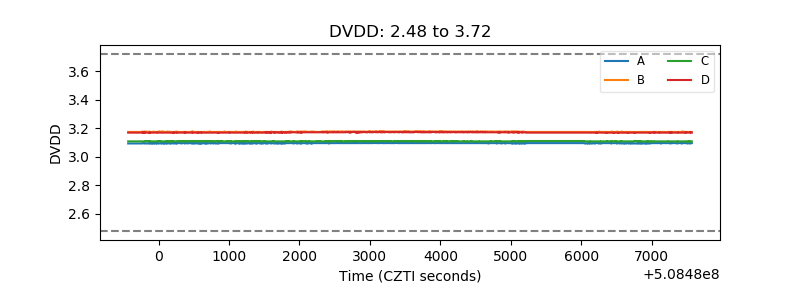 |
| Temperature 1 | 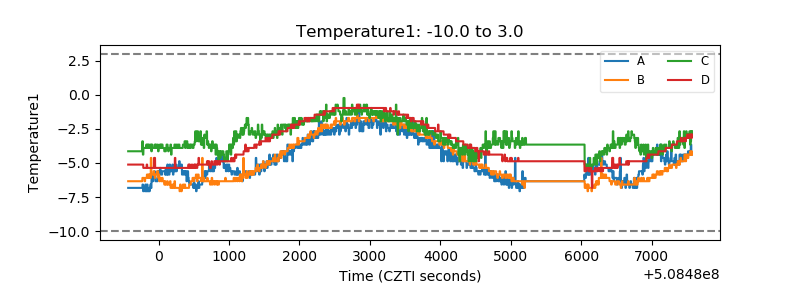 |
| Veto HV Monitor | 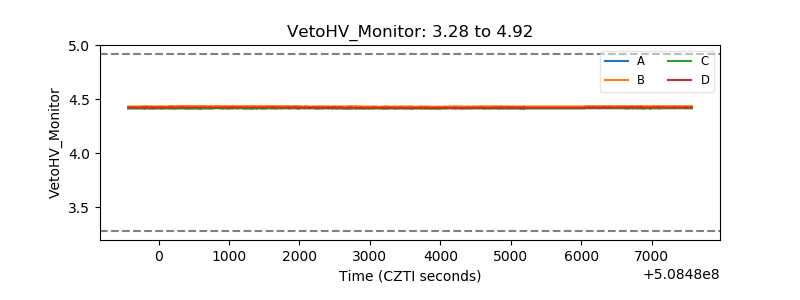 |
| Veto LLD | 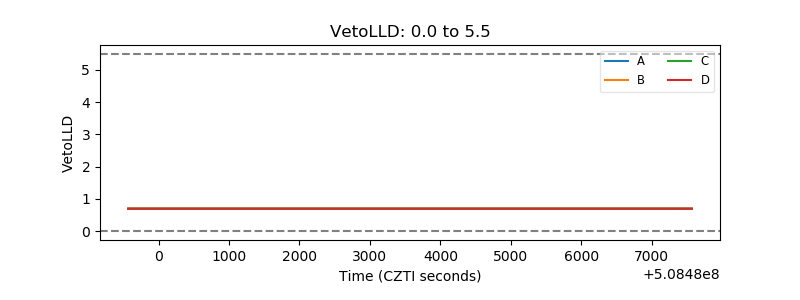 |
| Alpha Counter | 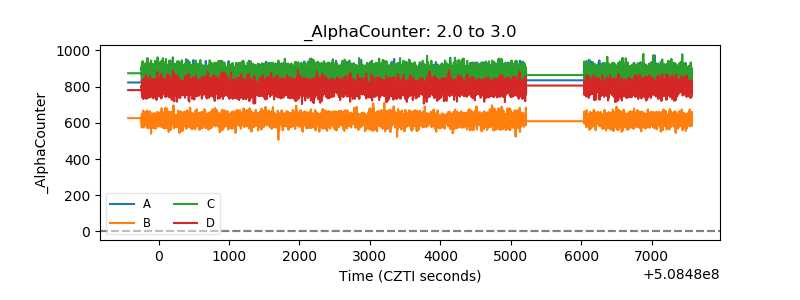 |
| _CPM_Rate | 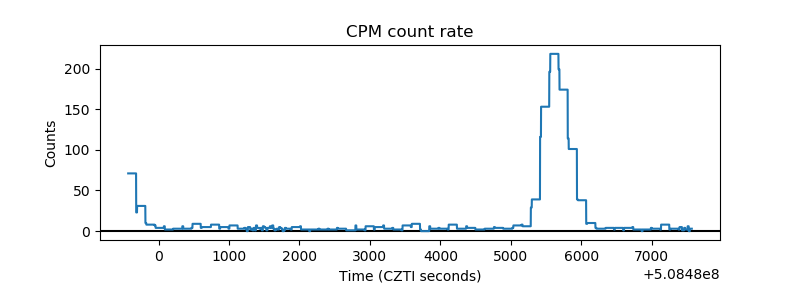 |
| CZT Counter | 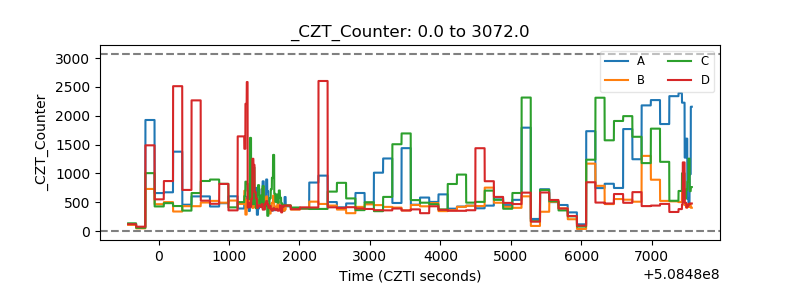 |
| +2.5 Volts monitor |  |
| +5 Volts monitor |  |
| _ROLL_ROT | 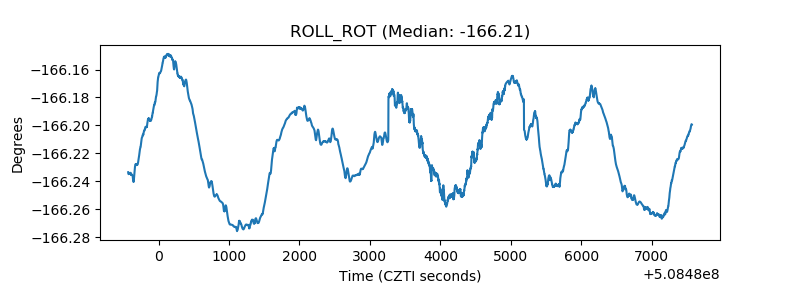 |
| _Roll_DEC | 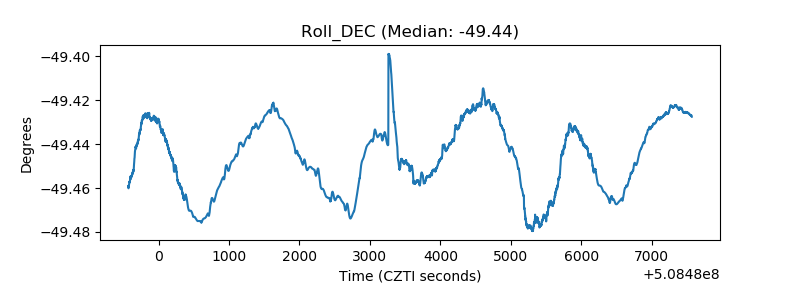 |
| _Roll_RA | 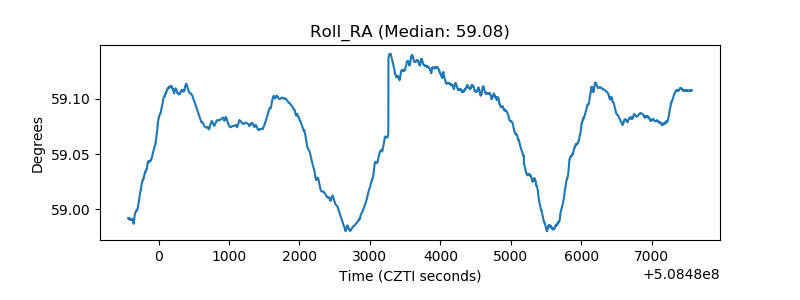 |
| Veto Counter | 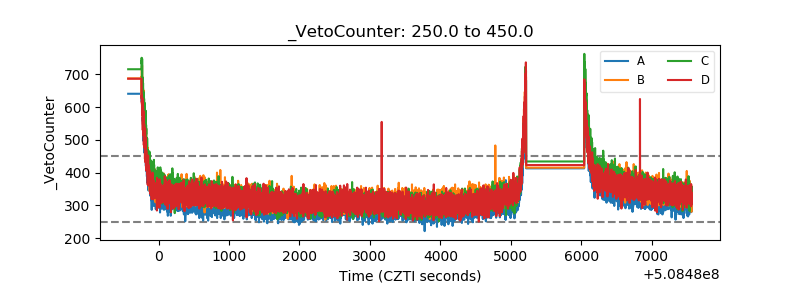 |