| Param | Original file | Final file |
|---|---|---|
| Filename | modeM0/AS1A14_083T03_9000006548_56127cztM0_level2.fits | modeM0/AS1A14_083T03_9000006548_56127cztM0_level2_quad_clean.evt |
| Size (bytes) | 2,795,883,840 | 526,132,800 |
| Size | 2.6 GB | 501.8 MB |
| Events in quadrant A | 28,620,979 | 3,260,957 |
| Events in quadrant B | 19,670,369 | 3,761,219 |
| Events in quadrant C | 30,102,646 | 3,218,933 |
| Events in quadrant D | 22,184,343 | 3,094,278 |
| Mode M0 | |||
|---|---|---|---|
| Quadrant | BADHDUFLAG | Total packets | Discarded packets |
| A | 0 | 112259 | 7 |
| B | 0 | 84945 | 7 |
| C | 0 | 116055 | 7 |
| D | 0 | 93946 | 8 |
| Mode SS | |||
|---|---|---|---|
| Quadrant | BADHDUFLAG | Total packets | Discarded packets |
| A | 0 | 768 | 0 |
| B | 0 | 768 | 0 |
| C | 0 | 768 | 0 |
| D | 0 | 768 | 0 |
| Mode M9 | |||
|---|---|---|---|
| Quadrant | BADHDUFLAG | Total packets | Discarded packets |
| A | 0 | 40 | 0 |
| B | 0 | 40 | 0 |
| C | 0 | 40 | 0 |
| D | 0 | 40 | 0 |
| Quadrant | Total seconds | Saturated seconds | Saturation percentage |
|---|---|---|---|
| A | 37759 | 3652 | 9.671866% |
| B | 37759 | 982 | 2.600704% |
| C | 37759 | 2489 | 6.591806% |
| D | 37758 | 1510 | 3.999152% |
Noise dominated data is calculated using 1-second bins in cleaned event files. If a bin has >2000 counts, and if more than 50% of those come from <1% of pixels, then it is considered to be noise-dominated and hence unusable.
| Quadrant | # 1 sec bins | Bins with >0 counts | Bins with >2000 counts | High rate bins dominated by noise | Noise dominated (total time) | Noise dominated (detector-on time) | Marked lightcurve |
|---|---|---|---|---|---|---|---|
| A | 41799 | 37763 | 2757 | 2757 | 6.60% | 7.30% | 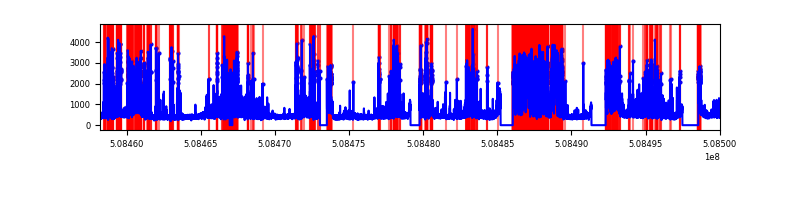 |
| B | 41799 | 37764 | 252 | 252 | 0.60% | 0.67% | 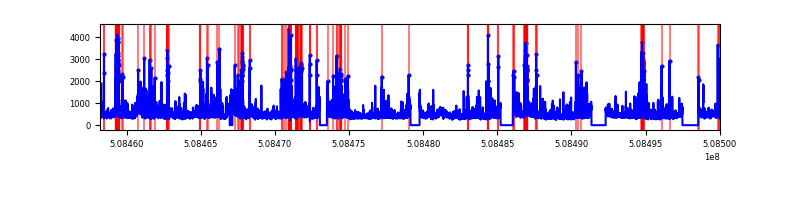 |
| C | 41799 | 37762 | 1424 | 1424 | 3.41% | 3.77% | 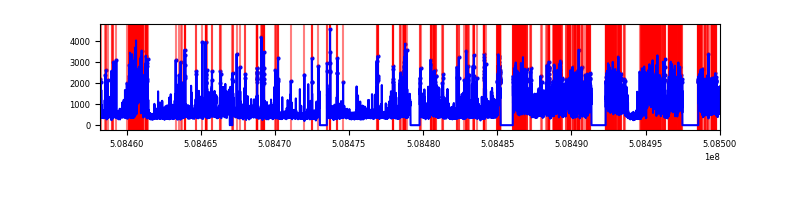 |
| D | 41798 | 37763 | 983 | 983 | 2.35% | 2.60% | 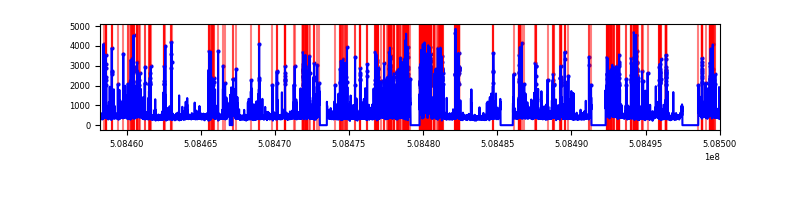 |
Top three noisy pixels from each quadrant. If the there are fewer than three noisy pixels in the level2.evt file, extra rows are filled as -1
| Pixel properties | Quadrant properties | ||||||
|---|---|---|---|---|---|---|---|
| Quadrant | DetID | PixID | Counts | Sigma | Mean | Median | Sigma |
| A | 12 | 115 | 7312429 | 7522.17 | 3932 | 3831 | 971.6 |
| A | 7 | 64 | 2569258 | 2640.39 | 3932 | 3831 | 971.6 |
| A | 15 | 32 | 992596 | 1017.66 | 3932 | 3831 | 971.6 |
| B | 9 | 254 | 854196 | 1003.03 | 4010 | 3857 | 847.8 |
| B | 4 | 156 | 764341 | 897.04 | 4010 | 3857 | 847.8 |
| B | 4 | 171 | 579060 | 678.49 | 4010 | 3857 | 847.8 |
| C | 9 | 38 | 11023282 | 10508.09 | 3875 | 3837 | 1048.7 |
| C | 12 | 252 | 1046948 | 994.71 | 3875 | 3837 | 1048.7 |
| C | 15 | 148 | 769369 | 730.01 | 3875 | 3837 | 1048.7 |
| D | 8 | 240 | 2031270 | 1847.72 | 3901 | 3727 | 1097.3 |
| D | 2 | 120 | 1368666 | 1243.89 | 3901 | 3727 | 1097.3 |
| D | 2 | 249 | 1144813 | 1039.89 | 3901 | 3727 | 1097.3 |
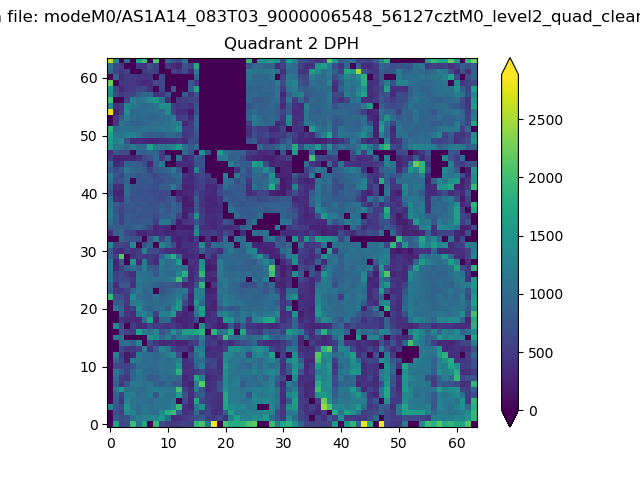
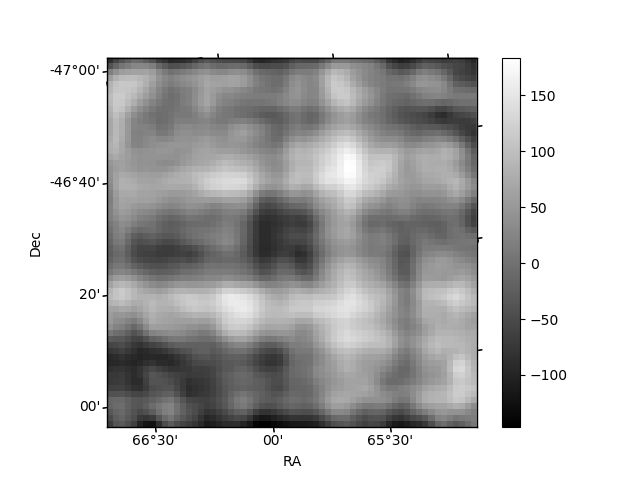
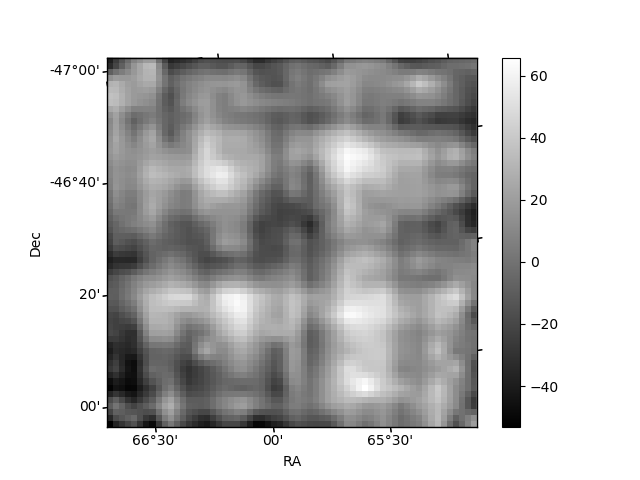
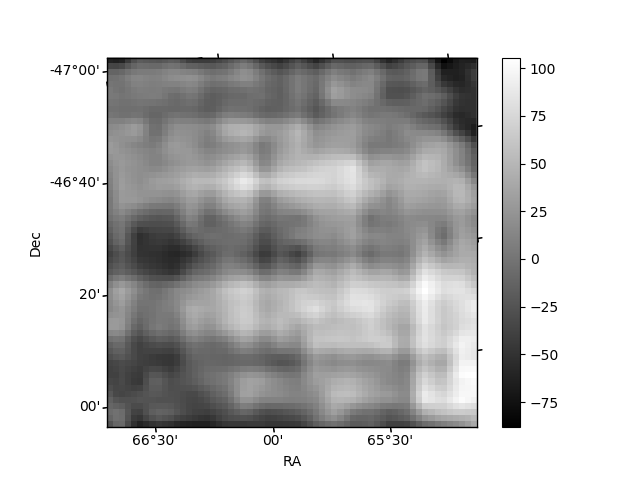
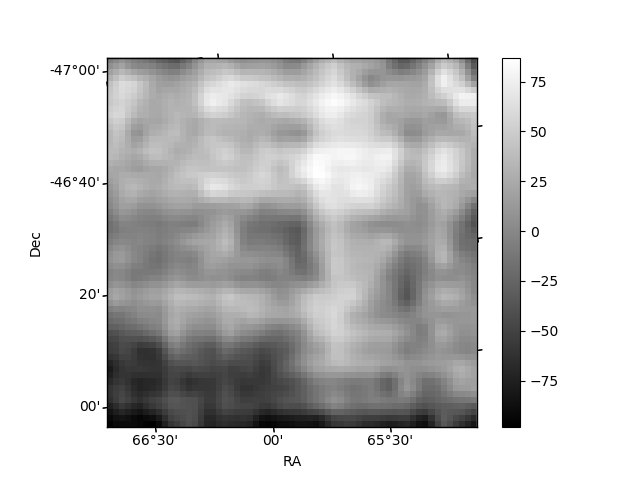
Histogram calculated using DETX and DETY for each event in the final _common_clean file
| Quadrant A | 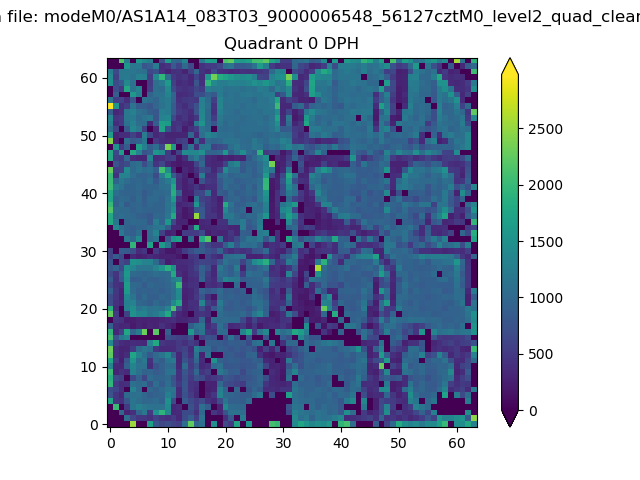 |
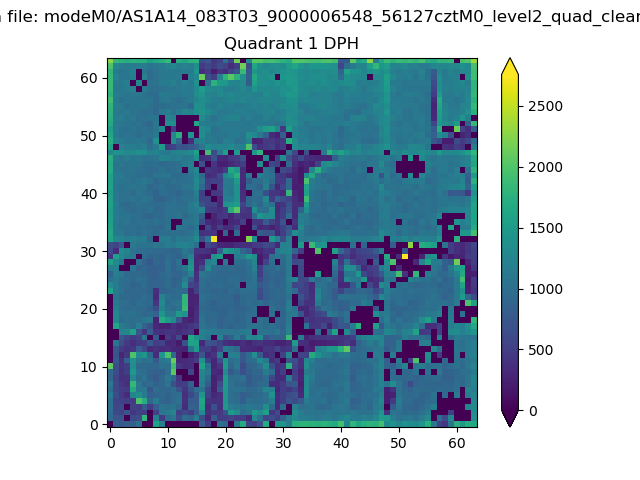 |
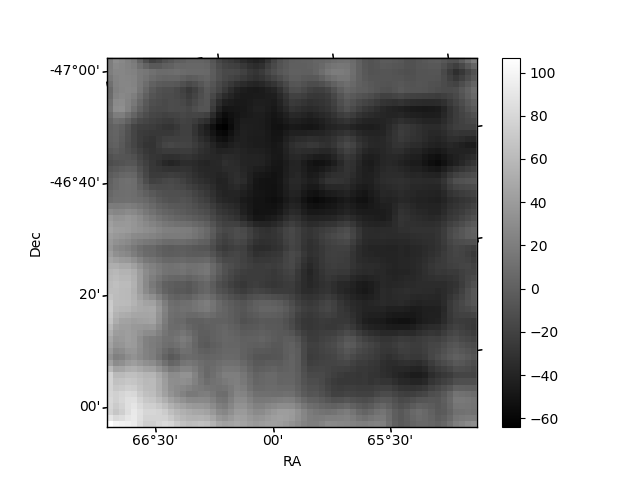
Quadrant B |
|---|---|---|---|
| Quadrant D | 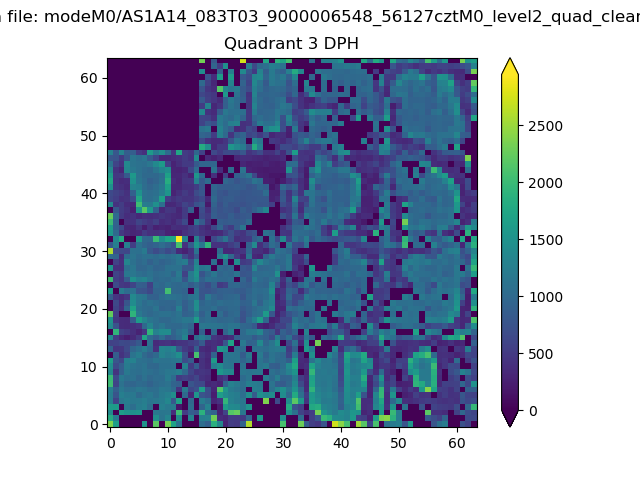 |
 |
Quadrant C |
| Plot type | Count rate plots | Images |
|---|---|---|
| Comparison with Poisson distribution Blue bars denote a histogram of data divided into 1 sec bins. Red curve is a Poisson curve with rate = median count rate of data. |
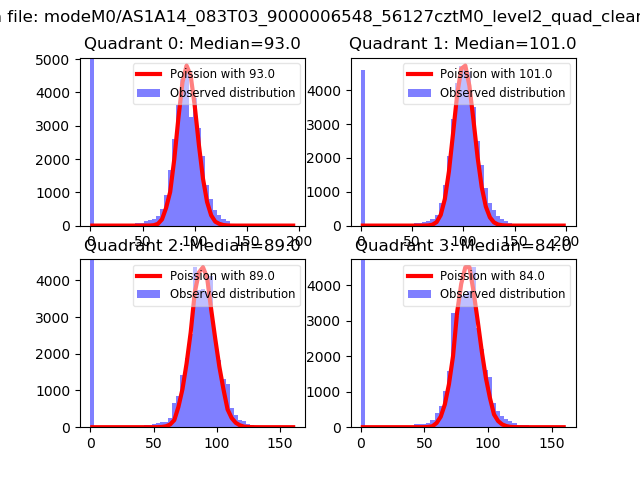 |
 |
| Quadrant-wise count rates Data is divided into 100 sec bins |
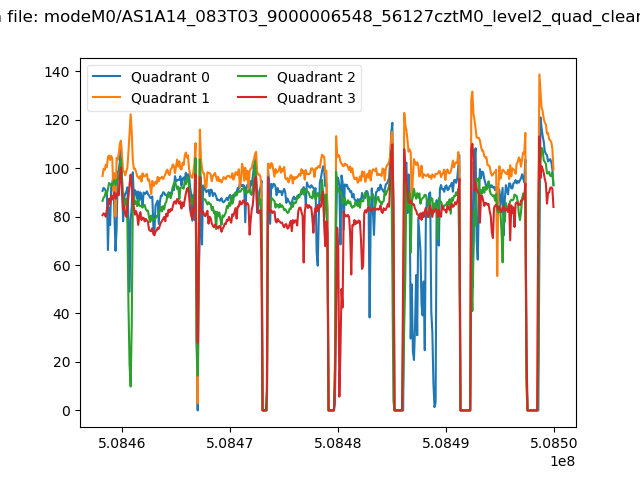 |
|
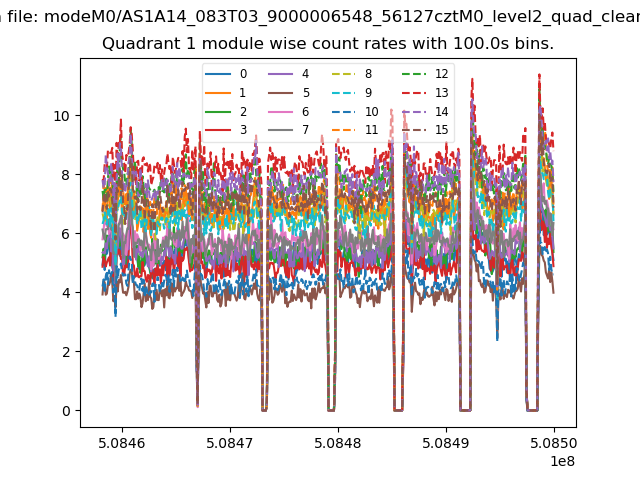
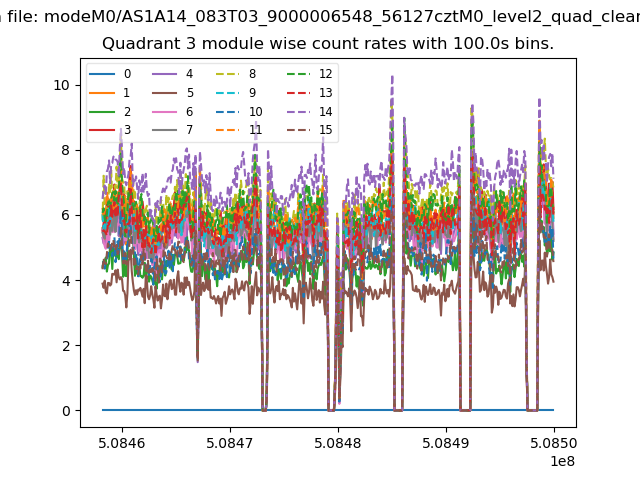
| Module-wise count rates for Quadrant A Data is divided into 100 sec bins |
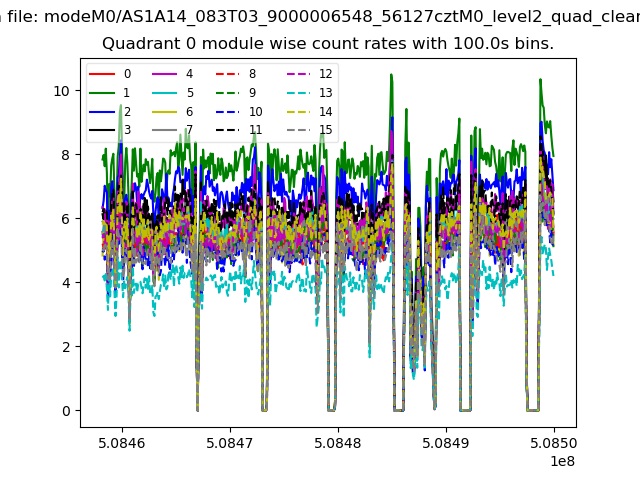 |
 |
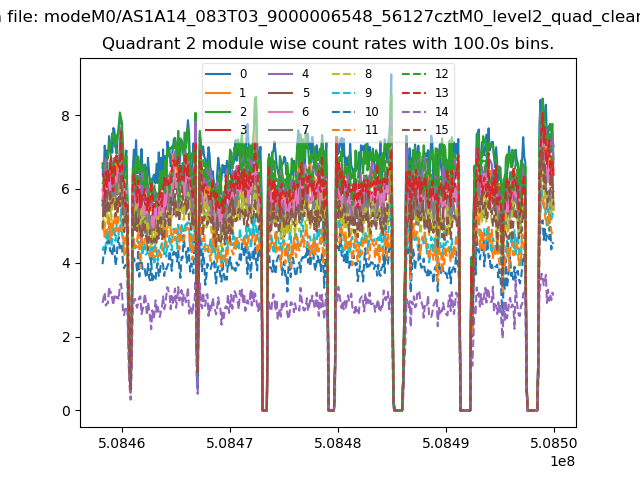
| Module-wise count rates for Quadrant B Data is divided into 100 sec bins |
 |
 |
| Module-wise count rates for Quadrant C Data is divided into 100 sec bins |
 |
 |
| Module-wise count rates for Quadrant D Data is divided into 100 sec bins |
 |
 |
| Parameter | Plot |
|---|---|
| CZT HV Monitor | 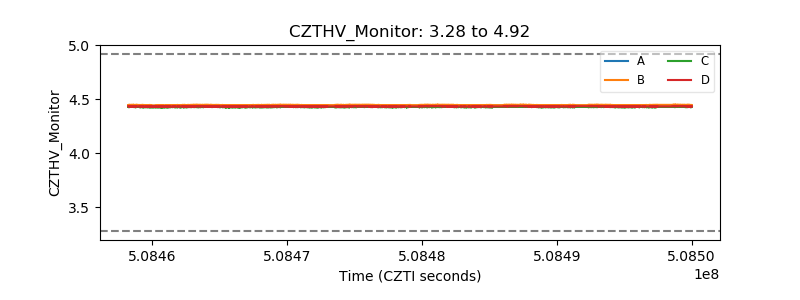 |
| D_VDD | 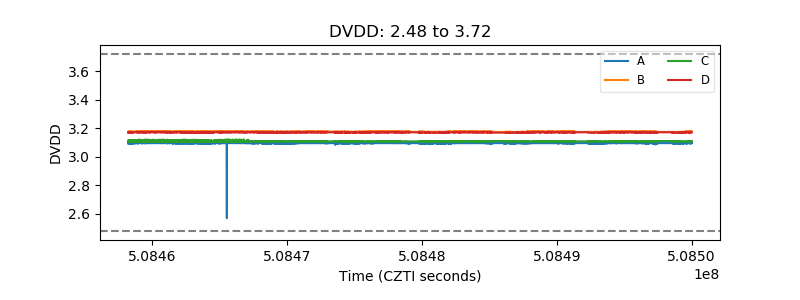 |
| Temperature 1 | 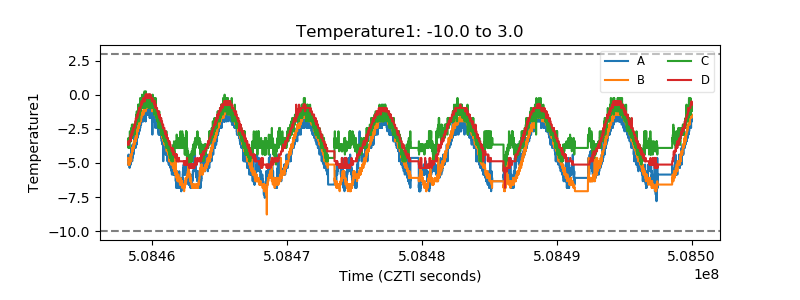 |
| Veto HV Monitor | 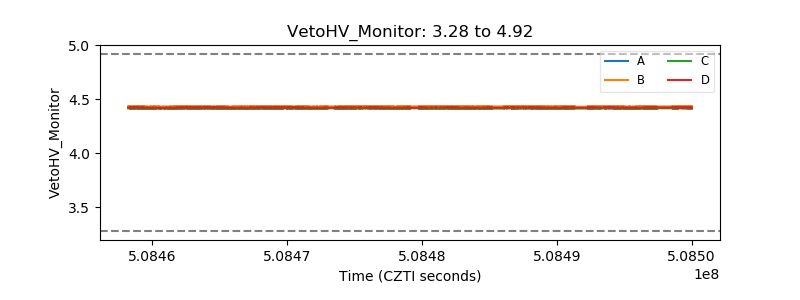 |
| Veto LLD | 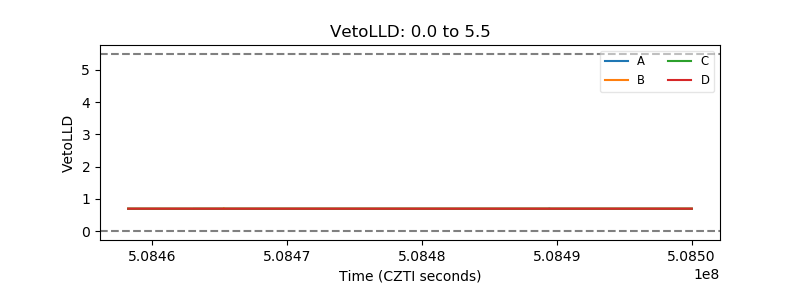 |
| Alpha Counter | 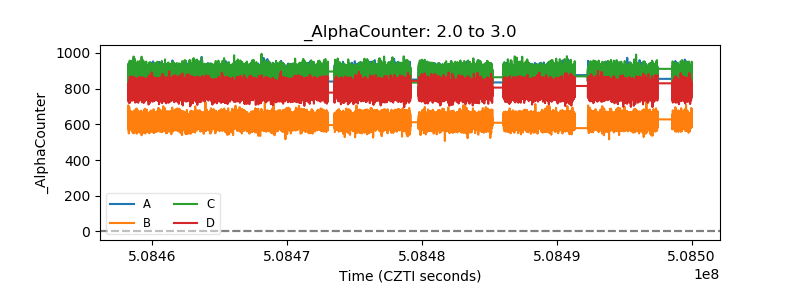 |
| _CPM_Rate | 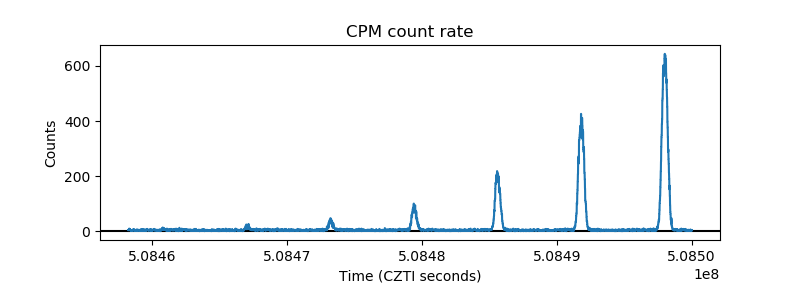 |
| CZT Counter | 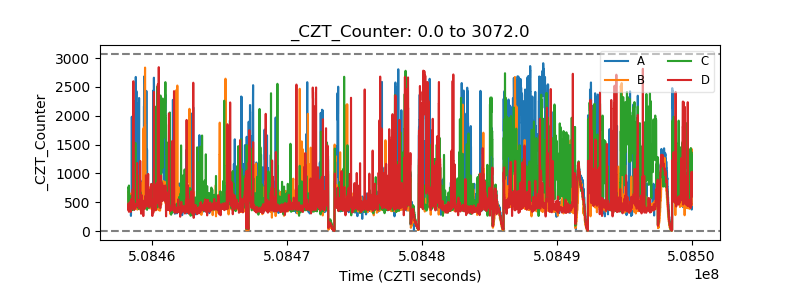 |
| +2.5 Volts monitor | 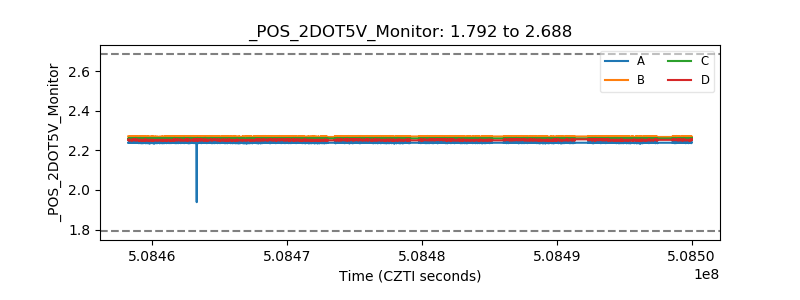 |
| +5 Volts monitor |  |
| _ROLL_ROT | 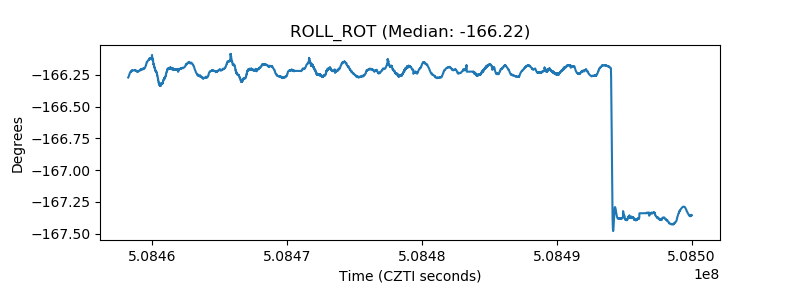 |
| _Roll_DEC | 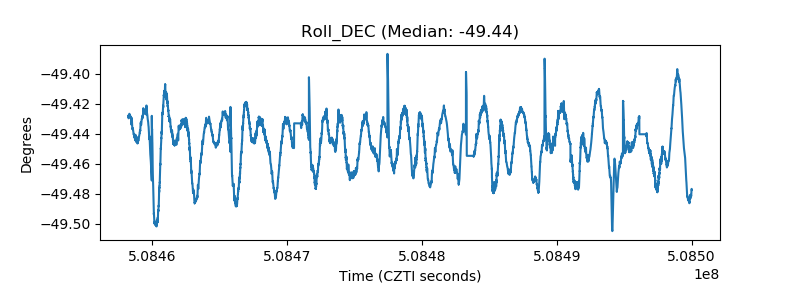 |
| _Roll_RA | 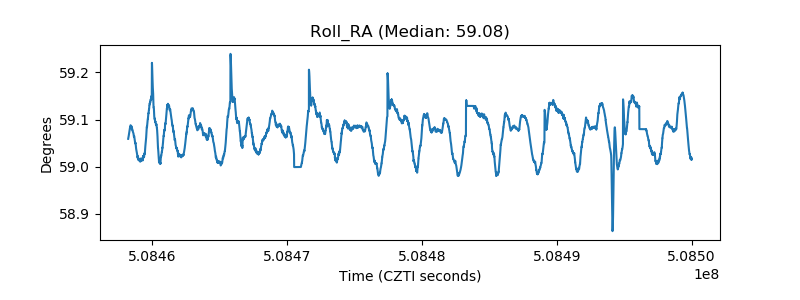 |
| Veto Counter | 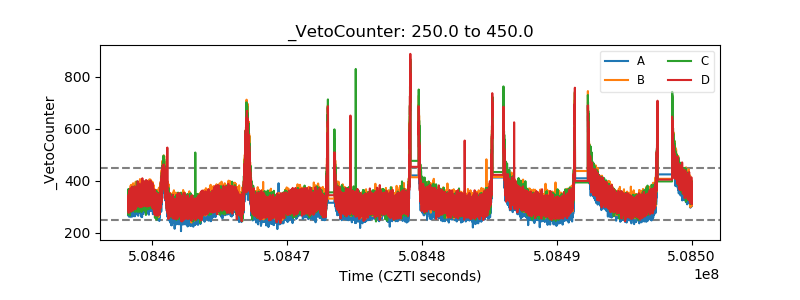 |