| Param | Original file | Final file |
|---|---|---|
| Filename | modeM0/AS1A14_083T03_9000006548_56128cztM0_level2.fits | modeM0/AS1A14_083T03_9000006548_56128cztM0_level2_quad_clean.evt |
| Size (bytes) | 623,315,520 | 96,851,520 |
| Size | 594.4 MB | 92.4 MB |
| Events in quadrant A | 4,001,914 | 660,902 |
| Events in quadrant B | 3,872,444 | 730,012 |
| Events in quadrant C | 10,617,143 | 457,787 |
| Events in quadrant D | 4,054,226 | 610,210 |
| Mode M0 | |||
|---|---|---|---|
| Quadrant | BADHDUFLAG | Total packets | Discarded packets |
| A | 0 | 16539 | 2 |
| B | 0 | 16054 | 2 |
| C | 0 | 36291 | 8 |
| D | 0 | 16859 | 2 |
| Mode SS | |||
|---|---|---|---|
| Quadrant | BADHDUFLAG | Total packets | Discarded packets |
| A | 0 | 138 | 0 |
| B | 0 | 138 | 0 |
| C | 0 | 138 | 0 |
| D | 0 | 138 | 0 |
| Mode M9 | |||
|---|---|---|---|
| Quadrant | BADHDUFLAG | Total packets | Discarded packets |
| A | 0 | 14 | 0 |
| B | 0 | 14 | 0 |
| C | 0 | 15 | 0 |
| D | 0 | 15 | 0 |
| Quadrant | Total seconds | Saturated seconds | Saturation percentage |
|---|---|---|---|
| A | 6797 | 331 | 4.869795% |
| B | 6797 | 231 | 3.398558% |
| C | 6796 | 2476 | 36.433196% |
| D | 6796 | 184 | 2.707475% |
Noise dominated data is calculated using 1-second bins in cleaned event files. If a bin has >2000 counts, and if more than 50% of those come from <1% of pixels, then it is considered to be noise-dominated and hence unusable.
| Quadrant | # 1 sec bins | Bins with >0 counts | Bins with >2000 counts | High rate bins dominated by noise | Noise dominated (total time) | Noise dominated (detector-on time) | Marked lightcurve |
|---|---|---|---|---|---|---|---|
| A | 7942 | 6797 | 216 | 216 | 2.72% | 3.18% | 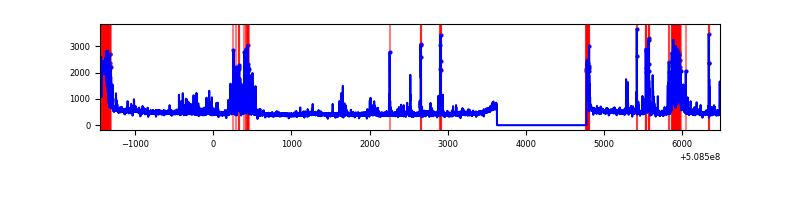 |
| B | 7942 | 6798 | 129 | 129 | 1.62% | 1.90% | 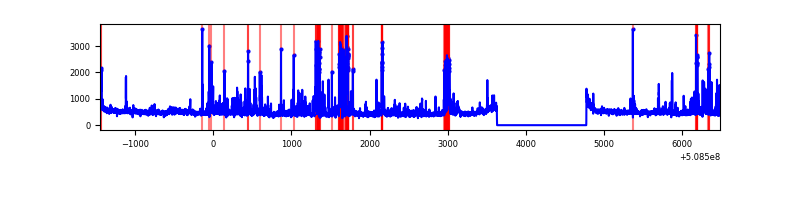 |
| C | 7941 | 6796 | 1705 | 1705 | 21.47% | 25.09% | 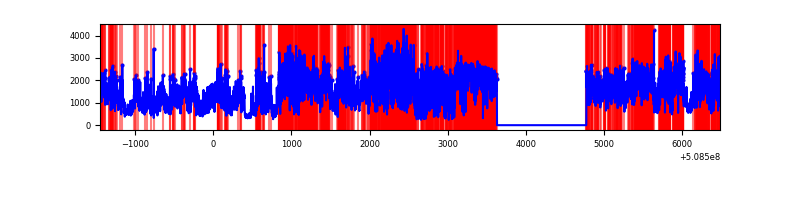 |
| D | 7941 | 6797 | 104 | 104 | 1.31% | 1.53% | 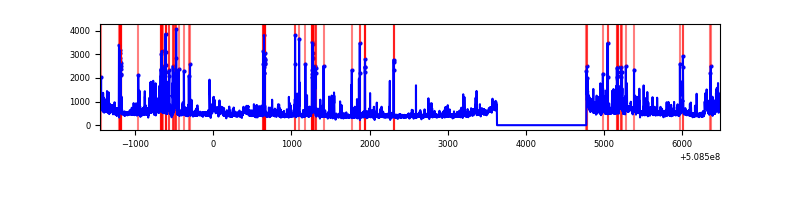 |
Top three noisy pixels from each quadrant. If the there are fewer than three noisy pixels in the level2.evt file, extra rows are filled as -1
| Pixel properties | Quadrant properties | ||||||
|---|---|---|---|---|---|---|---|
| Quadrant | DetID | PixID | Counts | Sigma | Mean | Median | Sigma |
| A | 8 | 237 | 327085 | 1785.23 | 744 | 725 | 182.8 |
| A | 8 | 253 | 215494 | 1174.81 | 744 | 725 | 182.8 |
| A | 0 | 8 | 126656 | 688.86 | 744 | 725 | 182.8 |
| B | 4 | 171 | 305521 | 1923.36 | 745 | 718 | 158.5 |
| B | 5 | 185 | 226825 | 1426.77 | 745 | 718 | 158.5 |
| B | 0 | 213 | 114462 | 717.74 | 745 | 718 | 158.5 |
| C | 9 | 38 | 5429181 | 33359.81 | 589 | 582 | 162.7 |
| C | 15 | 147 | 1911593 | 11743.54 | 589 | 582 | 162.7 |
| C | 15 | 148 | 468779 | 2877.16 | 589 | 582 | 162.7 |
| D | 2 | 31 | 330639 | 1608.17 | 732 | 699 | 205.2 |
| D | 2 | 120 | 313987 | 1527.01 | 732 | 699 | 205.2 |
| D | 2 | 249 | 116909 | 566.42 | 732 | 699 | 205.2 |
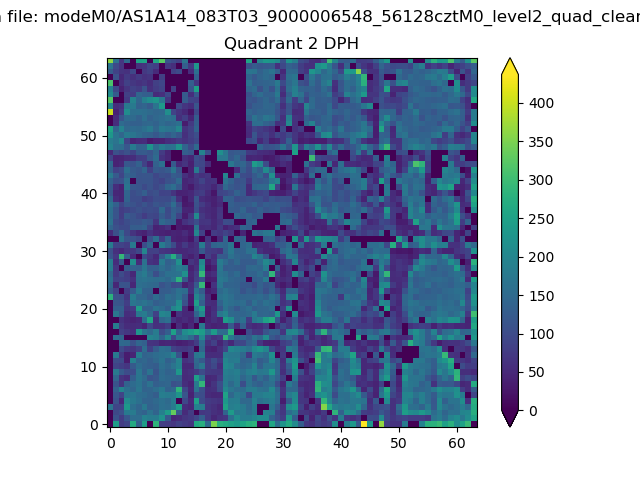
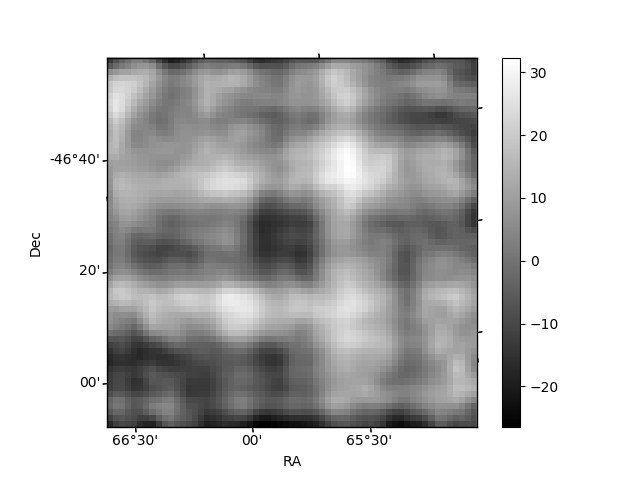
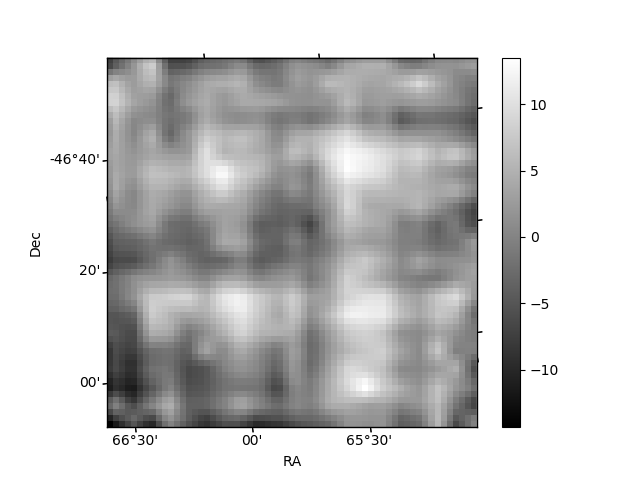
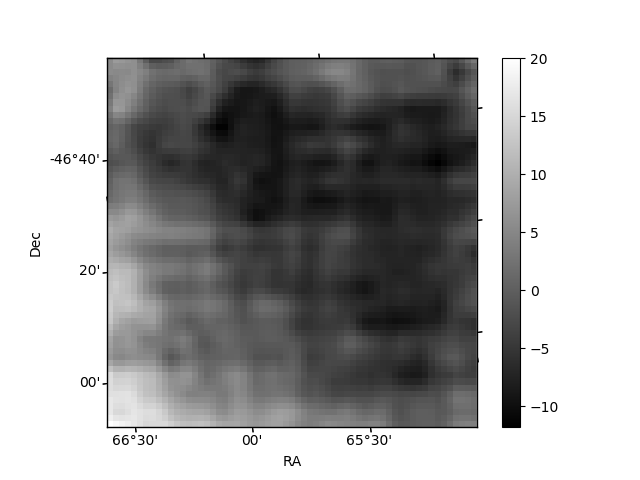
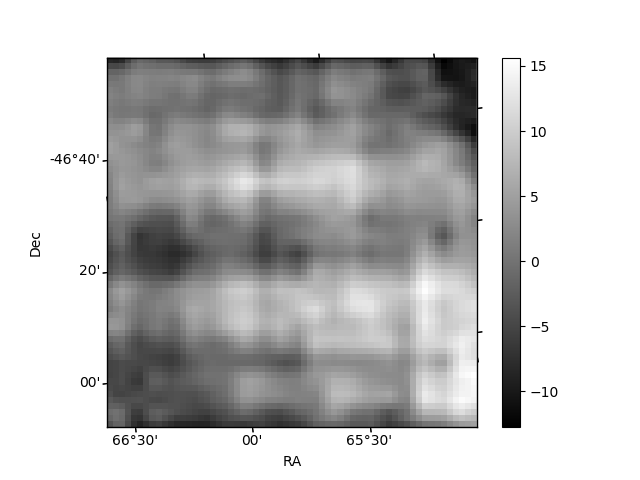
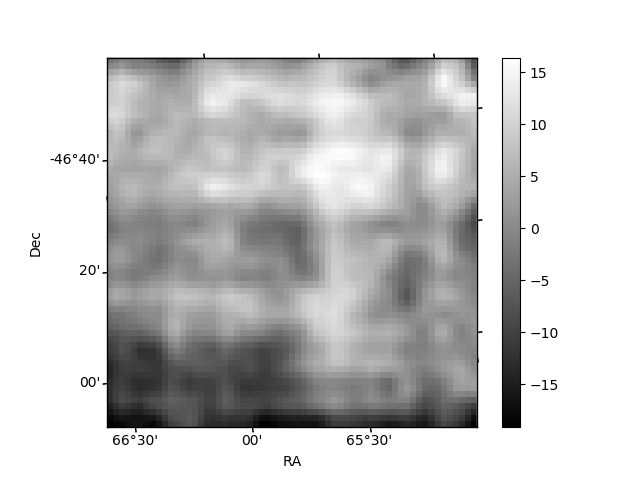
Histogram calculated using DETX and DETY for each event in the final _common_clean file
| Quadrant A | 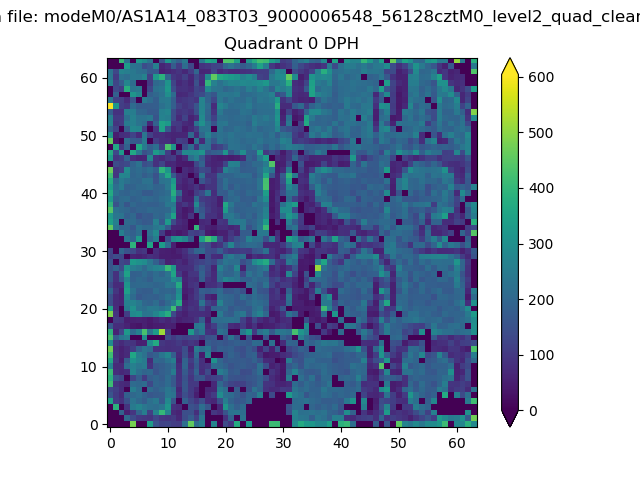 |
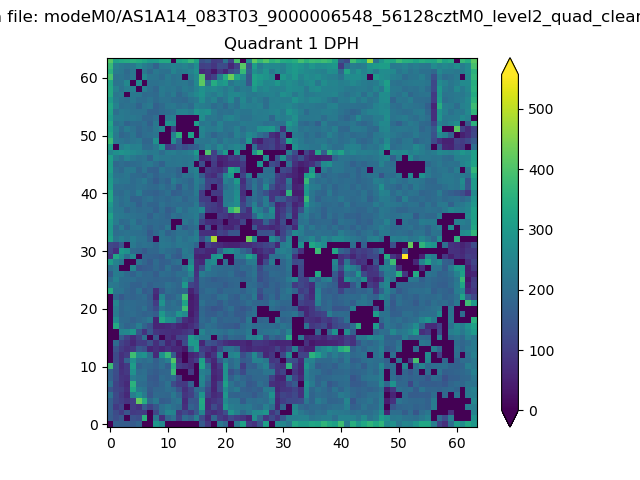 |
Quadrant B |
|---|---|---|---|
| Quadrant D | 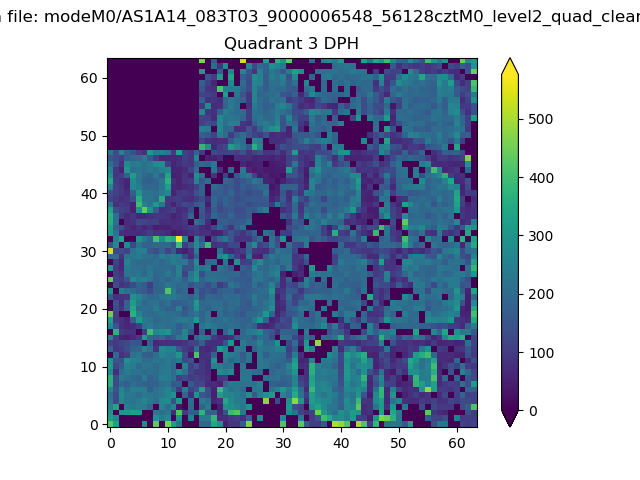 |
 |
Quadrant C |
| Plot type | Count rate plots | Images |
|---|---|---|
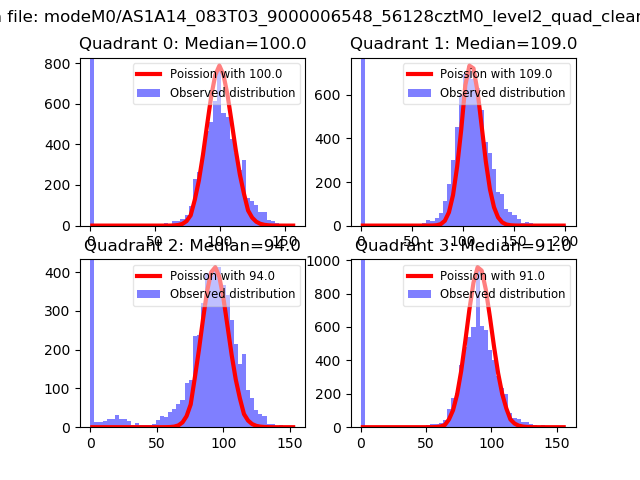
| Comparison with Poisson distribution Blue bars denote a histogram of data divided into 1 sec bins. Red curve is a Poisson curve with rate = median count rate of data. |
 |
 |
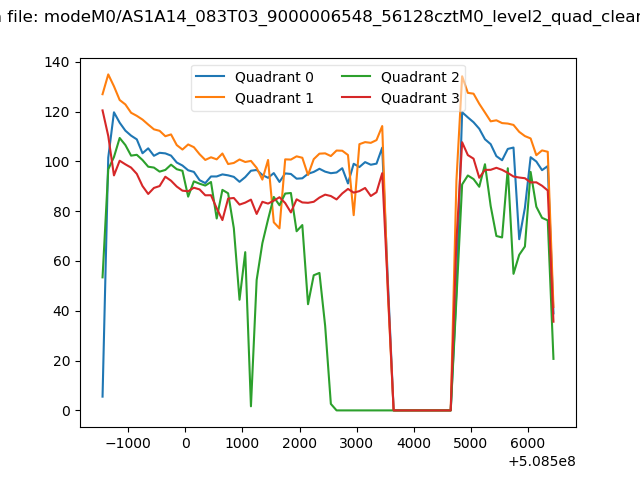
| Quadrant-wise count rates Data is divided into 100 sec bins |
 |
|
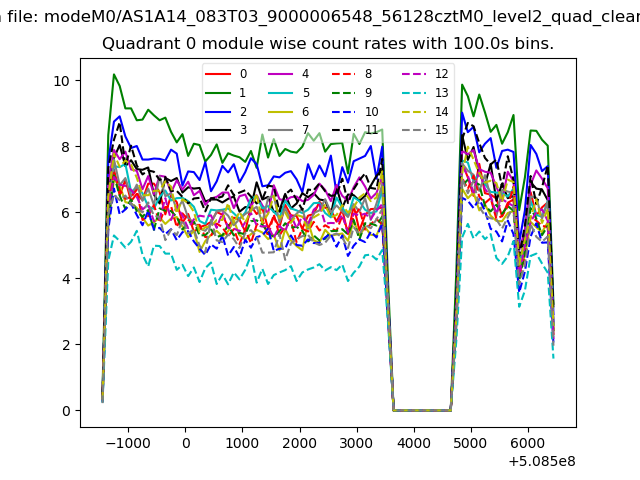
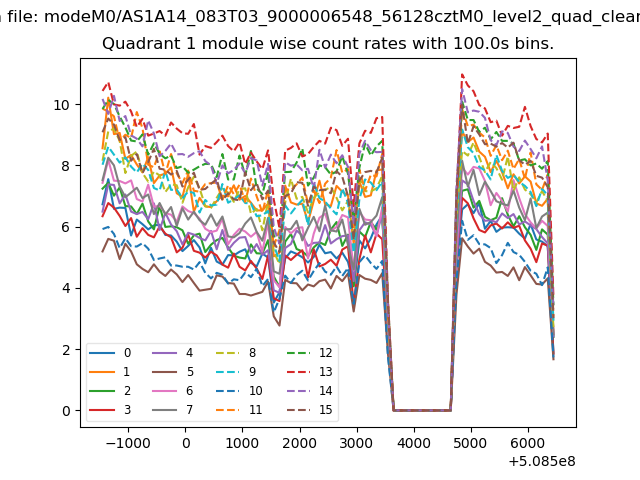
| Module-wise count rates for Quadrant A Data is divided into 100 sec bins |
 |
 |
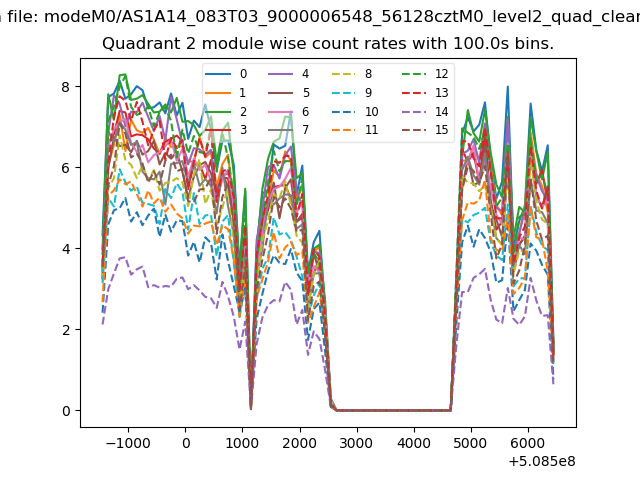
| Module-wise count rates for Quadrant B Data is divided into 100 sec bins |
 |
 |
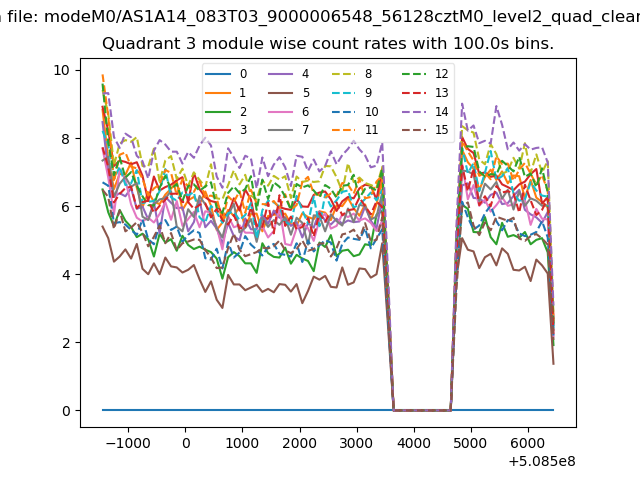
| Module-wise count rates for Quadrant C Data is divided into 100 sec bins |
 |
 |
| Module-wise count rates for Quadrant D Data is divided into 100 sec bins |
 |
 |
| Parameter | Plot |
|---|---|
| CZT HV Monitor | 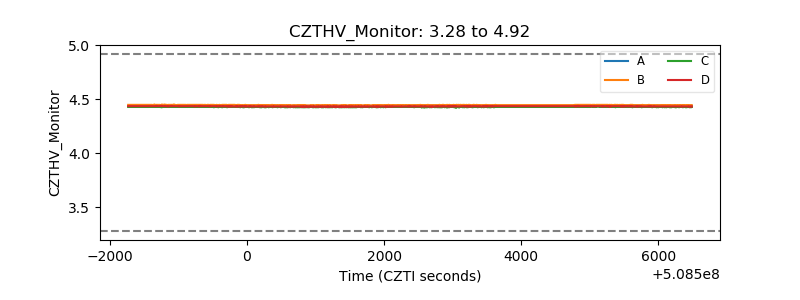 |
| D_VDD | 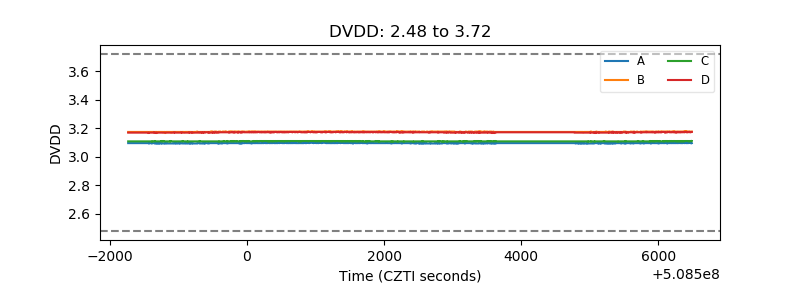 |
| Temperature 1 | 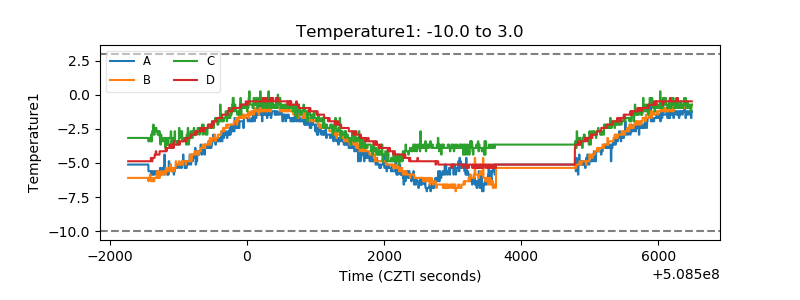 |
| Veto HV Monitor | 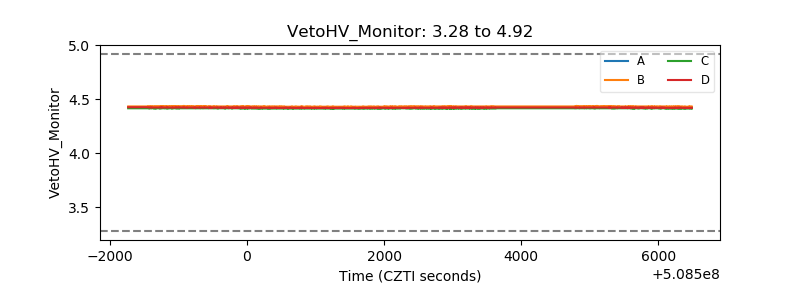 |
| Veto LLD | 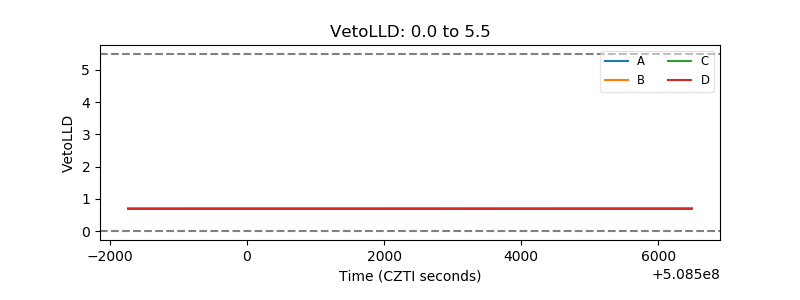 |
| Alpha Counter | 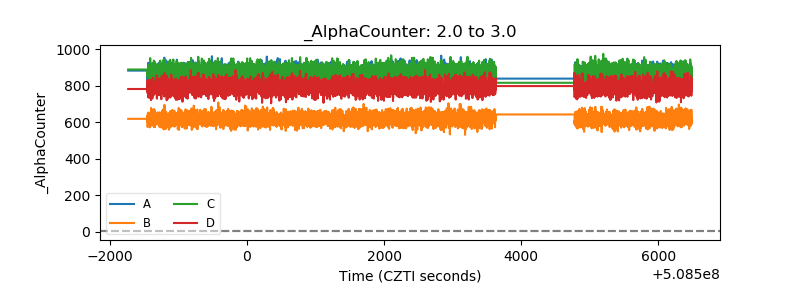 |
| _CPM_Rate | 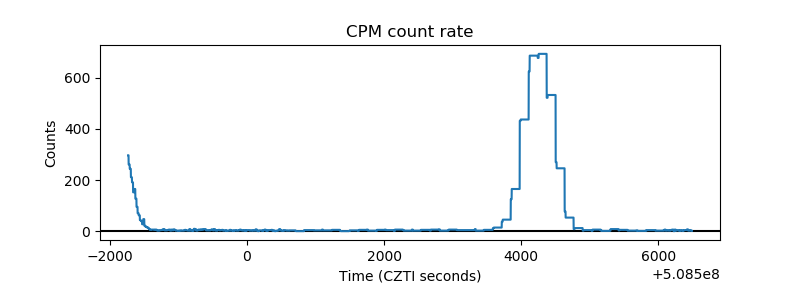 |
| CZT Counter | 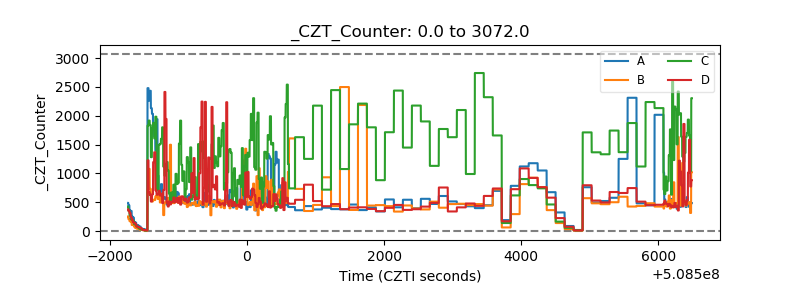 |
| +2.5 Volts monitor | 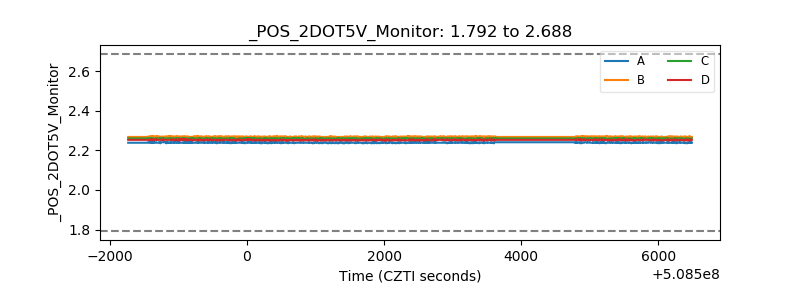 |
| +5 Volts monitor | 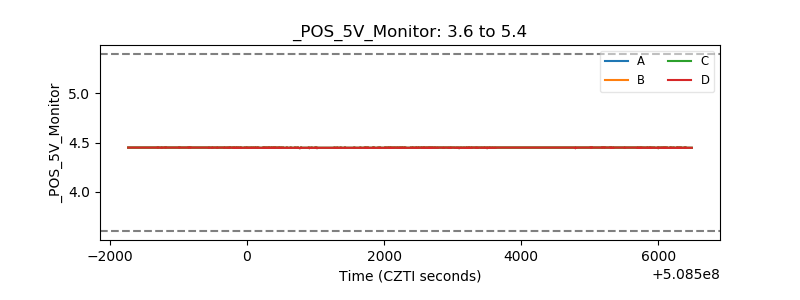 |
| _ROLL_ROT | 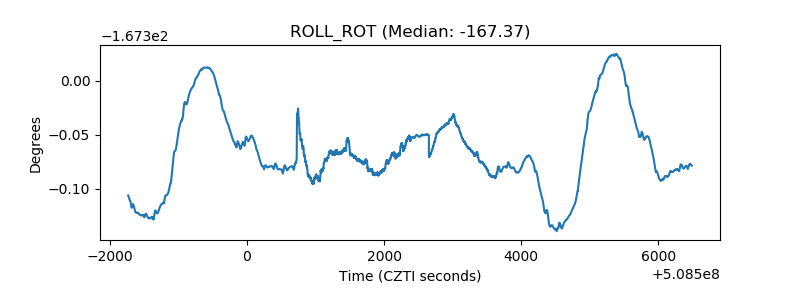 |
| _Roll_DEC | 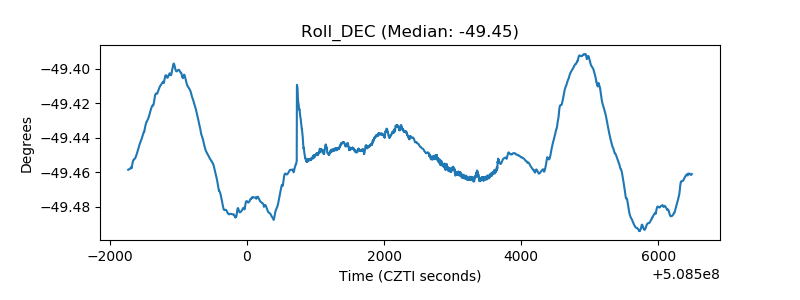 |
| _Roll_RA | 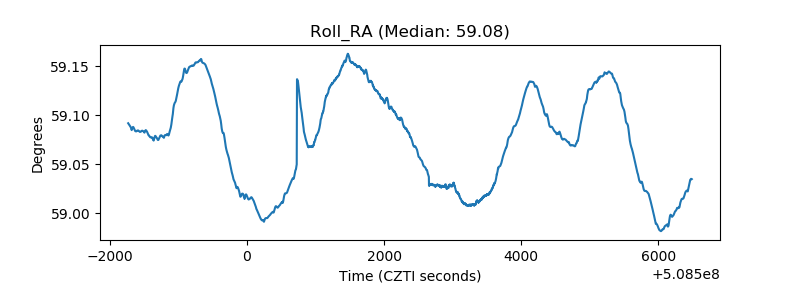 |
| Veto Counter | 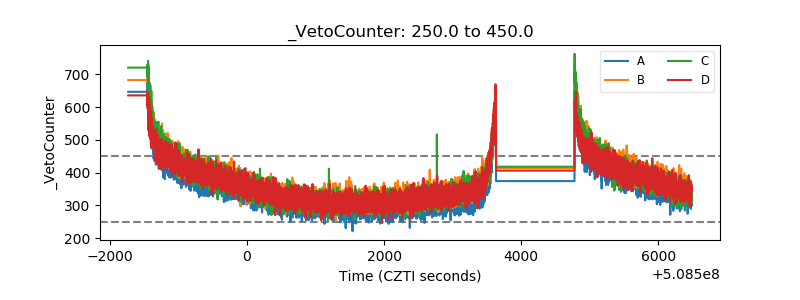 |