| Param | Original file | Final file |
|---|---|---|
| Filename | modeM0/AS1A14_083T03_9000006548_56129cztM0_level2.fits | modeM0/AS1A14_083T03_9000006548_56129cztM0_level2_quad_clean.evt |
| Size (bytes) | 718,197,120 | 85,633,920 |
| Size | 684.9 MB | 81.7 MB |
| Events in quadrant A | 7,415,231 | 478,804 |
| Events in quadrant B | 4,251,646 | 668,329 |
| Events in quadrant C | 10,339,792 | 426,273 |
| Events in quadrant D | 4,078,533 | 569,473 |
| Mode M0 | |||
|---|---|---|---|
| Quadrant | BADHDUFLAG | Total packets | Discarded packets |
| A | 0 | 26412 | 1 |
| B | 0 | 17054 | 1 |
| C | 0 | 35162 | 1 |
| D | 0 | 16730 | 5 |
| Mode SS | |||
|---|---|---|---|
| Quadrant | BADHDUFLAG | Total packets | Discarded packets |
| A | 0 | 130 | 0 |
| B | 0 | 130 | 0 |
| C | 0 | 130 | 0 |
| D | 0 | 130 | 0 |
| Mode M9 | |||
|---|---|---|---|
| Quadrant | BADHDUFLAG | Total packets | Discarded packets |
| A | 0 | 12 | 0 |
| B | 0 | 12 | 0 |
| C | 0 | 12 | 0 |
| D | 0 | 12 | 0 |
| Quadrant | Total seconds | Saturated seconds | Saturation percentage |
|---|---|---|---|
| A | 6450 | 1774 | 27.503876% |
| B | 6450 | 409 | 6.341085% |
| C | 6451 | 2384 | 36.955511% |
| D | 6450 | 184 | 2.852713% |
Noise dominated data is calculated using 1-second bins in cleaned event files. If a bin has >2000 counts, and if more than 50% of those come from <1% of pixels, then it is considered to be noise-dominated and hence unusable.
| Quadrant | # 1 sec bins | Bins with >0 counts | Bins with >2000 counts | High rate bins dominated by noise | Noise dominated (total time) | Noise dominated (detector-on time) | Marked lightcurve |
|---|---|---|---|---|---|---|---|
| A | 7570 | 6450 | 1581 | 1581 | 20.89% | 24.51% | 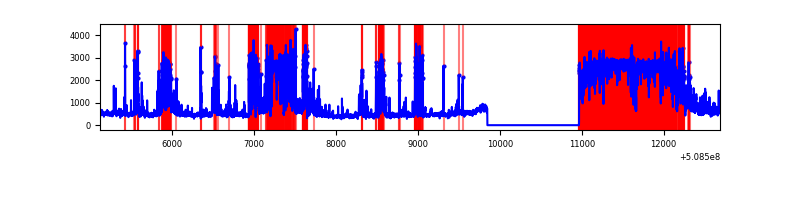 |
| B | 7570 | 6450 | 185 | 185 | 2.44% | 2.87% | 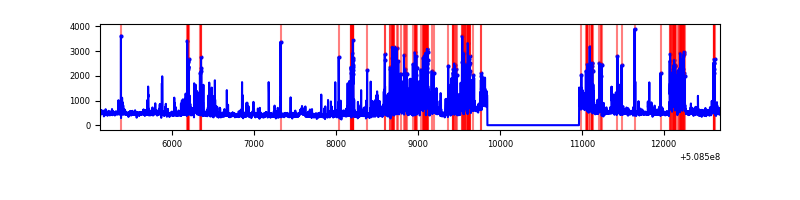 |
| C | 7571 | 6451 | 2011 | 2011 | 26.56% | 31.17% | 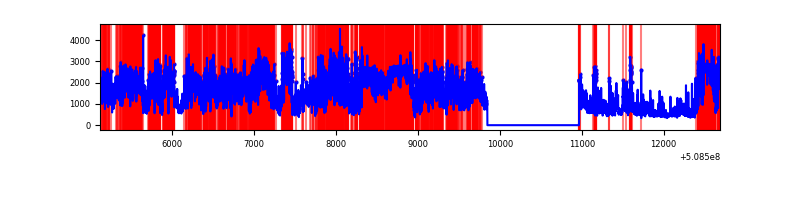 |
| D | 7570 | 6450 | 148 | 148 | 1.96% | 2.29% | 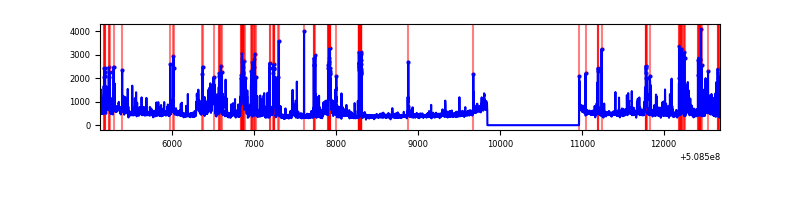 |
Top three noisy pixels from each quadrant. If the there are fewer than three noisy pixels in the level2.evt file, extra rows are filled as -1
| Pixel properties | Quadrant properties | ||||||
|---|---|---|---|---|---|---|---|
| Quadrant | DetID | PixID | Counts | Sigma | Mean | Median | Sigma |
| A | 12 | 115 | 2693949 | 17742.14 | 613 | 598 | 151.8 |
| A | 15 | 32 | 953681 | 6278.33 | 613 | 598 | 151.8 |
| A | 0 | 8 | 780617 | 5138.29 | 613 | 598 | 151.8 |
| B | 5 | 185 | 993386 | 6832.61 | 688 | 667 | 145.3 |
| B | 10 | 247 | 165045 | 1131.37 | 688 | 667 | 145.3 |
| B | 4 | 171 | 89565 | 611.86 | 688 | 667 | 145.3 |
| C | 9 | 38 | 4809950 | 30511.52 | 573 | 567 | 157.6 |
| C | 15 | 147 | 1795120 | 11384.94 | 573 | 567 | 157.6 |
| C | 15 | 148 | 1174636 | 7448.49 | 573 | 567 | 157.6 |
| D | 2 | 120 | 377034 | 1963.83 | 679 | 647 | 191.7 |
| D | 14 | 52 | 242590 | 1262.36 | 679 | 647 | 191.7 |
| D | 2 | 249 | 232027 | 1207.24 | 679 | 647 | 191.7 |
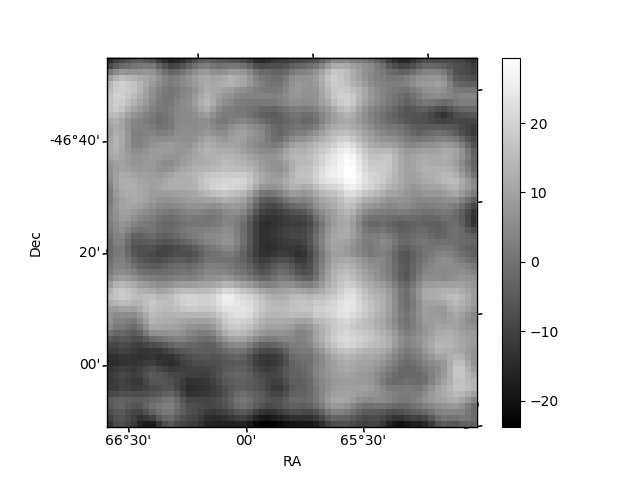
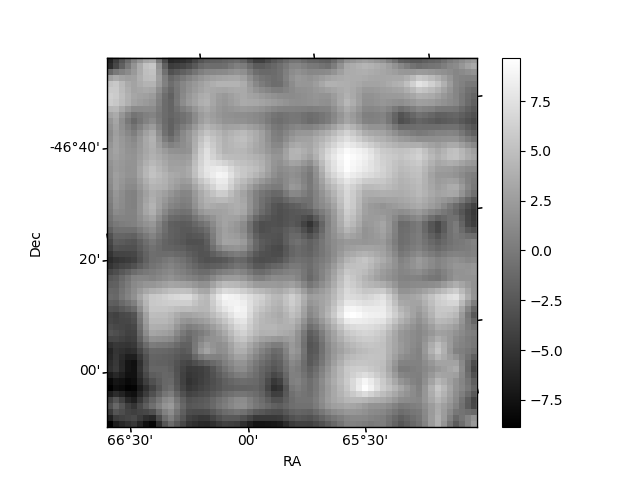
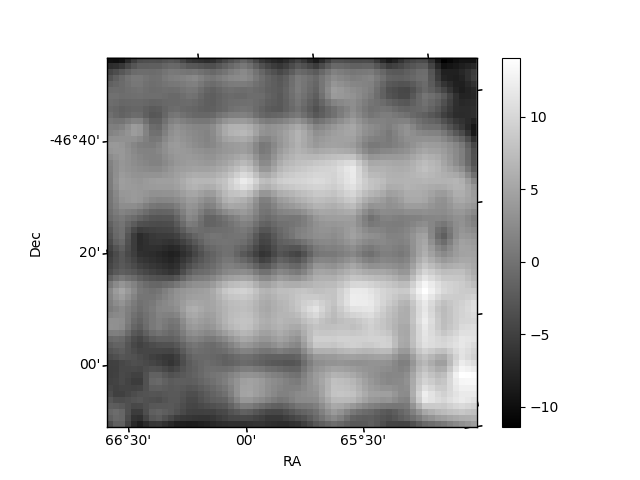
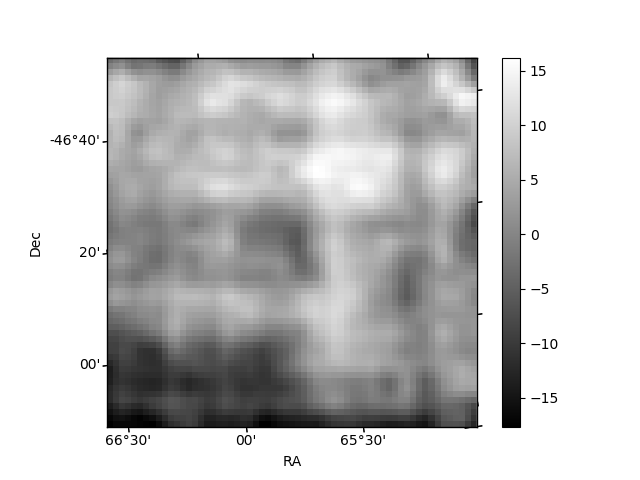
Histogram calculated using DETX and DETY for each event in the final _common_clean file
| Quadrant A | 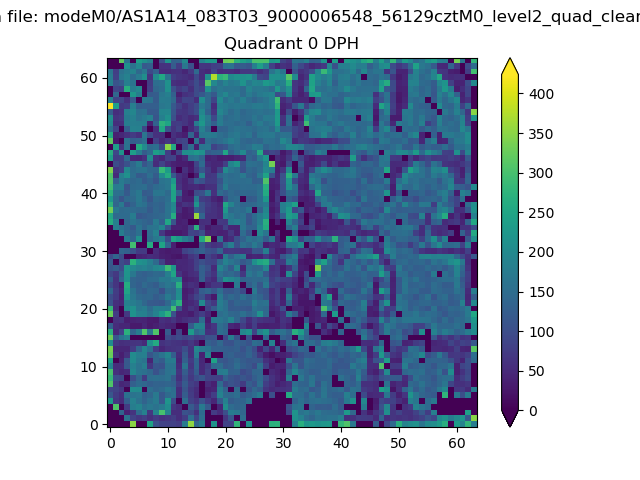 |
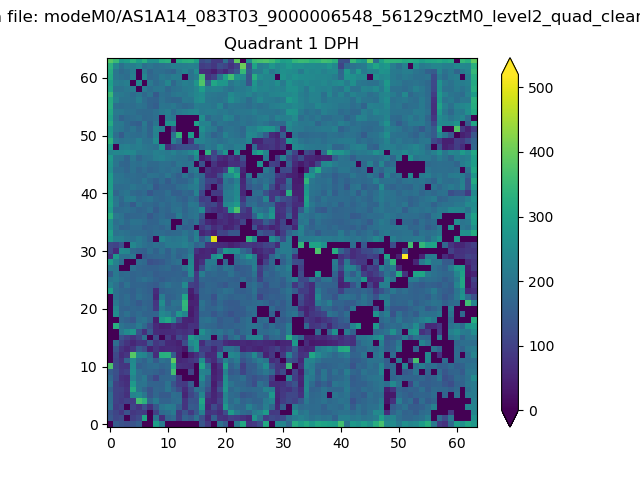 |
Quadrant B |
|---|---|---|---|
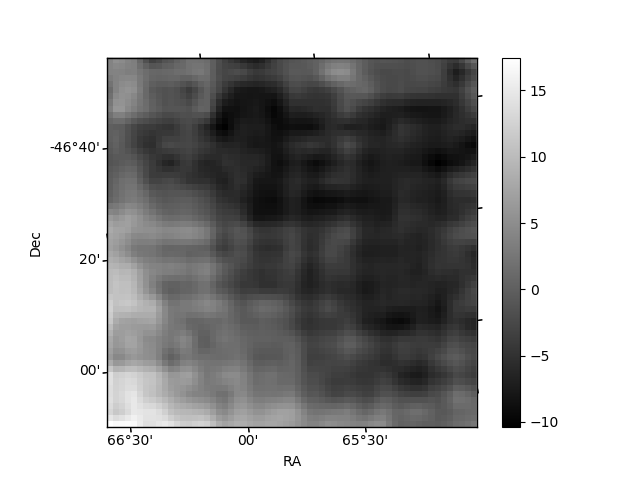
| Quadrant D | 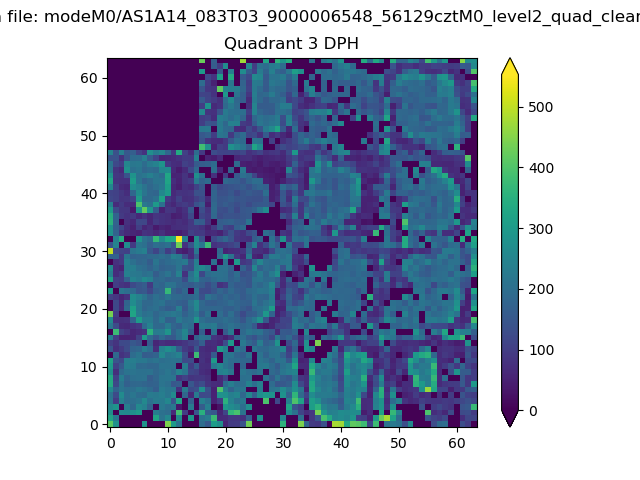 |
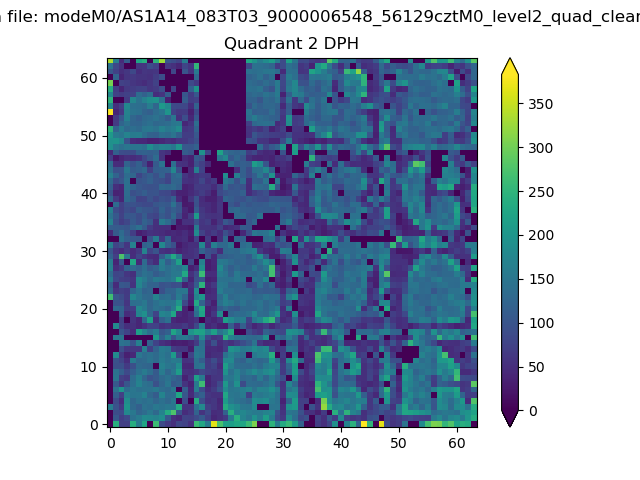 |
Quadrant C |
| Plot type | Count rate plots | Images |
|---|---|---|
| Comparison with Poisson distribution Blue bars denote a histogram of data divided into 1 sec bins. Red curve is a Poisson curve with rate = median count rate of data. |
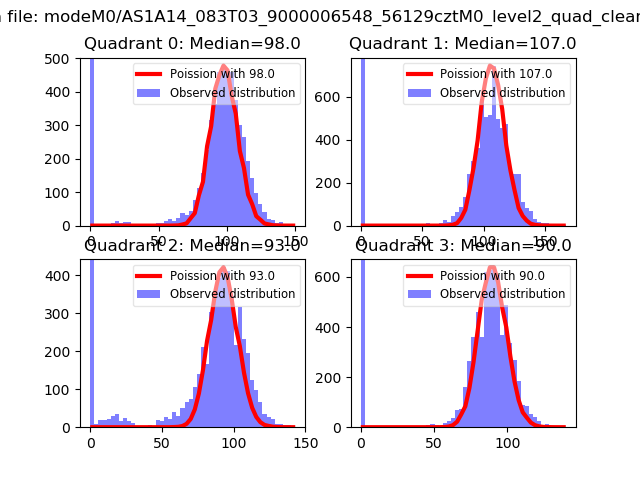 |
 |
| Quadrant-wise count rates Data is divided into 100 sec bins |
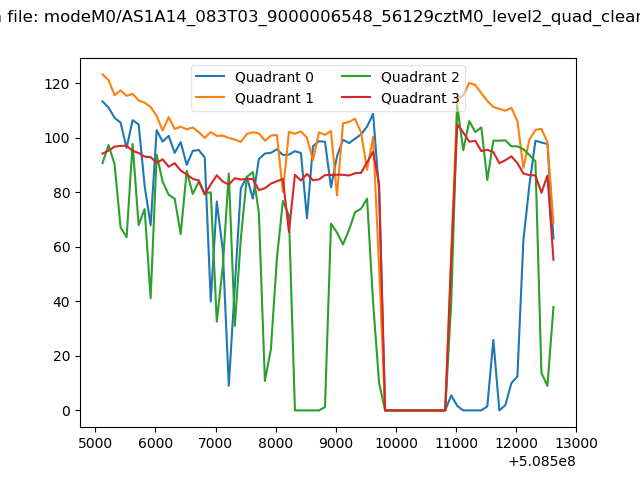 |
|
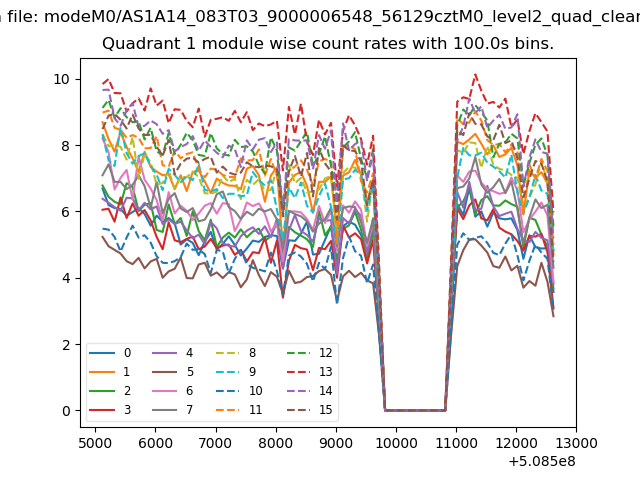
| Module-wise count rates for Quadrant A Data is divided into 100 sec bins |
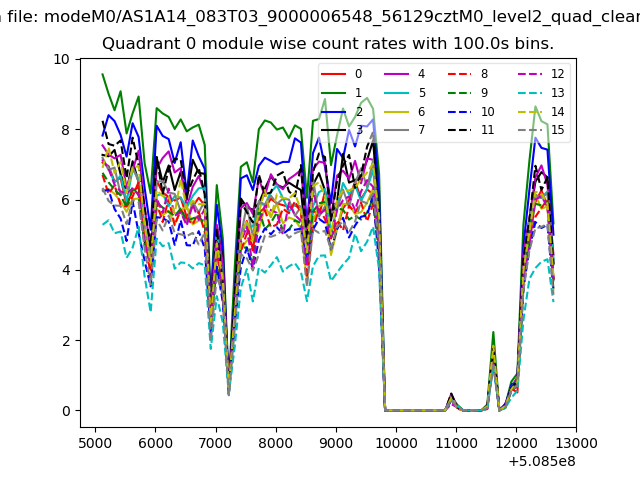 |
 |
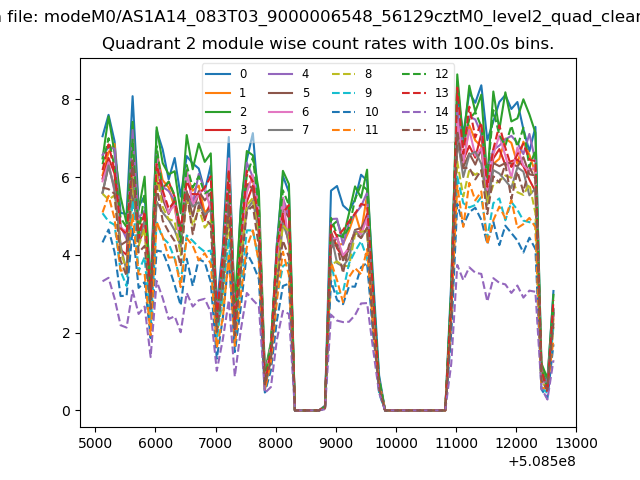
| Module-wise count rates for Quadrant B Data is divided into 100 sec bins |
 |
 |
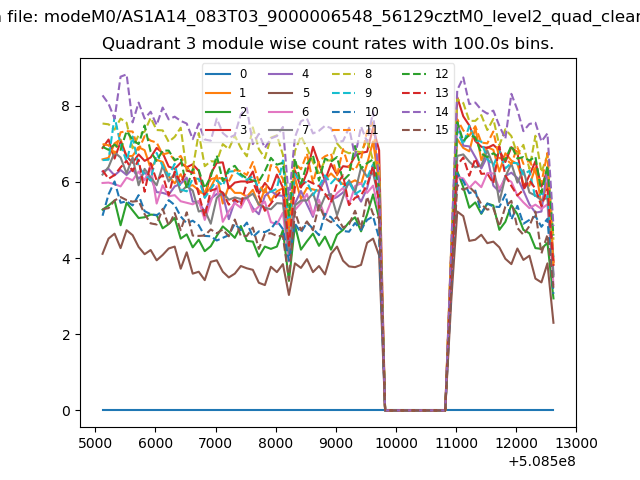
| Module-wise count rates for Quadrant C Data is divided into 100 sec bins |
 |
 |
| Module-wise count rates for Quadrant D Data is divided into 100 sec bins |
 |
 |
| Parameter | Plot |
|---|---|
| CZT HV Monitor | 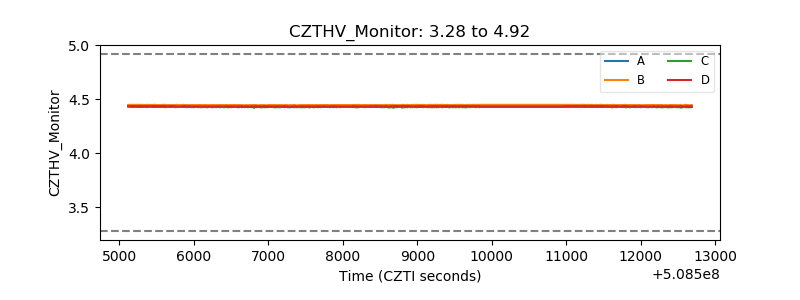 |
| D_VDD | 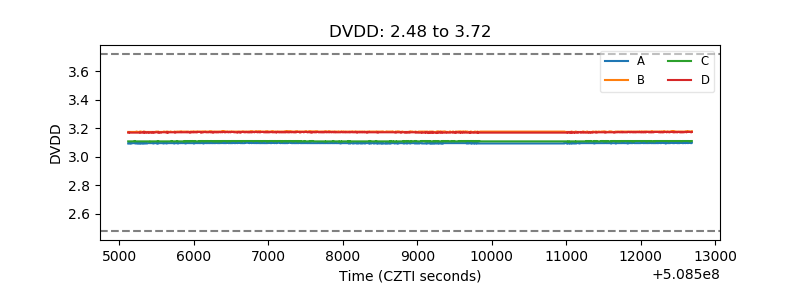 |
| Temperature 1 | 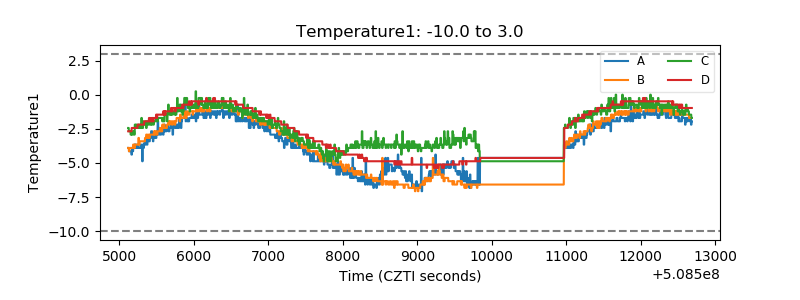 |
| Veto HV Monitor | 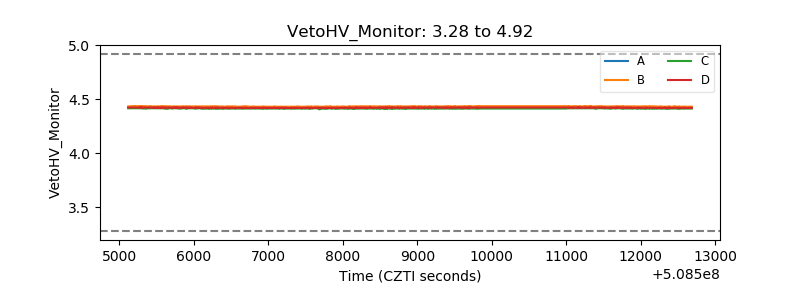 |
| Veto LLD | 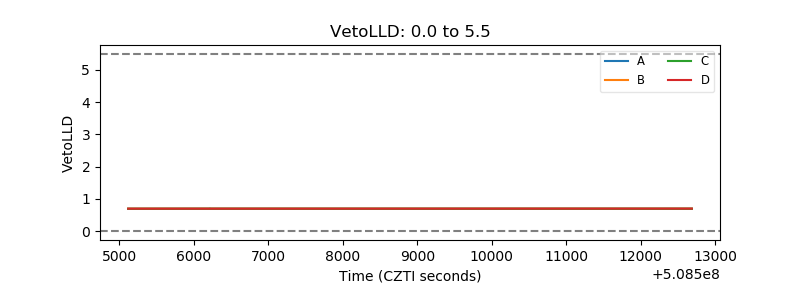 |
| Alpha Counter | 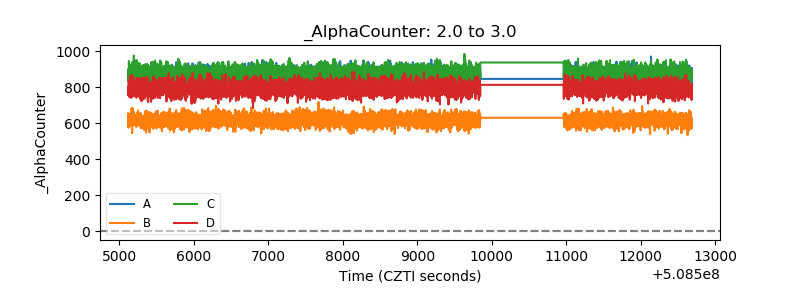 |
| _CPM_Rate | 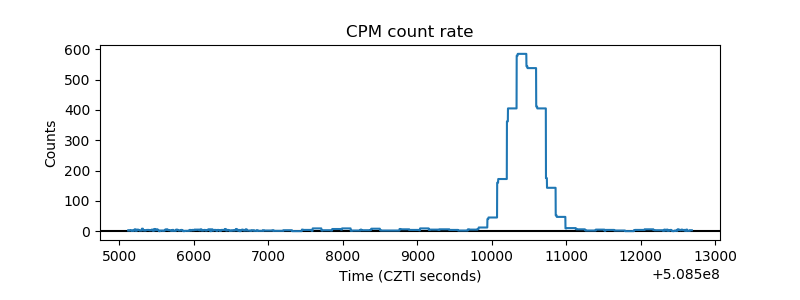 |
| CZT Counter | 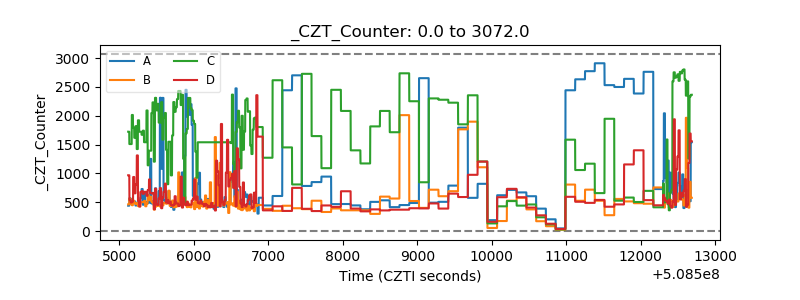 |
| +2.5 Volts monitor |  |
| +5 Volts monitor | 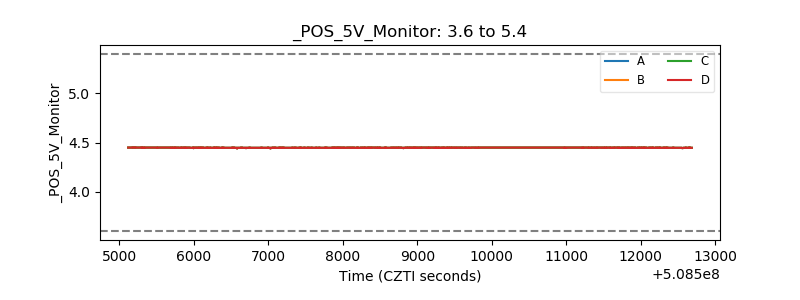 |
| _ROLL_ROT | 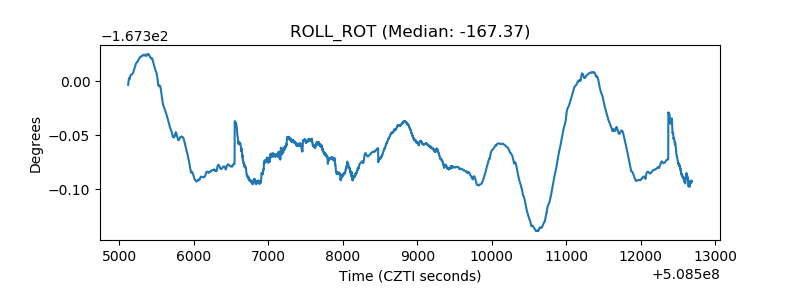 |
| _Roll_DEC | 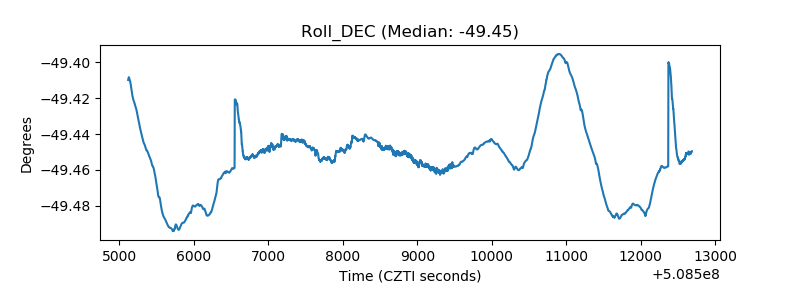 |
| _Roll_RA | 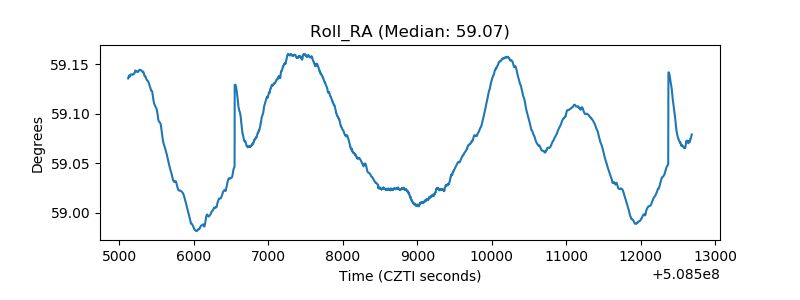 |
| Veto Counter | 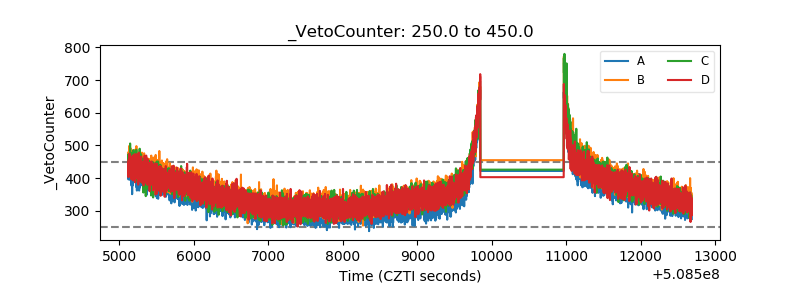 |