| Param | Original file | Final file |
|---|---|---|
| Filename | modeM0/AS1A14_083T03_9000006548_56130cztM0_level2.fits | modeM0/AS1A14_083T03_9000006548_56130cztM0_level2_quad_clean.evt |
| Size (bytes) | 613,560,960 | 74,810,880 |
| Size | 585.1 MB | 71.3 MB |
| Events in quadrant A | 6,946,115 | 441,229 |
| Events in quadrant B | 3,895,615 | 583,520 |
| Events in quadrant C | 7,668,738 | 351,317 |
| Events in quadrant D | 3,756,311 | 488,007 |
| Mode M0 | |||
|---|---|---|---|
| Quadrant | BADHDUFLAG | Total packets | Discarded packets |
| A | 0 | 24640 | 5 |
| B | 0 | 15564 | 1 |
| C | 0 | 26783 | 1 |
| D | 0 | 15295 | 1 |
| Mode SS | |||
|---|---|---|---|
| Quadrant | BADHDUFLAG | Total packets | Discarded packets |
| A | 0 | 116 | 0 |
| B | 0 | 116 | 0 |
| C | 0 | 116 | 0 |
| D | 0 | 116 | 0 |
| Mode M9 | |||
|---|---|---|---|
| Quadrant | BADHDUFLAG | Total packets | Discarded packets |
| A | 0 | 11 | 0 |
| B | 0 | 11 | 0 |
| C | 0 | 11 | 0 |
| D | 0 | 11 | 0 |
| Quadrant | Total seconds | Saturated seconds | Saturation percentage |
|---|---|---|---|
| A | 5736 | 1418 | 24.721060% |
| B | 5736 | 263 | 4.585077% |
| C | 5736 | 1999 | 34.850070% |
| D | 5736 | 202 | 3.521618% |
Noise dominated data is calculated using 1-second bins in cleaned event files. If a bin has >2000 counts, and if more than 50% of those come from <1% of pixels, then it is considered to be noise-dominated and hence unusable.
| Quadrant | # 1 sec bins | Bins with >0 counts | Bins with >2000 counts | High rate bins dominated by noise | Noise dominated (total time) | Noise dominated (detector-on time) | Marked lightcurve |
|---|---|---|---|---|---|---|---|
| A | 6801 | 5737 | 1334 | 1334 | 19.61% | 23.25% | 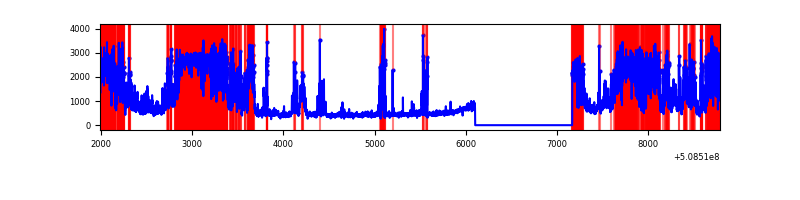 |
| B | 6801 | 5736 | 111 | 111 | 1.63% | 1.94% | 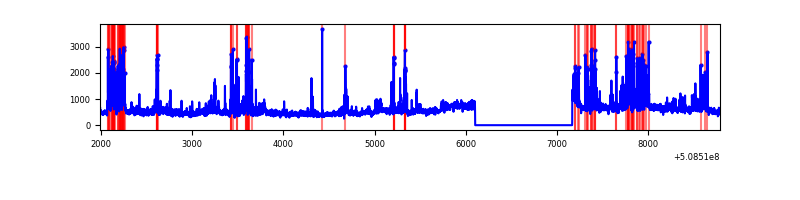 |
| C | 6801 | 5736 | 1781 | 1781 | 26.19% | 31.05% | 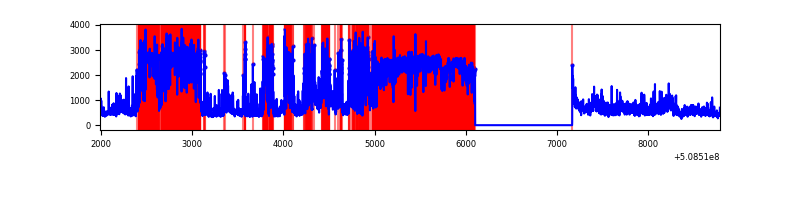 |
| D | 6801 | 5737 | 169 | 169 | 2.48% | 2.95% | 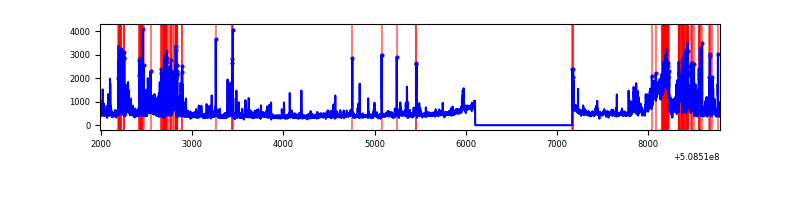 |
Top three noisy pixels from each quadrant. If the there are fewer than three noisy pixels in the level2.evt file, extra rows are filled as -1
| Pixel properties | Quadrant properties | ||||||
|---|---|---|---|---|---|---|---|
| Quadrant | DetID | PixID | Counts | Sigma | Mean | Median | Sigma |
| A | 12 | 115 | 3504851 | 25354.1 | 553 | 541 | 138.2 |
| A | 0 | 8 | 501134 | 3621.85 | 553 | 541 | 138.2 |
| A | 15 | 32 | 269194 | 1943.74 | 553 | 541 | 138.2 |
| B | 5 | 185 | 491488 | 3818.25 | 605 | 584 | 128.6 |
| B | 5 | 236 | 451306 | 3505.71 | 605 | 584 | 128.6 |
| B | 10 | 247 | 218211 | 1692.7 | 605 | 584 | 128.6 |
| C | 15 | 147 | 3020793 | 24597.93 | 441 | 436 | 122.8 |
| C | 15 | 148 | 1597200 | 13004.12 | 441 | 436 | 122.8 |
| C | 9 | 38 | 1081194 | 8801.74 | 441 | 436 | 122.8 |
| D | 2 | 120 | 617434 | 3715.37 | 584 | 557 | 166.0 |
| D | 14 | 52 | 249991 | 1502.31 | 584 | 557 | 166.0 |
| D | 2 | 249 | 203615 | 1222.99 | 584 | 557 | 166.0 |
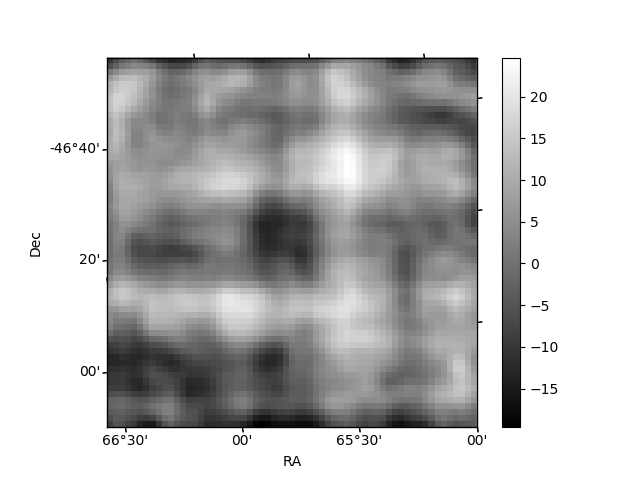
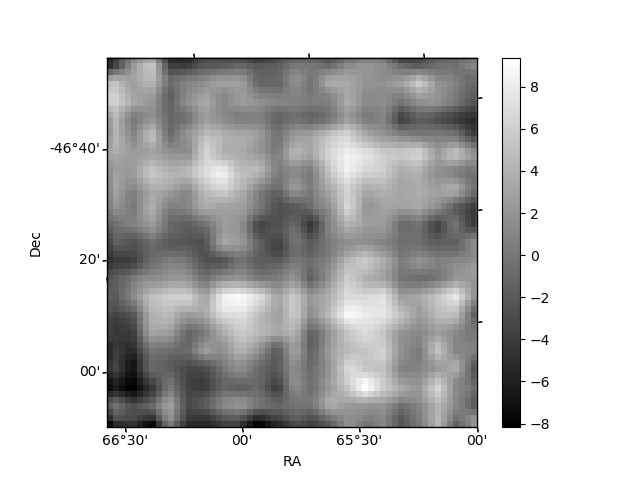
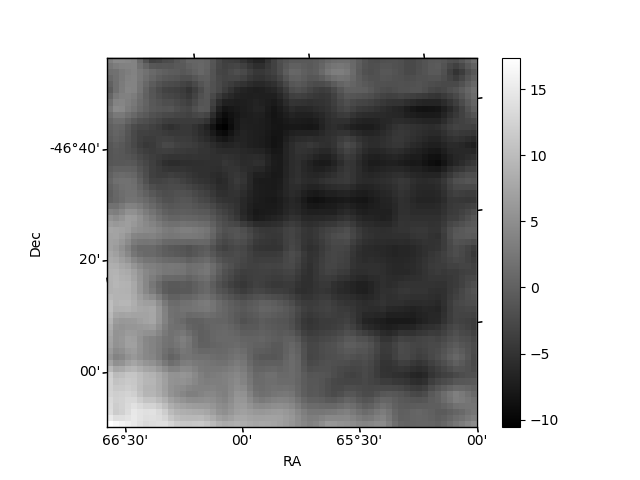
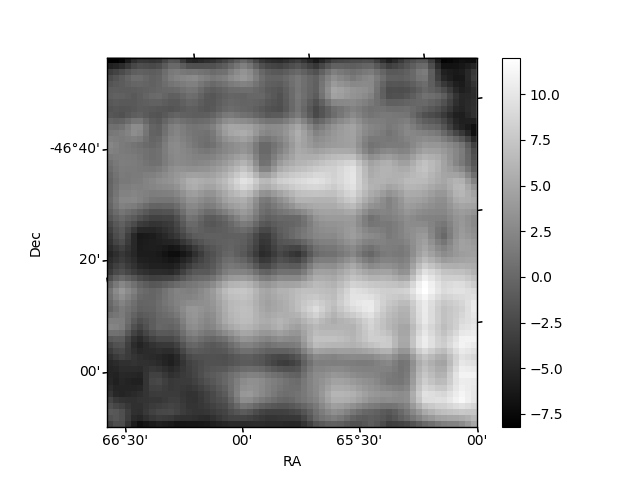
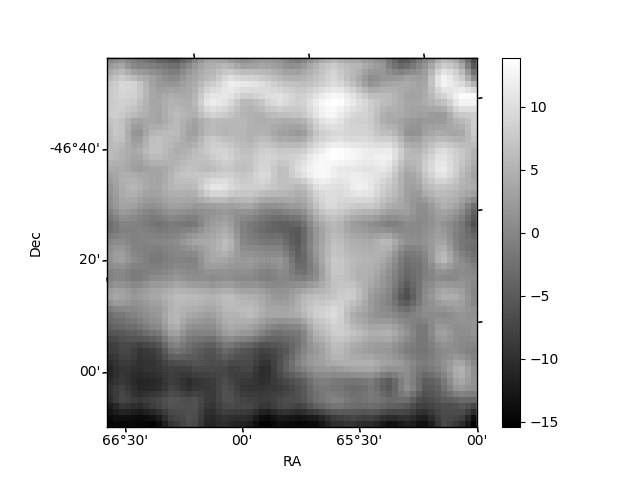
Histogram calculated using DETX and DETY for each event in the final _common_clean file
| Quadrant A | 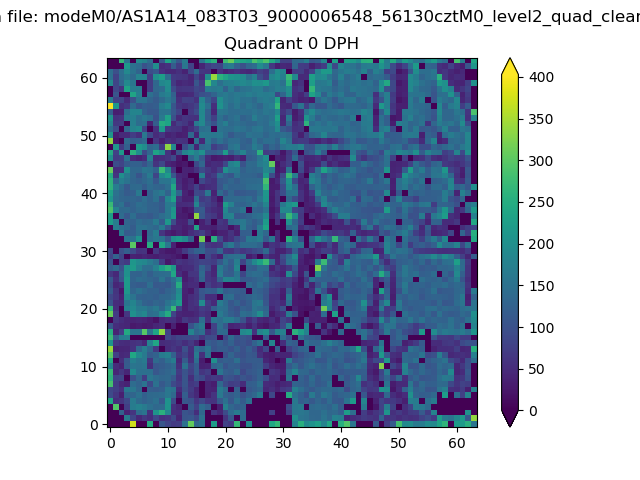 |
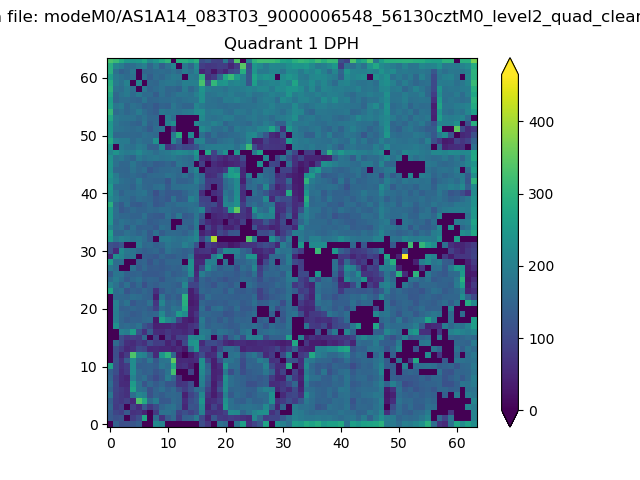 |
Quadrant B |
|---|---|---|---|
| Quadrant D | 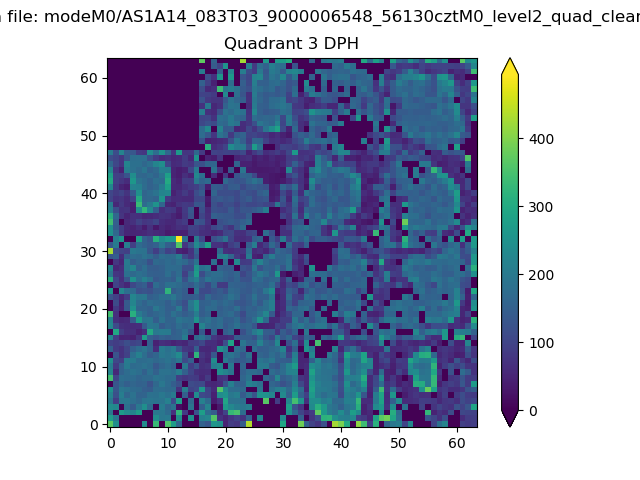 |
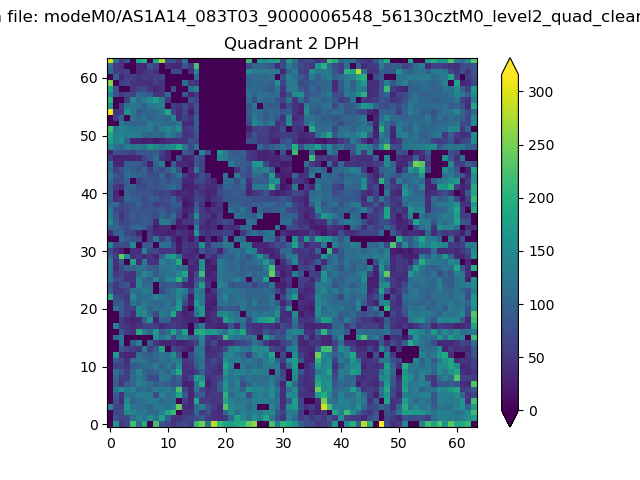 |
Quadrant C |
| Plot type | Count rate plots | Images |
|---|---|---|
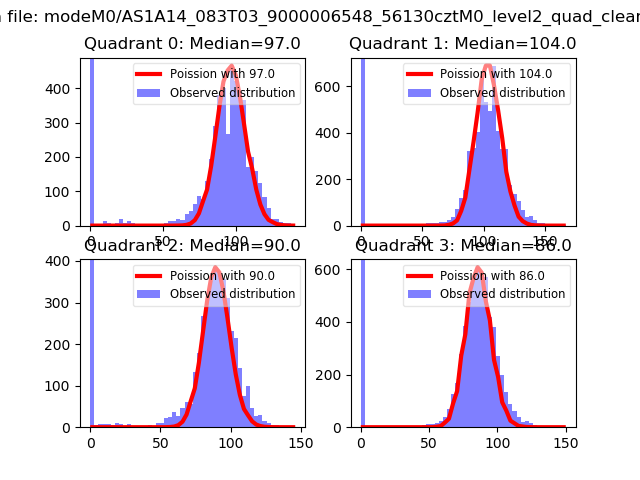
| Comparison with Poisson distribution Blue bars denote a histogram of data divided into 1 sec bins. Red curve is a Poisson curve with rate = median count rate of data. |
 |
 |
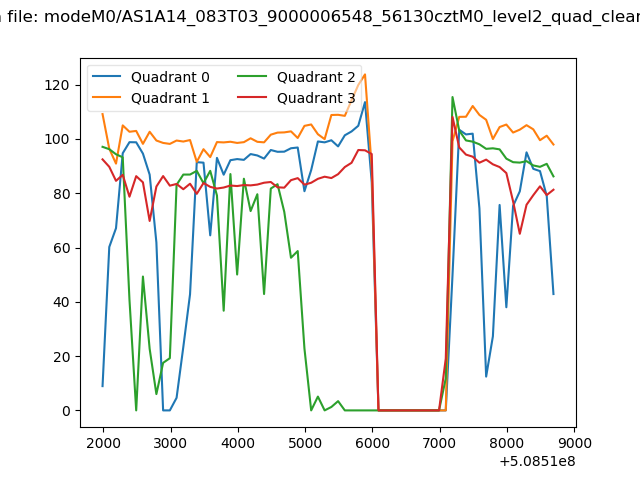
| Quadrant-wise count rates Data is divided into 100 sec bins |
 |
|
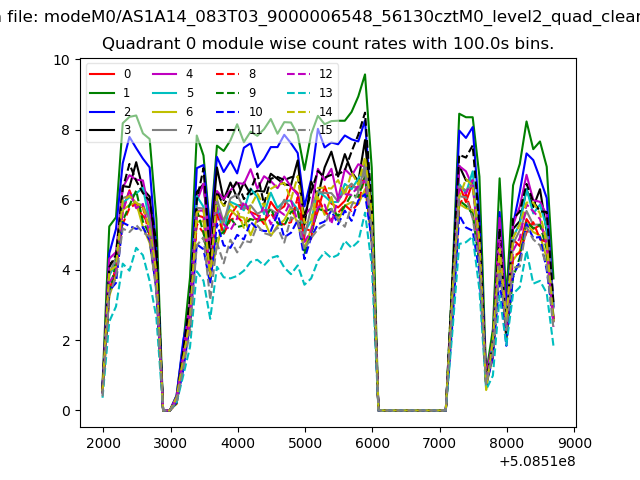
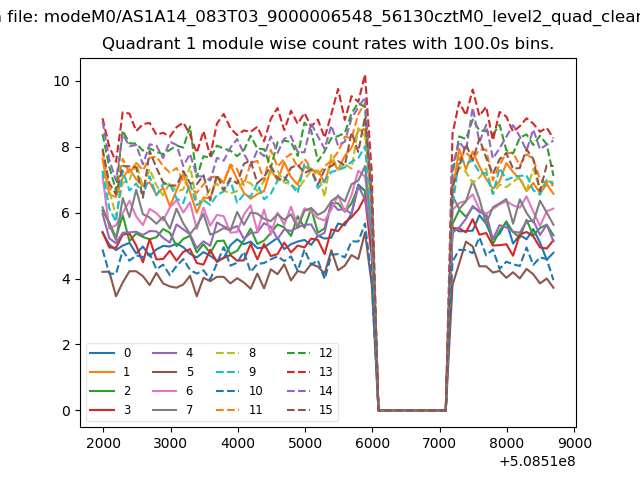
| Module-wise count rates for Quadrant A Data is divided into 100 sec bins |
 |
 |
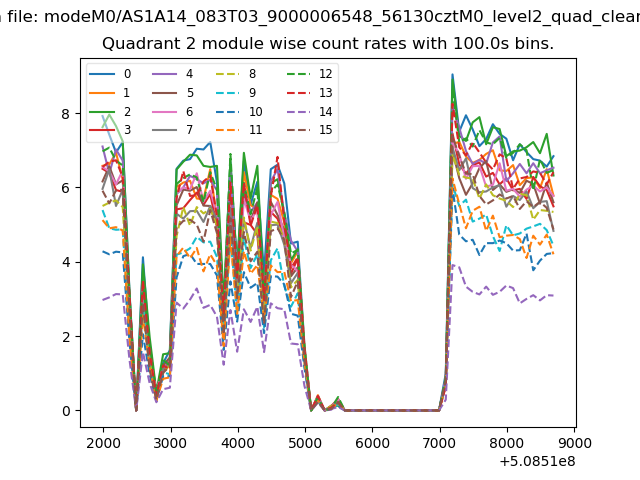
| Module-wise count rates for Quadrant B Data is divided into 100 sec bins |
 |
 |
| Module-wise count rates for Quadrant C Data is divided into 100 sec bins |
 |
 |
| Module-wise count rates for Quadrant D Data is divided into 100 sec bins |
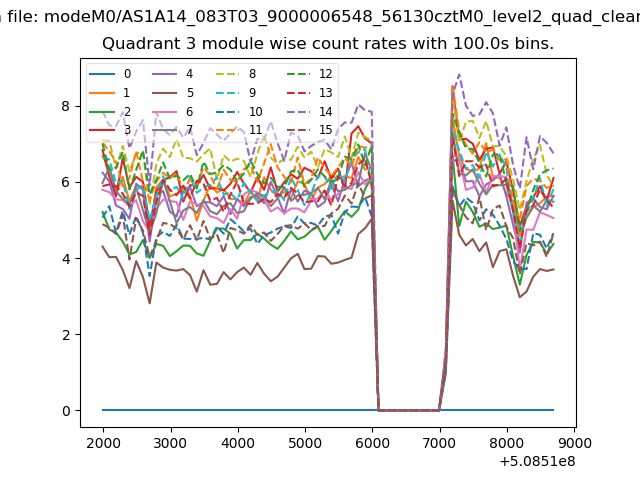 |
 |
| Parameter | Plot |
|---|---|
| CZT HV Monitor | 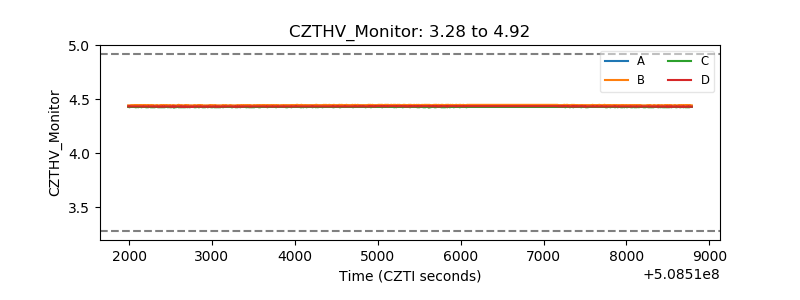 |
| D_VDD | 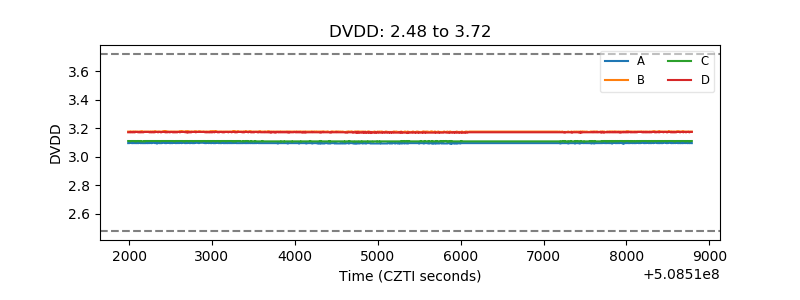 |
| Temperature 1 | 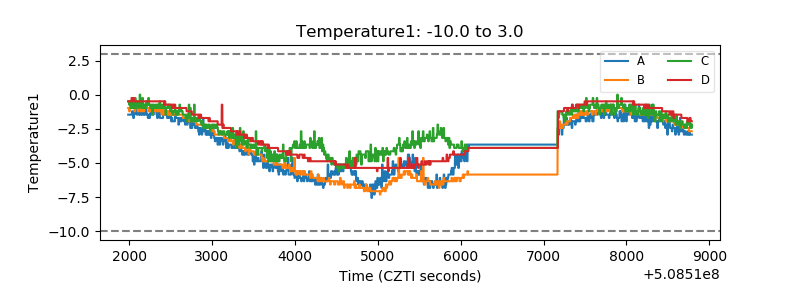 |
| Veto HV Monitor | 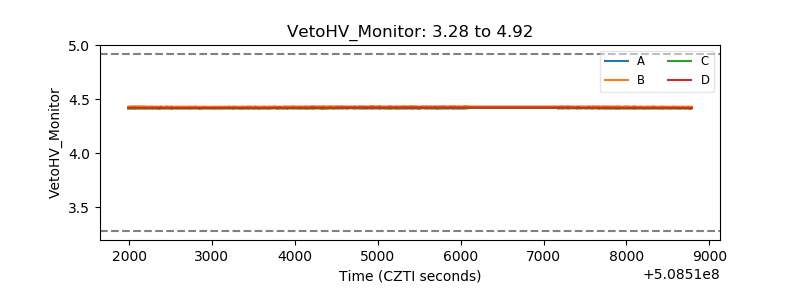 |
| Veto LLD | 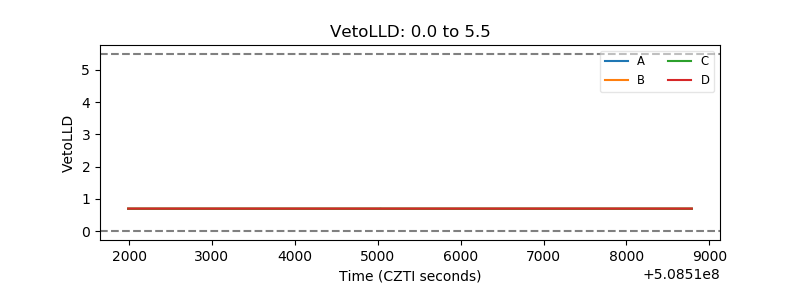 |
| Alpha Counter | 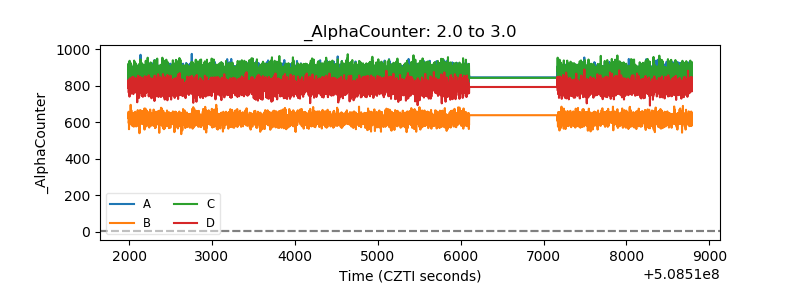 |
| _CPM_Rate | 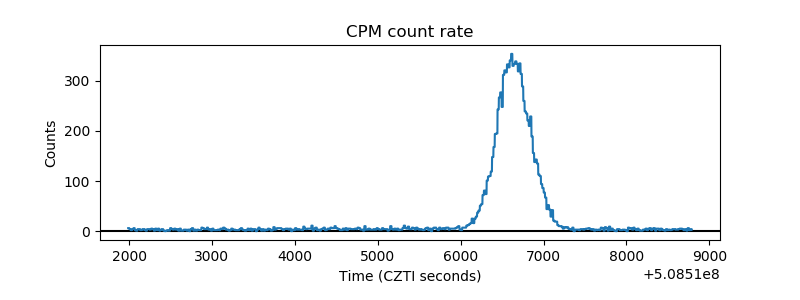 |
| CZT Counter | 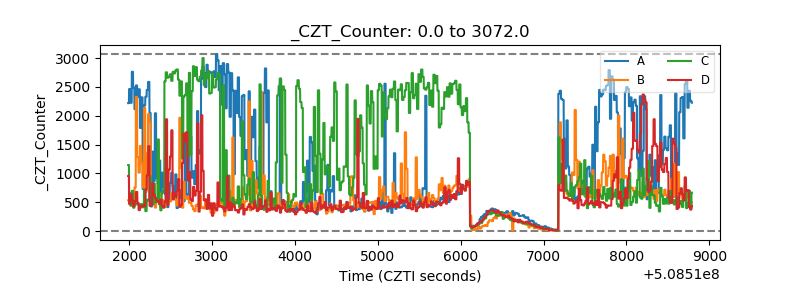 |
| +2.5 Volts monitor | 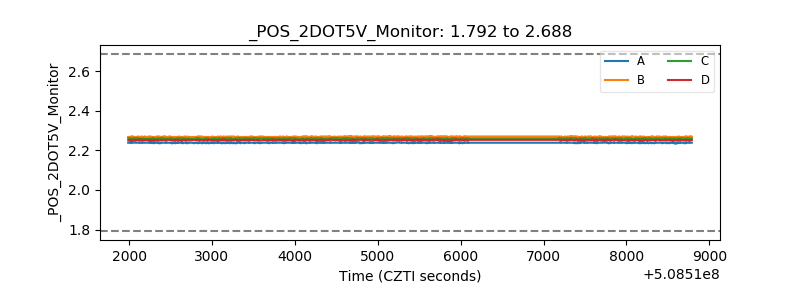 |
| +5 Volts monitor |  |
| _ROLL_ROT | 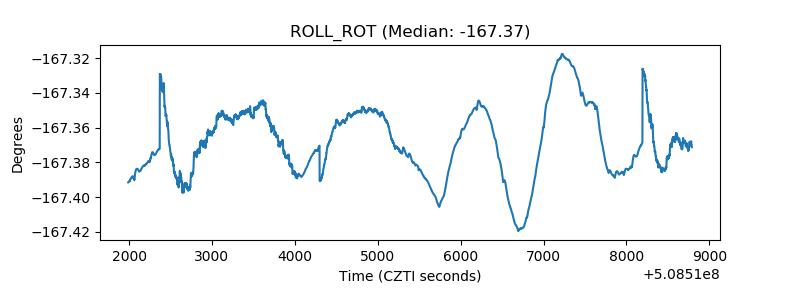 |
| _Roll_DEC | 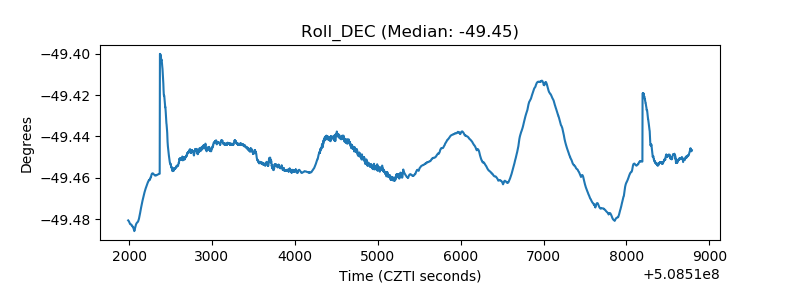 |
| _Roll_RA | 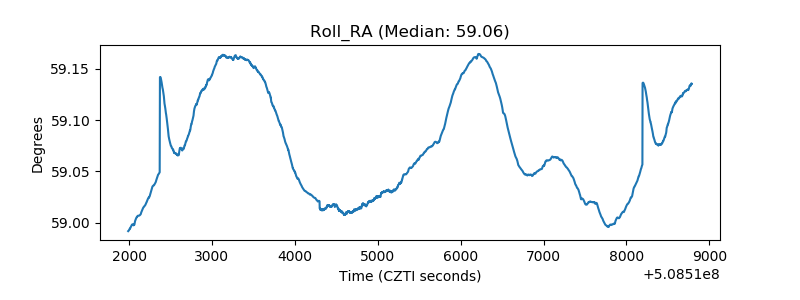 |
| Veto Counter | 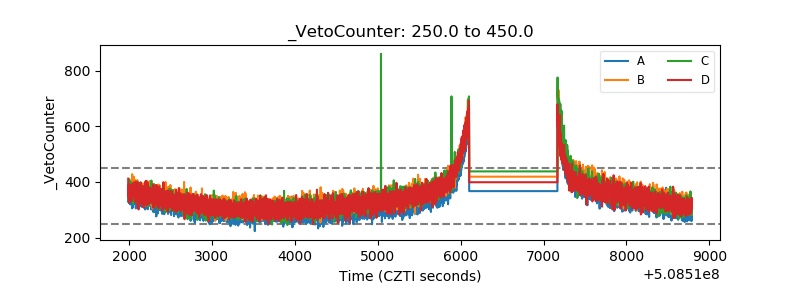 |