| Param | Original file | Final file |
|---|---|---|
| Filename | modeM0/AS1A14_083T03_9000006548_56131cztM0_level2.fits | modeM0/AS1A14_083T03_9000006548_56131cztM0_level2_quad_clean.evt |
| Size (bytes) | 680,742,720 | 87,785,280 |
| Size | 649.2 MB | 83.7 MB |
| Events in quadrant A | 7,596,638 | 533,139 |
| Events in quadrant B | 4,790,386 | 647,692 |
| Events in quadrant C | 8,118,957 | 463,840 |
| Events in quadrant D | 4,181,322 | 552,664 |
| Mode M0 | |||
|---|---|---|---|
| Quadrant | BADHDUFLAG | Total packets | Discarded packets |
| A | 0 | 27125 | 1 |
| B | 0 | 18907 | 1 |
| C | 0 | 28727 | 1 |
| D | 0 | 17363 | 1 |
| Mode SS | |||
|---|---|---|---|
| Quadrant | BADHDUFLAG | Total packets | Discarded packets |
| A | 0 | 134 | 0 |
| B | 0 | 134 | 0 |
| C | 0 | 134 | 0 |
| D | 0 | 134 | 0 |
| Mode M9 | |||
|---|---|---|---|
| Quadrant | BADHDUFLAG | Total packets | Discarded packets |
| A | 0 | 9 | 0 |
| B | 0 | 9 | 0 |
| C | 0 | 9 | 0 |
| D | 0 | 9 | 0 |
| Quadrant | Total seconds | Saturated seconds | Saturation percentage |
|---|---|---|---|
| A | 6606 | 1270 | 19.224947% |
| B | 6605 | 416 | 6.298259% |
| C | 6606 | 1638 | 24.795640% |
| D | 6606 | 190 | 2.876173% |
Noise dominated data is calculated using 1-second bins in cleaned event files. If a bin has >2000 counts, and if more than 50% of those come from <1% of pixels, then it is considered to be noise-dominated and hence unusable.
| Quadrant | # 1 sec bins | Bins with >0 counts | Bins with >2000 counts | High rate bins dominated by noise | Noise dominated (total time) | Noise dominated (detector-on time) | Marked lightcurve |
|---|---|---|---|---|---|---|---|
| A | 7531 | 6607 | 1241 | 1241 | 16.48% | 18.78% | 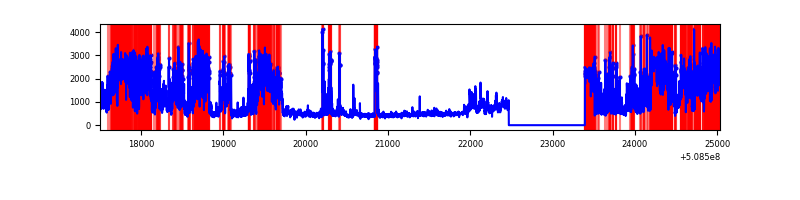 |
| B | 7530 | 6605 | 276 | 276 | 3.67% | 4.18% | 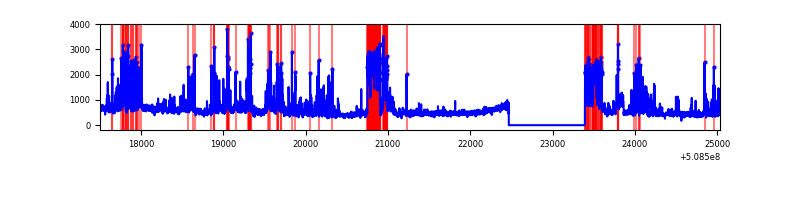 |
| C | 7531 | 6606 | 1421 | 1421 | 18.87% | 21.51% | 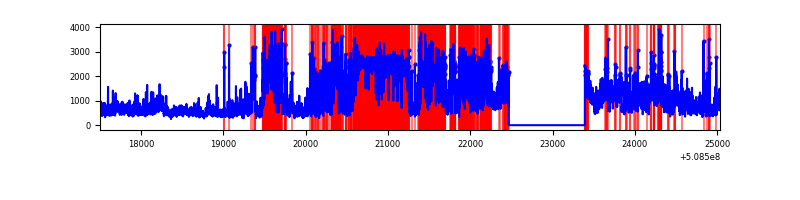 |
| D | 7531 | 6607 | 186 | 186 | 2.47% | 2.82% | 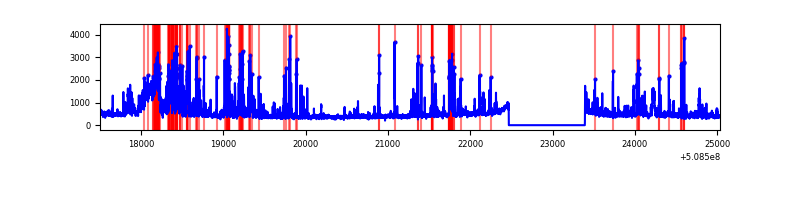 |
Top three noisy pixels from each quadrant. If the there are fewer than three noisy pixels in the level2.evt file, extra rows are filled as -1
| Pixel properties | Quadrant properties | ||||||
|---|---|---|---|---|---|---|---|
| Quadrant | DetID | PixID | Counts | Sigma | Mean | Median | Sigma |
| A | 12 | 115 | 2942212 | 17917.59 | 649 | 633 | 164.2 |
| A | 3 | 14 | 1076111 | 6550.89 | 649 | 633 | 164.2 |
| A | 0 | 8 | 367122 | 2232.34 | 649 | 633 | 164.2 |
| B | 5 | 172 | 881794 | 6098.84 | 681 | 658 | 144.5 |
| B | 5 | 236 | 403403 | 2787.63 | 681 | 658 | 144.5 |
| B | 10 | 247 | 303241 | 2094.35 | 681 | 658 | 144.5 |
| C | 15 | 147 | 2321169 | 14421.86 | 581 | 576 | 160.9 |
| C | 9 | 38 | 1822484 | 11322.67 | 581 | 576 | 160.9 |
| C | 15 | 148 | 1204665 | 7483.09 | 581 | 576 | 160.9 |
| D | 2 | 120 | 668388 | 3567.65 | 663 | 632 | 187.2 |
| D | 2 | 249 | 282731 | 1507.18 | 663 | 632 | 187.2 |
| D | 2 | 31 | 182817 | 973.37 | 663 | 632 | 187.2 |
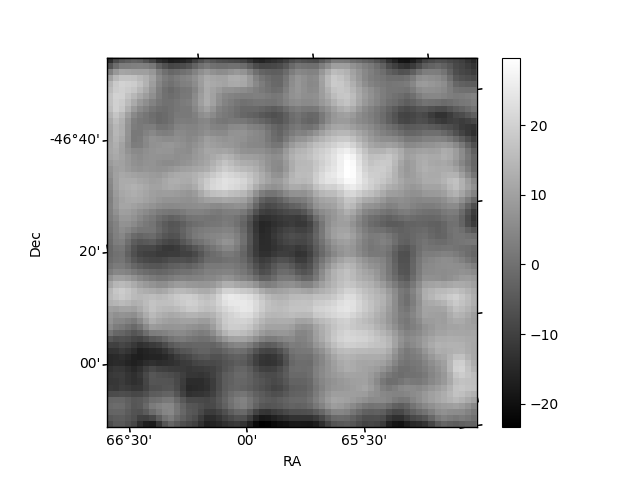
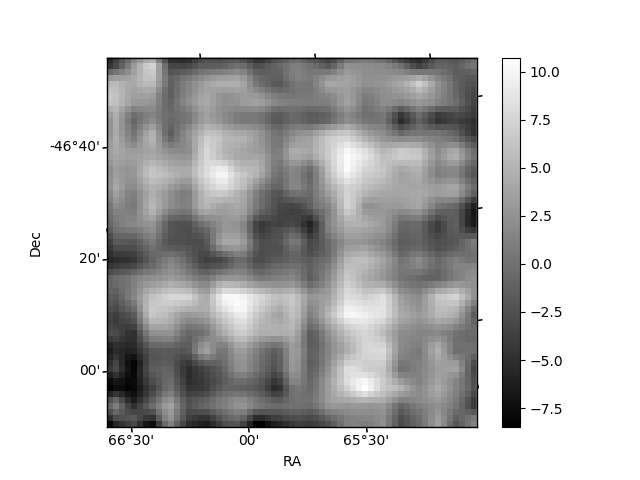
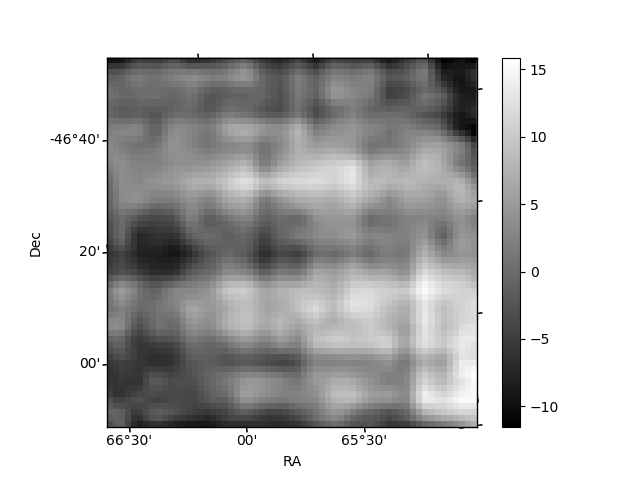
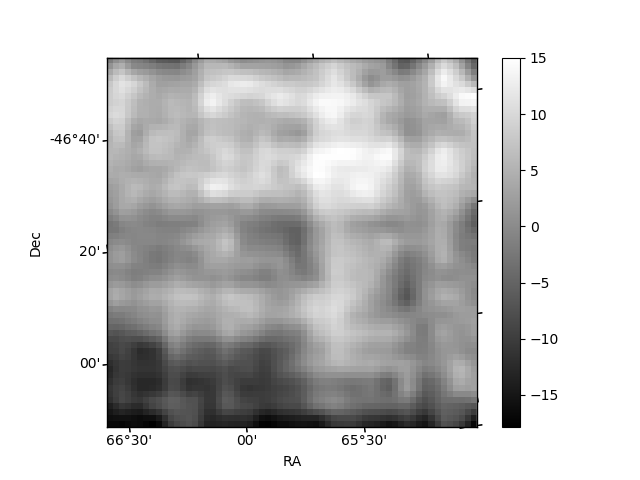
Histogram calculated using DETX and DETY for each event in the final _common_clean file
| Quadrant A | 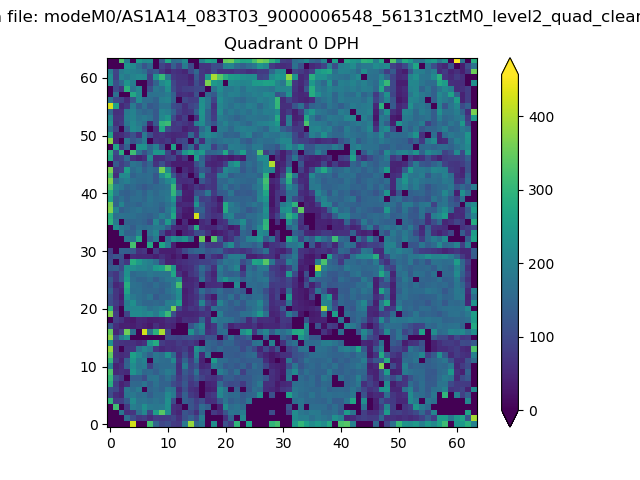 |
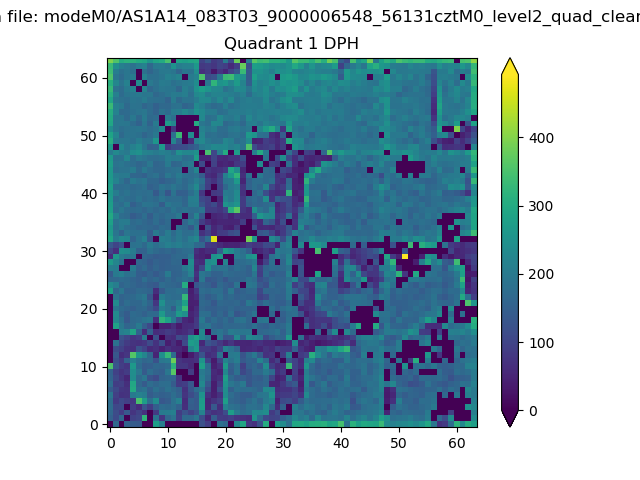 |
Quadrant B |
|---|---|---|---|
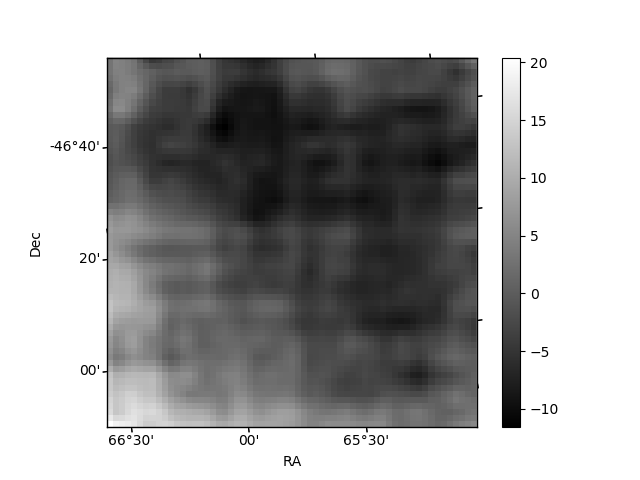
| Quadrant D | 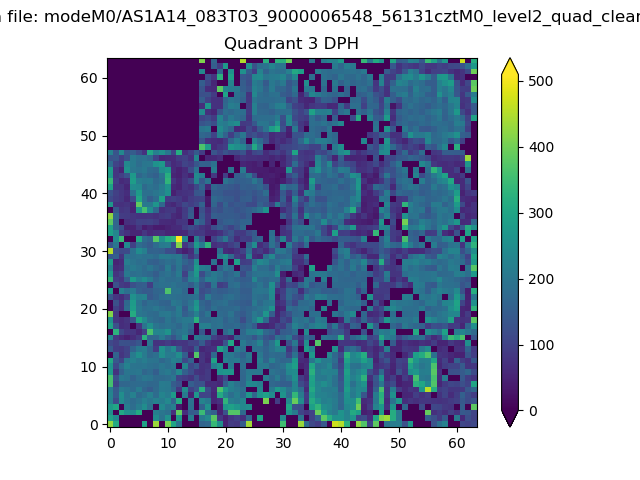 |
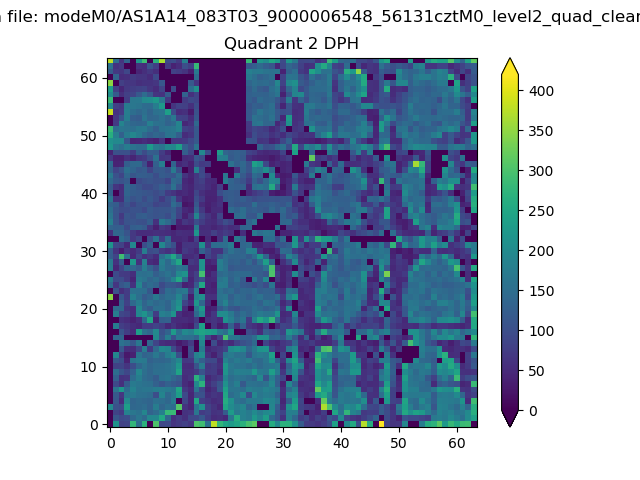 |
Quadrant C |
| Plot type | Count rate plots | Images |
|---|---|---|
| Comparison with Poisson distribution Blue bars denote a histogram of data divided into 1 sec bins. Red curve is a Poisson curve with rate = median count rate of data. |
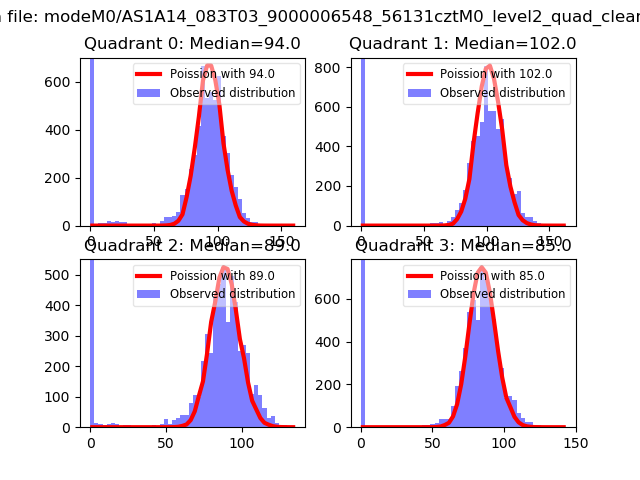 |
 |
| Quadrant-wise count rates Data is divided into 100 sec bins |
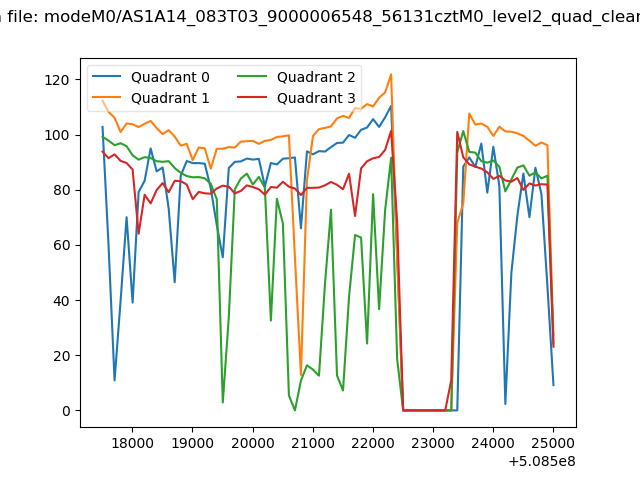 |
|
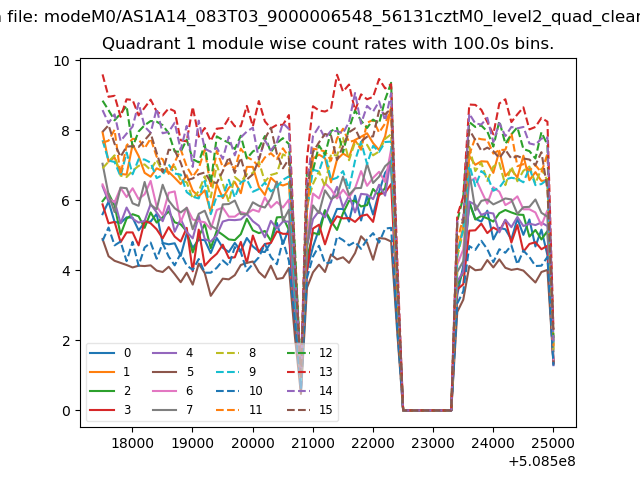
| Module-wise count rates for Quadrant A Data is divided into 100 sec bins |
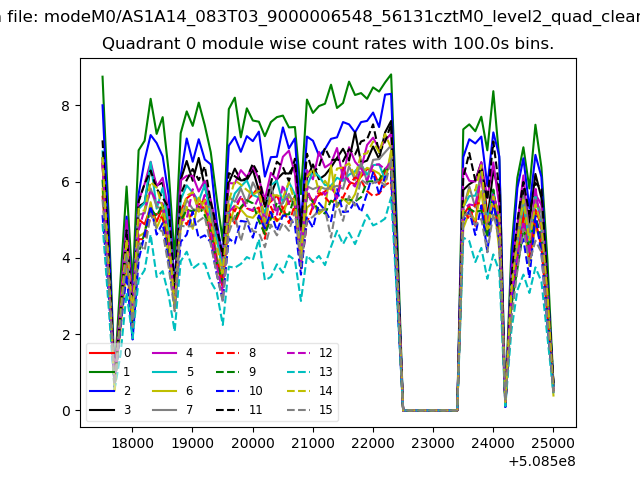 |
 |
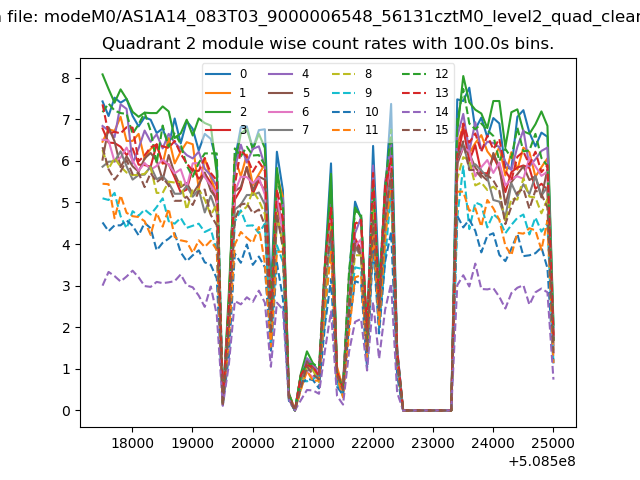
| Module-wise count rates for Quadrant B Data is divided into 100 sec bins |
 |
 |
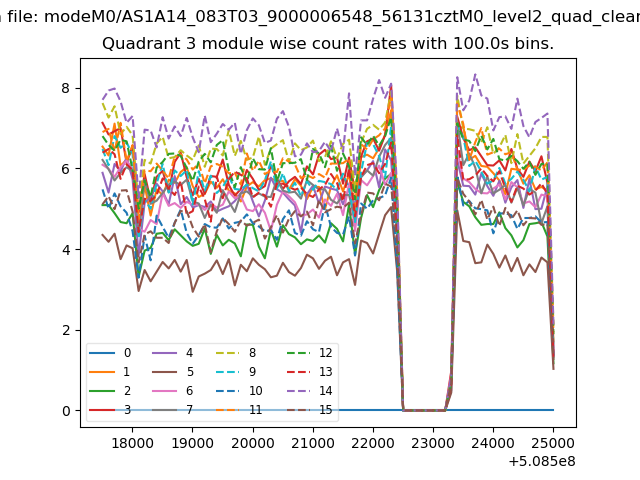
| Module-wise count rates for Quadrant C Data is divided into 100 sec bins |
 |
 |
| Module-wise count rates for Quadrant D Data is divided into 100 sec bins |
 |
 |
| Parameter | Plot |
|---|---|
| CZT HV Monitor | 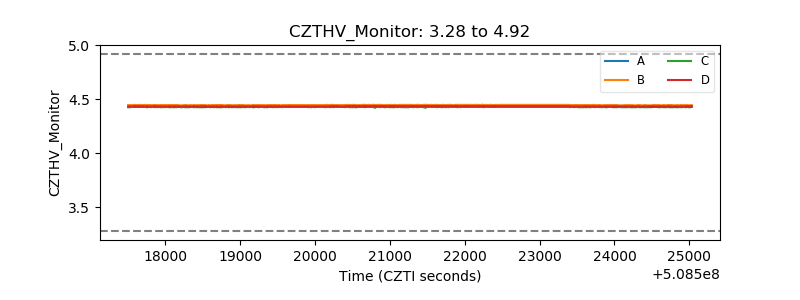 |
| D_VDD | 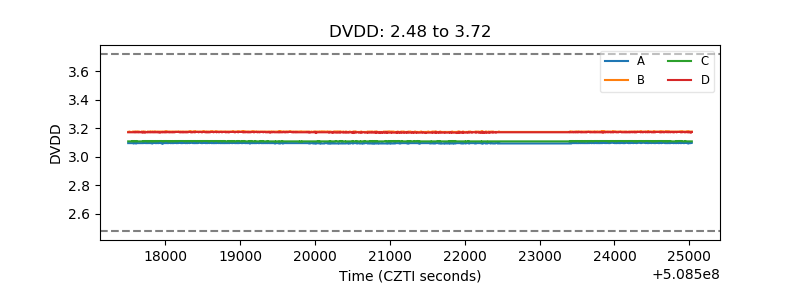 |
| Temperature 1 | 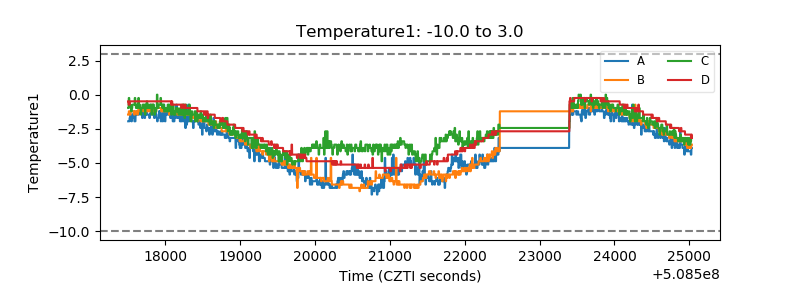 |
| Veto HV Monitor | 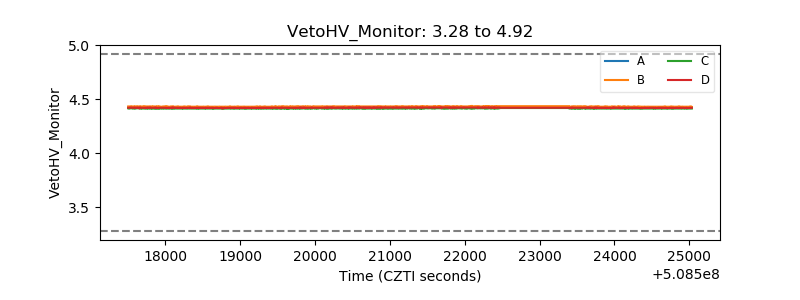 |
| Veto LLD | 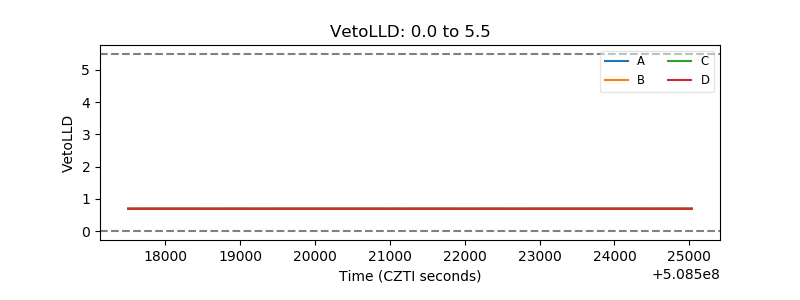 |
| Alpha Counter | 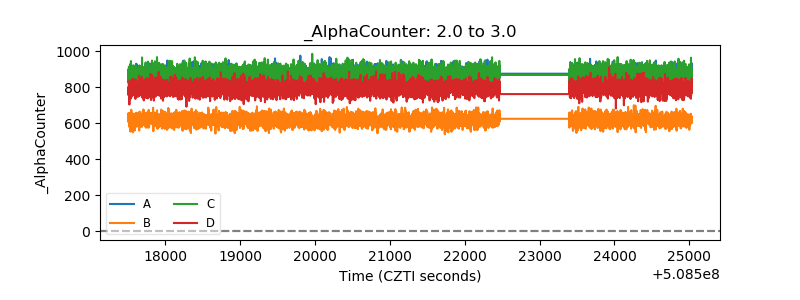 |
| _CPM_Rate | 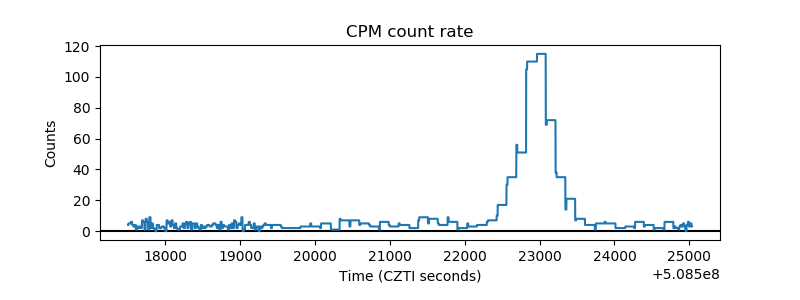 |
| CZT Counter | 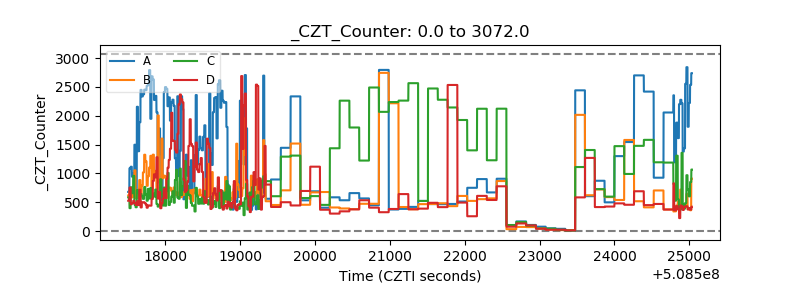 |
| +2.5 Volts monitor |  |
| +5 Volts monitor | 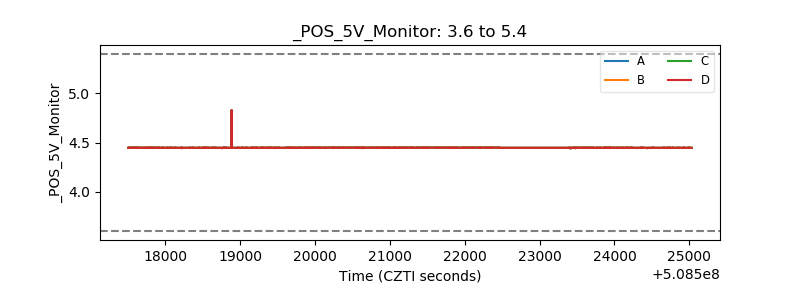 |
| _ROLL_ROT | 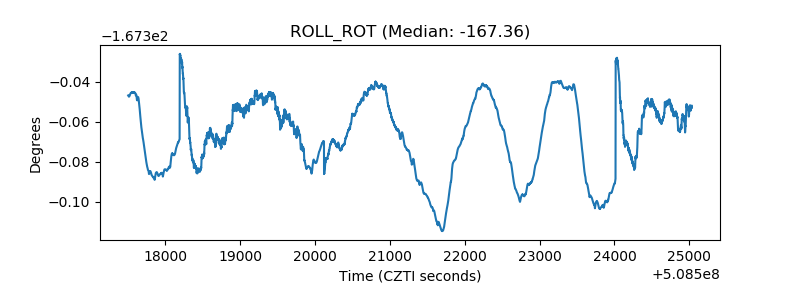 |
| _Roll_DEC | 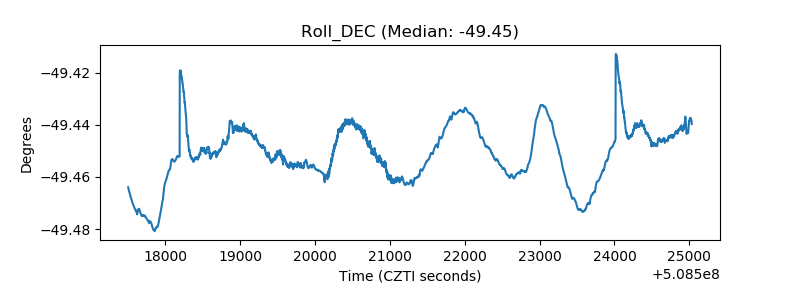 |
| _Roll_RA | 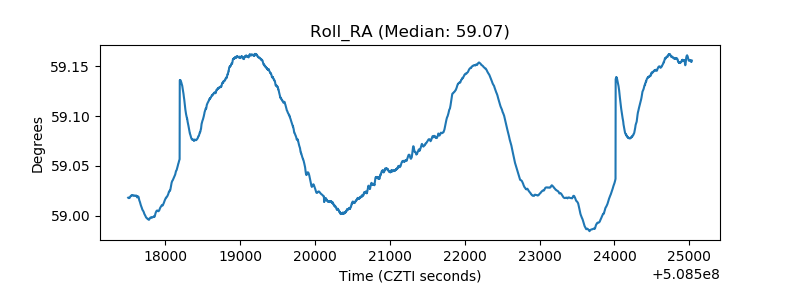 |
| Veto Counter | 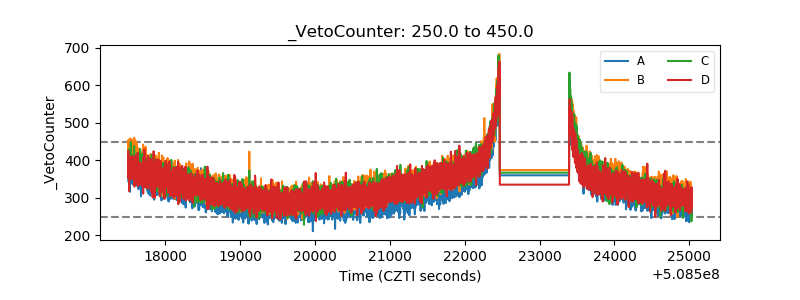 |