| Param | Original file | Final file |
|---|---|---|
| Filename | modeM0/AS1A14_083T03_9000006548_56132cztM0_level2.fits | modeM0/AS1A14_083T03_9000006548_56132cztM0_level2_quad_clean.evt |
| Size (bytes) | 742,227,840 | 83,718,720 |
| Size | 707.8 MB | 79.8 MB |
| Events in quadrant A | 8,882,276 | 520,794 |
| Events in quadrant B | 4,451,182 | 594,004 |
| Events in quadrant C | 9,397,006 | 419,598 |
| Events in quadrant D | 4,202,973 | 512,490 |
| Mode M0 | |||
|---|---|---|---|
| Quadrant | BADHDUFLAG | Total packets | Discarded packets |
| A | 0 | 31268 | 2 |
| B | 0 | 18106 | 2 |
| C | 0 | 32801 | 2 |
| D | 0 | 17683 | 2 |
| Mode SS | |||
|---|---|---|---|
| Quadrant | BADHDUFLAG | Total packets | Discarded packets |
| A | 0 | 142 | 0 |
| B | 0 | 142 | 0 |
| C | 0 | 142 | 0 |
| D | 0 | 142 | 0 |
| Mode M9 | |||
|---|---|---|---|
| Quadrant | BADHDUFLAG | Total packets | Discarded packets |
| A | 0 | 4 | 0 |
| B | 0 | 4 | 0 |
| C | 0 | 4 | 0 |
| D | 0 | 4 | 0 |
| Quadrant | Total seconds | Saturated seconds | Saturation percentage |
|---|---|---|---|
| A | 6997 | 1289 | 18.422181% |
| B | 6998 | 410 | 5.858817% |
| C | 6997 | 1986 | 28.383593% |
| D | 6997 | 143 | 2.043733% |
Noise dominated data is calculated using 1-second bins in cleaned event files. If a bin has >2000 counts, and if more than 50% of those come from <1% of pixels, then it is considered to be noise-dominated and hence unusable.
| Quadrant | # 1 sec bins | Bins with >0 counts | Bins with >2000 counts | High rate bins dominated by noise | Noise dominated (total time) | Noise dominated (detector-on time) | Marked lightcurve |
|---|---|---|---|---|---|---|---|
| A | 7719 | 7266 | 1212 | 1212 | 15.70% | 16.68% | 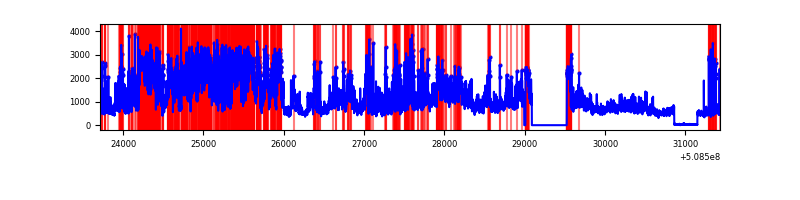 |
| B | 7720 | 7267 | 226 | 226 | 2.93% | 3.11% | 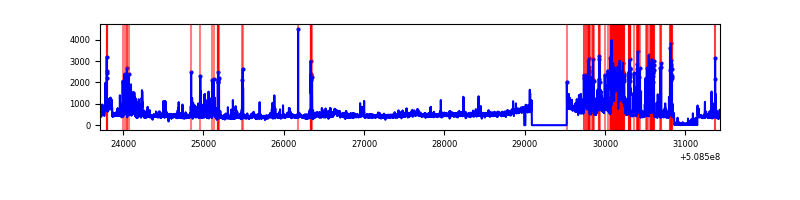 |
| C | 7719 | 7267 | 1681 | 1681 | 21.78% | 23.13% | 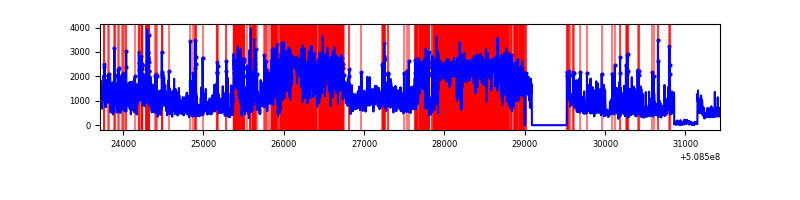 |
| D | 7719 | 7267 | 128 | 128 | 1.66% | 1.76% | 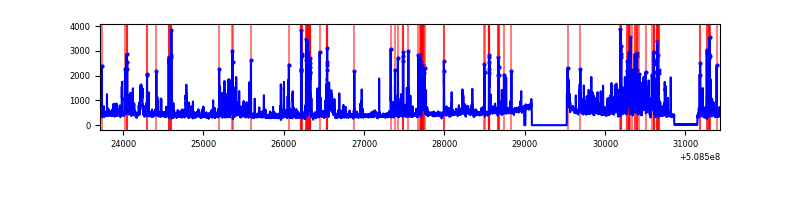 |
Top three noisy pixels from each quadrant. If the there are fewer than three noisy pixels in the level2.evt file, extra rows are filled as -1
| Pixel properties | Quadrant properties | ||||||
|---|---|---|---|---|---|---|---|
| Quadrant | DetID | PixID | Counts | Sigma | Mean | Median | Sigma |
| A | 3 | 14 | 3019399 | 17351.12 | 696 | 678 | 174.0 |
| A | 12 | 115 | 2712970 | 15589.82 | 696 | 678 | 174.0 |
| A | 8 | 237 | 127521 | 729.07 | 696 | 678 | 174.0 |
| B | 5 | 172 | 810982 | 5226.14 | 727 | 702 | 155.0 |
| B | 10 | 247 | 179397 | 1152.55 | 727 | 702 | 155.0 |
| B | 8 | 128 | 97727 | 625.79 | 727 | 702 | 155.0 |
| C | 9 | 38 | 2703506 | 16138.95 | 608 | 603 | 167.5 |
| C | 15 | 147 | 2303016 | 13747.64 | 608 | 603 | 167.5 |
| C | 15 | 148 | 1207156 | 7204.29 | 608 | 603 | 167.5 |
| D | 8 | 129 | 331447 | 1649.61 | 706 | 674 | 200.5 |
| D | 8 | 240 | 331071 | 1647.74 | 706 | 674 | 200.5 |
| D | 2 | 249 | 216392 | 1075.82 | 706 | 674 | 200.5 |
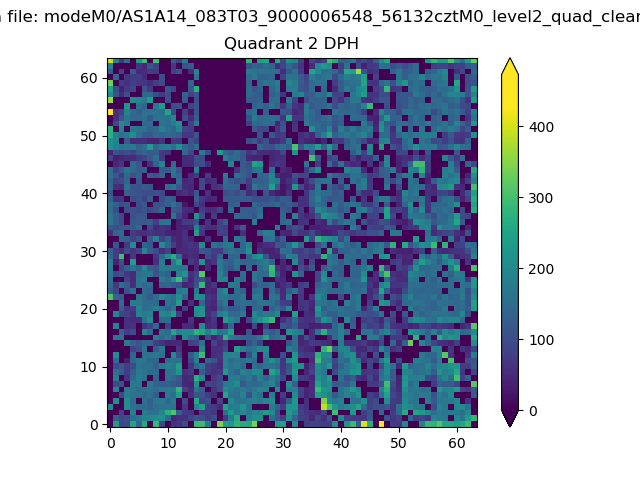
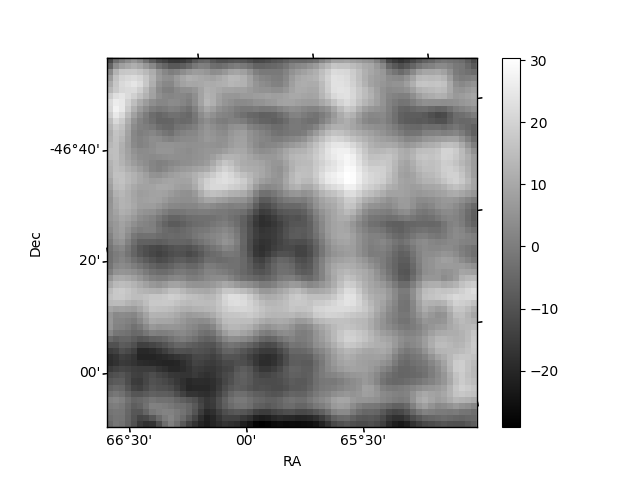
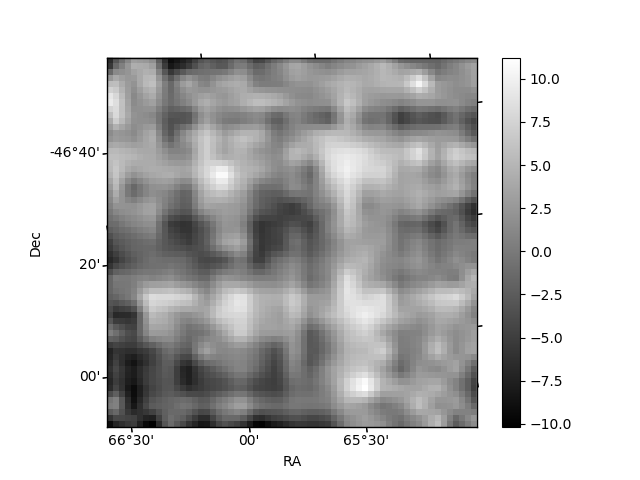
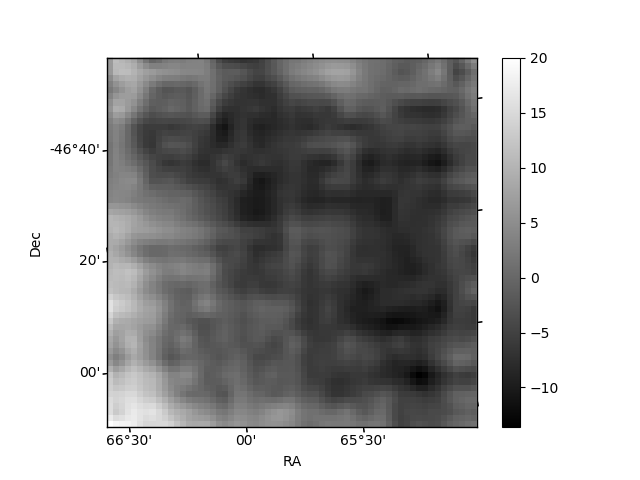
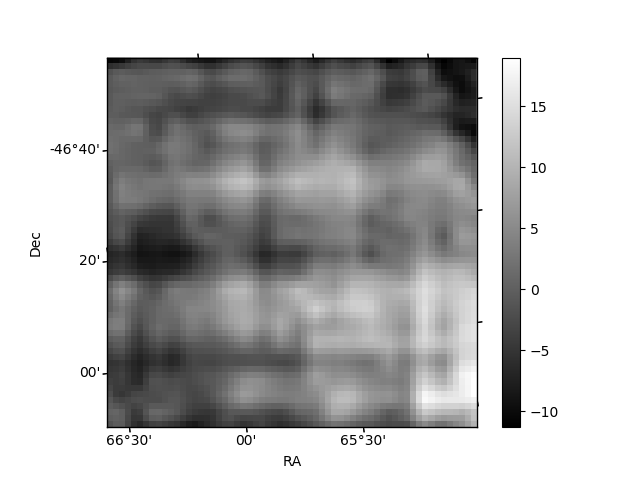
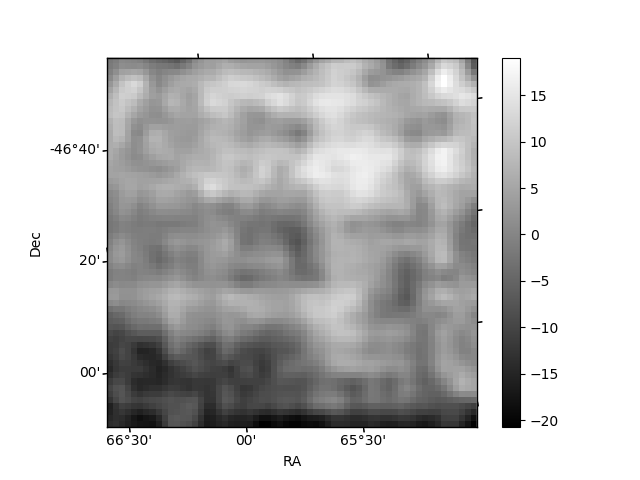
Histogram calculated using DETX and DETY for each event in the final _common_clean file
| Quadrant A | 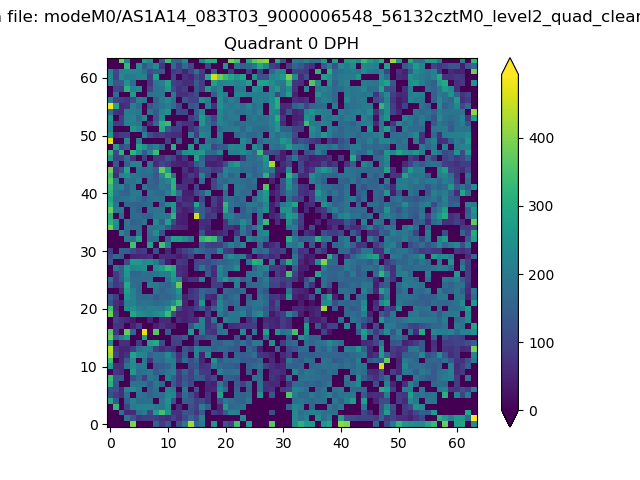 |
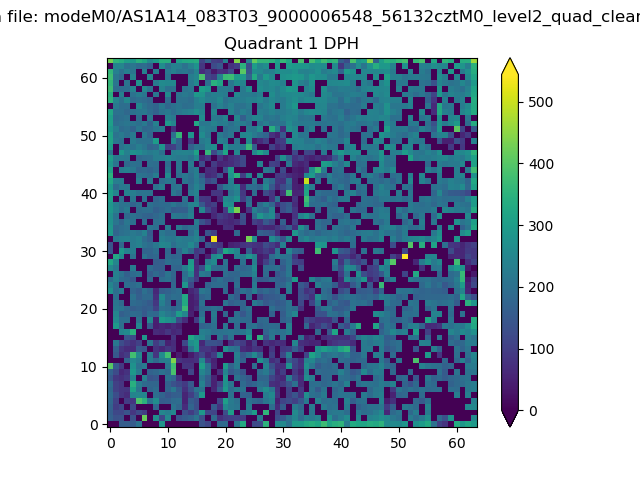 |
Quadrant B |
|---|---|---|---|
| Quadrant D | 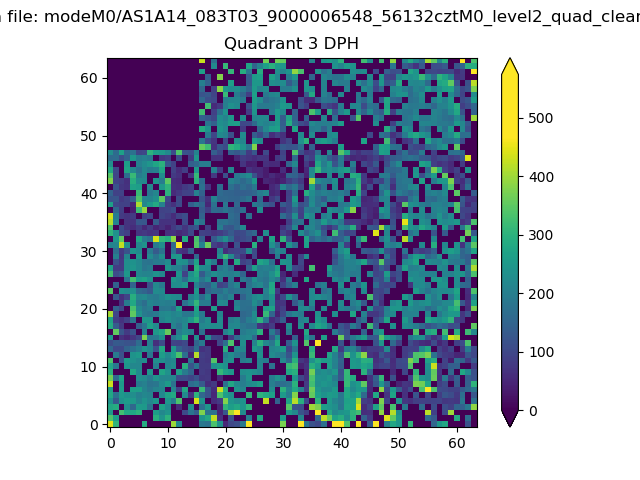 |
 |
Quadrant C |
| Plot type | Count rate plots | Images |
|---|---|---|
| Comparison with Poisson distribution Blue bars denote a histogram of data divided into 1 sec bins. Red curve is a Poisson curve with rate = median count rate of data. |
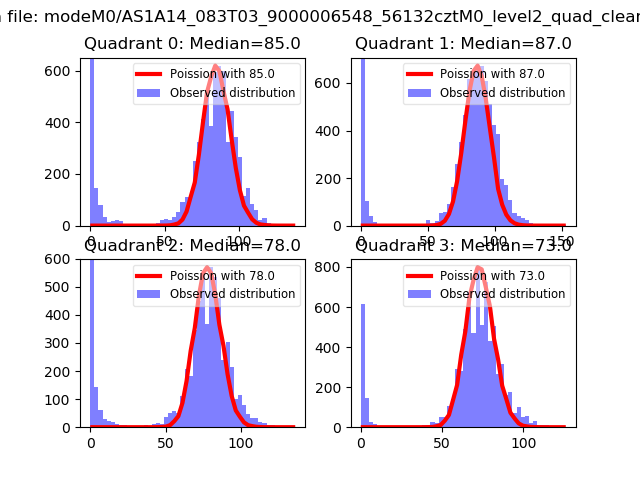 |
 |
| Quadrant-wise count rates Data is divided into 100 sec bins |
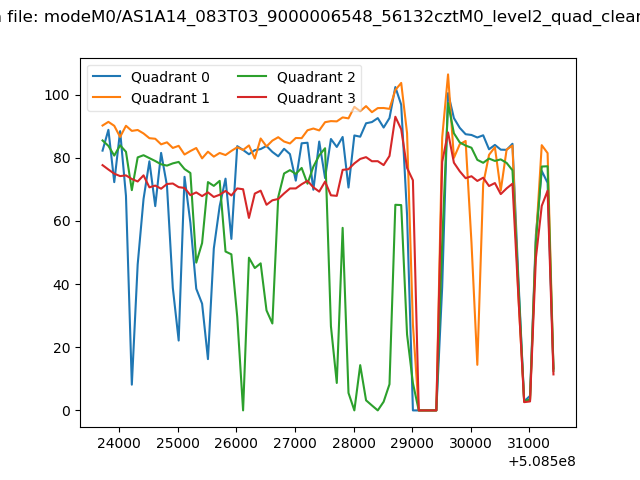 |
|
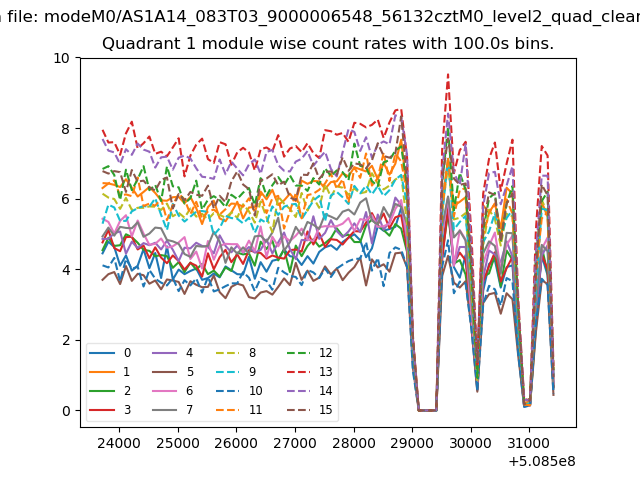
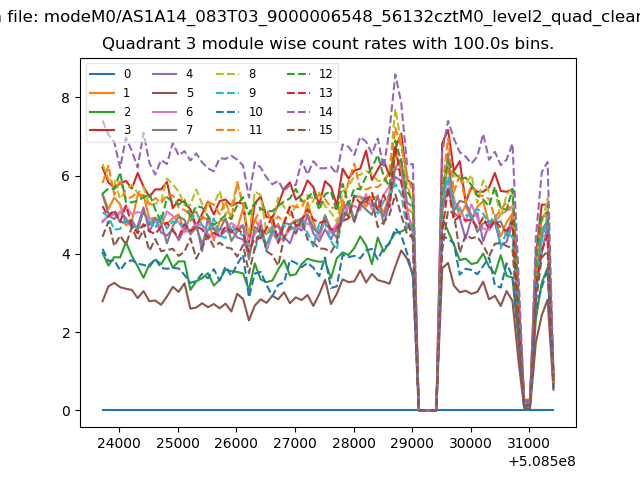
| Module-wise count rates for Quadrant A Data is divided into 100 sec bins |
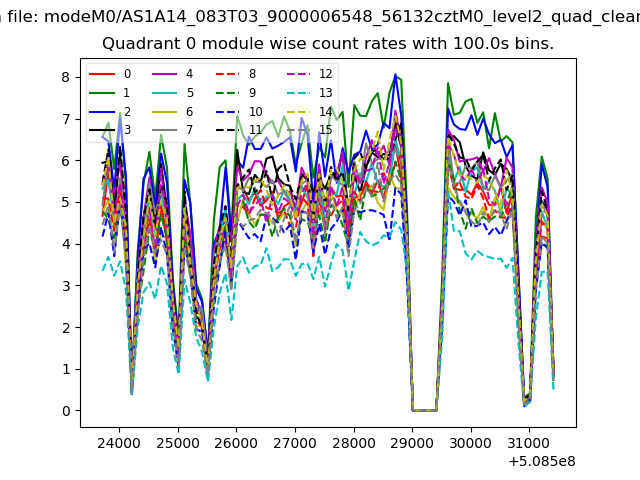 |
 |
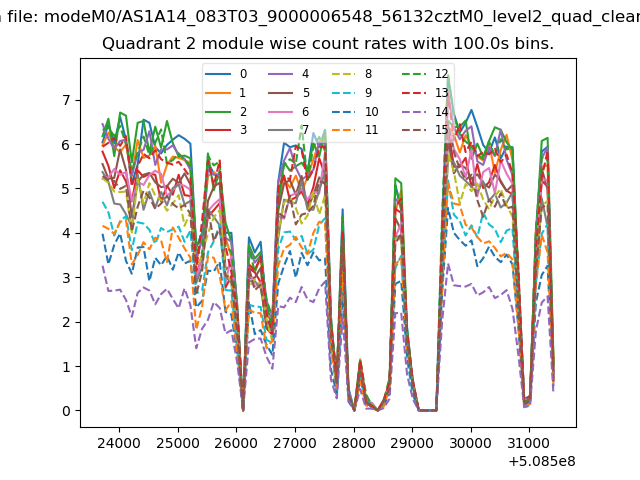
| Module-wise count rates for Quadrant B Data is divided into 100 sec bins |
 |
 |
| Module-wise count rates for Quadrant C Data is divided into 100 sec bins |
 |
 |
| Module-wise count rates for Quadrant D Data is divided into 100 sec bins |
 |
 |
| Parameter | Plot |
|---|---|
| CZT HV Monitor |  |
| D_VDD | 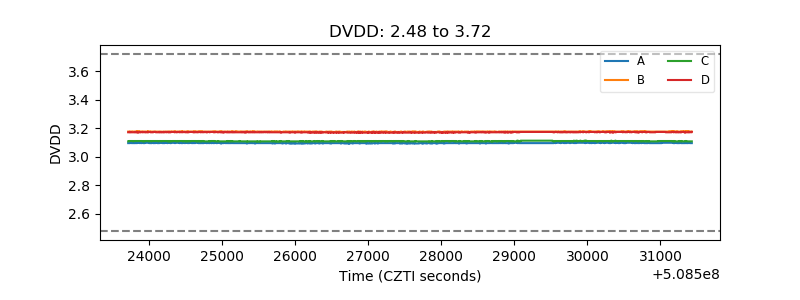 |
| Temperature 1 | 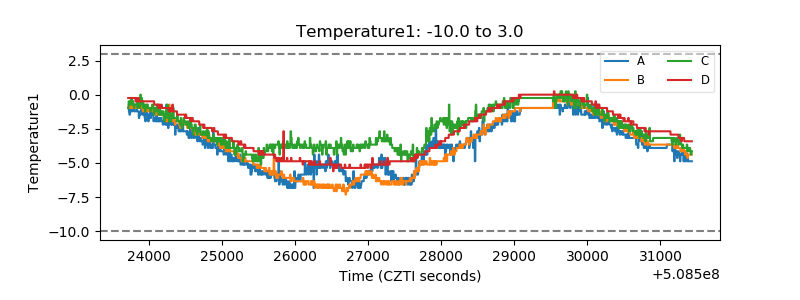 |
| Veto HV Monitor | 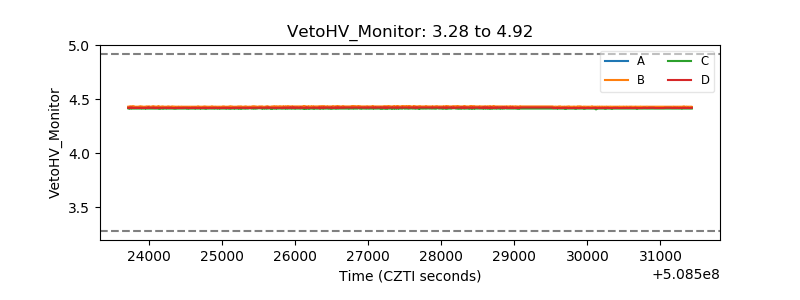 |
| Veto LLD | 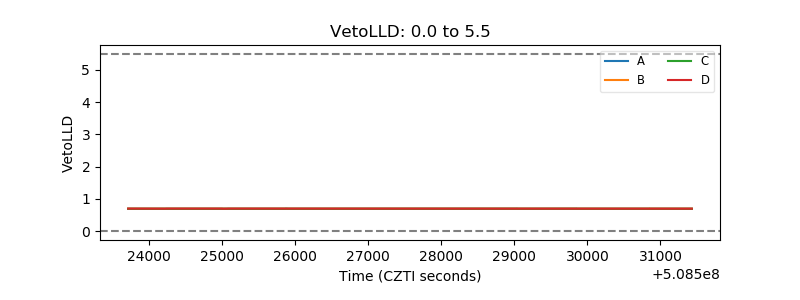 |
| Alpha Counter | 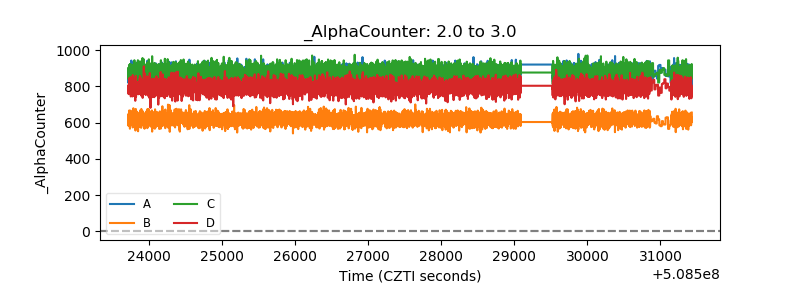 |
| _CPM_Rate | 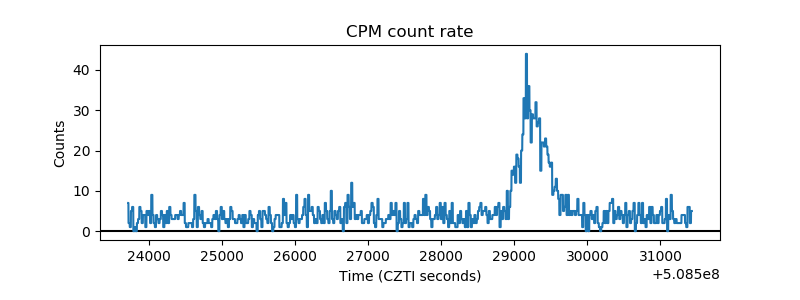 |
| CZT Counter | 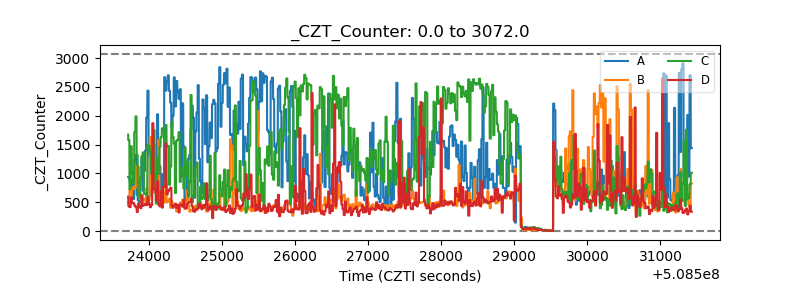 |
| +2.5 Volts monitor |  |
| +5 Volts monitor | 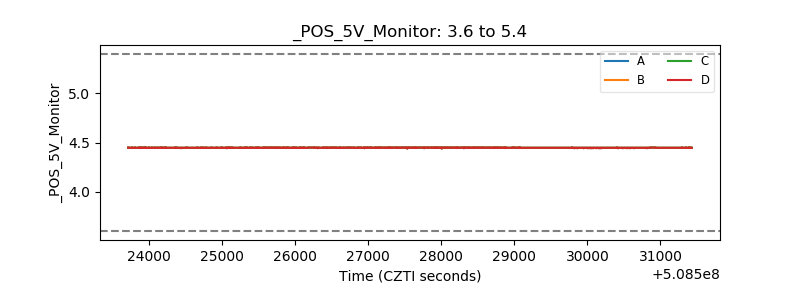 |
| _ROLL_ROT | 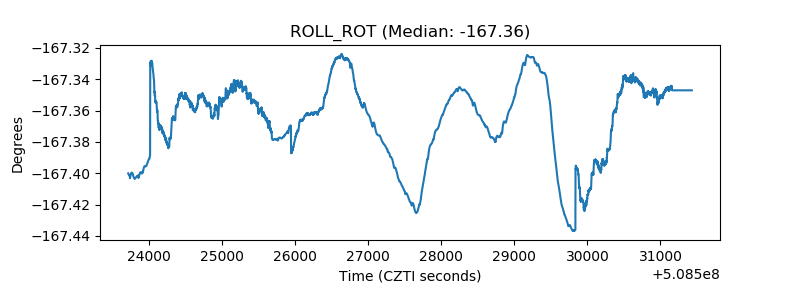 |
| _Roll_DEC | 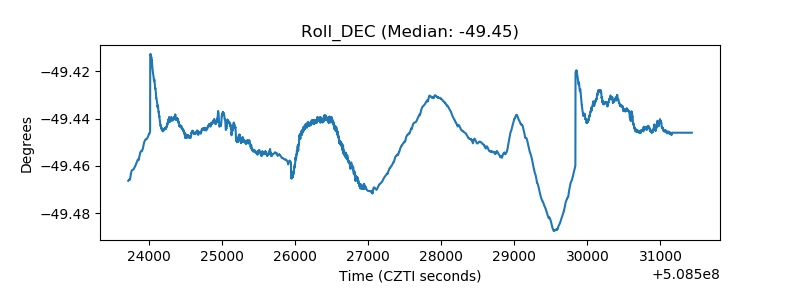 |
| _Roll_RA | 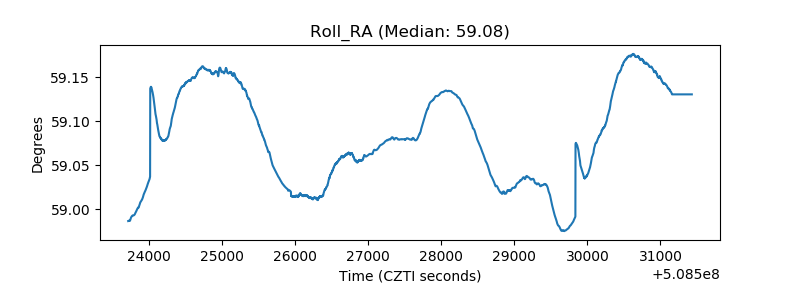 |
| Veto Counter | 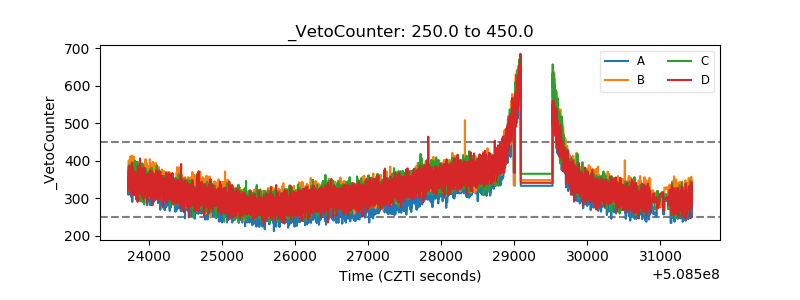 |