| Param | Original file | Final file |
|---|---|---|
| Filename | modeM0/AS1A14_083T03_9000006548_56133cztM0_level2.fits | modeM0/AS1A14_083T03_9000006548_56133cztM0_level2_quad_clean.evt |
| Size (bytes) | 746,717,760 | 92,897,280 |
| Size | 712.1 MB | 88.6 MB |
| Events in quadrant A | 7,047,649 | 595,519 |
| Events in quadrant B | 5,284,801 | 643,837 |
| Events in quadrant C | 8,283,881 | 524,080 |
| Events in quadrant D | 6,420,866 | 506,204 |
| Mode M0 | |||
|---|---|---|---|
| Quadrant | BADHDUFLAG | Total packets | Discarded packets |
| A | 0 | 26370 | 3 |
| B | 0 | 21244 | 1 |
| C | 0 | 30068 | 1 |
| D | 0 | 24865 | 1 |
| Mode SS | |||
|---|---|---|---|
| Quadrant | BADHDUFLAG | Total packets | Discarded packets |
| A | 0 | 156 | 0 |
| B | 0 | 156 | 0 |
| C | 0 | 156 | 0 |
| D | 0 | 156 | 0 |
| Quadrant | Total seconds | Saturated seconds | Saturation percentage |
|---|---|---|---|
| A | 7800 | 805 | 10.320513% |
| B | 7801 | 425 | 5.448019% |
| C | 7801 | 1287 | 16.497885% |
| D | 7801 | 854 | 10.947314% |
Noise dominated data is calculated using 1-second bins in cleaned event files. If a bin has >2000 counts, and if more than 50% of those come from <1% of pixels, then it is considered to be noise-dominated and hence unusable.
| Quadrant | # 1 sec bins | Bins with >0 counts | Bins with >2000 counts | High rate bins dominated by noise | Noise dominated (total time) | Noise dominated (detector-on time) | Marked lightcurve |
|---|---|---|---|---|---|---|---|
| A | 8087 | 8069 | 682 | 682 | 8.43% | 8.45% | 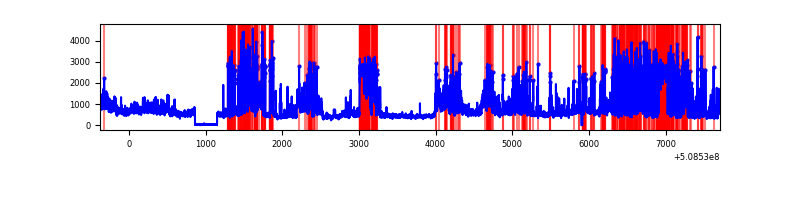 |
| B | 8088 | 8069 | 294 | 294 | 3.64% | 3.64% | 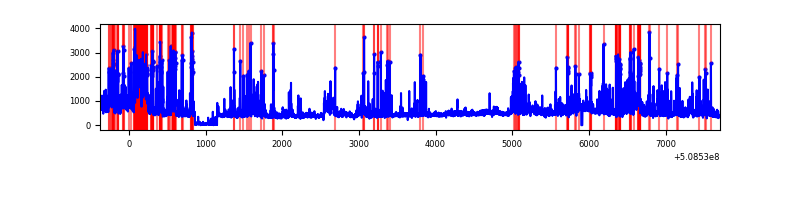 |
| C | 8088 | 8070 | 1091 | 1091 | 13.49% | 13.52% | 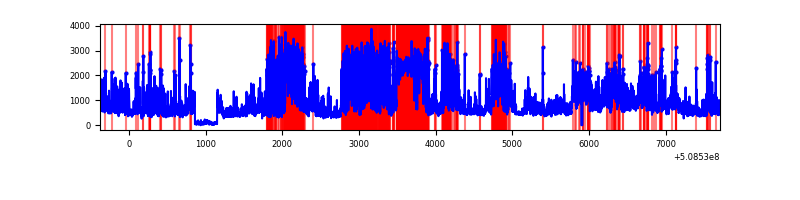 |
| D | 8088 | 8070 | 799 | 799 | 9.88% | 9.90% | 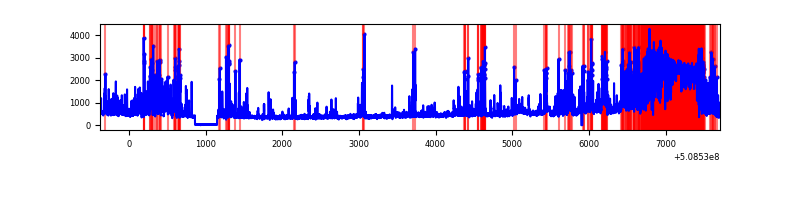 |
Top three noisy pixels from each quadrant. If the there are fewer than three noisy pixels in the level2.evt file, extra rows are filled as -1
| Pixel properties | Quadrant properties | ||||||
|---|---|---|---|---|---|---|---|
| Quadrant | DetID | PixID | Counts | Sigma | Mean | Median | Sigma |
| A | 12 | 115 | 1718241 | 8736.0 | 791 | 773 | 196.6 |
| A | 3 | 14 | 1288065 | 6547.88 | 791 | 773 | 196.6 |
| A | 0 | 8 | 261630 | 1326.86 | 791 | 773 | 196.6 |
| B | 5 | 172 | 711686 | 4155.72 | 803 | 773 | 171.1 |
| B | 8 | 128 | 343229 | 2001.86 | 803 | 773 | 171.1 |
| B | 4 | 156 | 152555 | 887.26 | 803 | 773 | 171.1 |
| C | 9 | 38 | 1856257 | 9360.31 | 721 | 713 | 198.2 |
| C | 15 | 147 | 1823973 | 9197.45 | 721 | 713 | 198.2 |
| C | 15 | 148 | 1208632 | 6093.36 | 721 | 713 | 198.2 |
| D | 2 | 62 | 1919529 | 9232.44 | 731 | 698 | 207.8 |
| D | 8 | 129 | 273790 | 1313.98 | 731 | 698 | 207.8 |
| D | 2 | 249 | 252817 | 1213.07 | 731 | 698 | 207.8 |
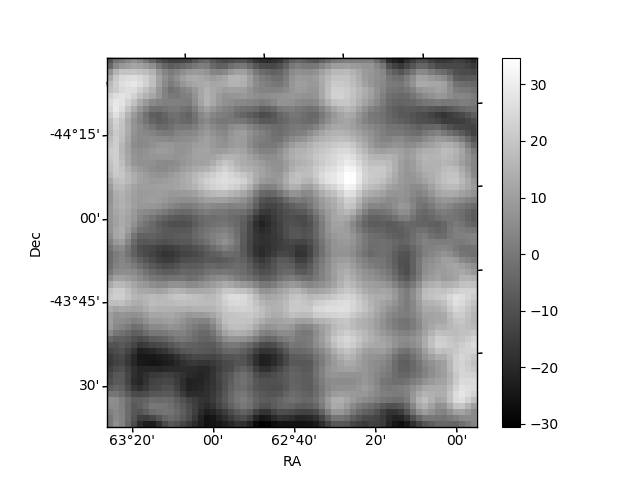
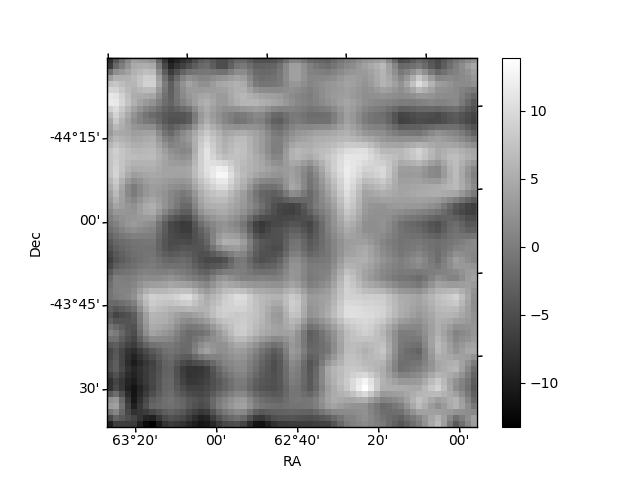
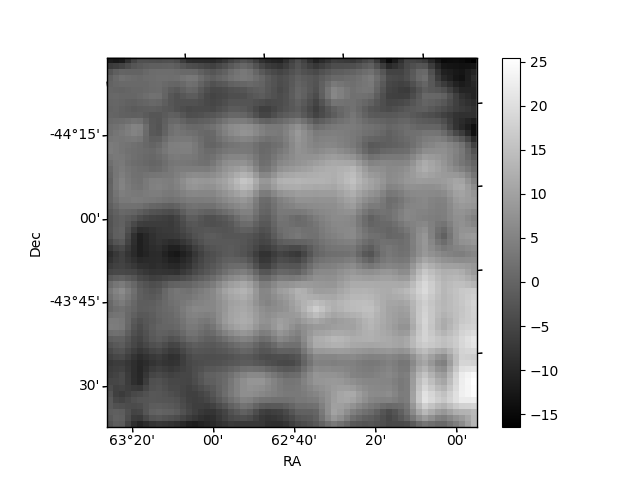
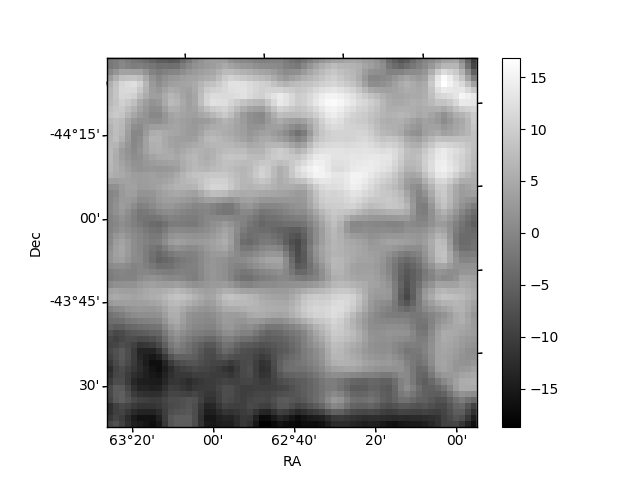
Histogram calculated using DETX and DETY for each event in the final _common_clean file
| Quadrant A | 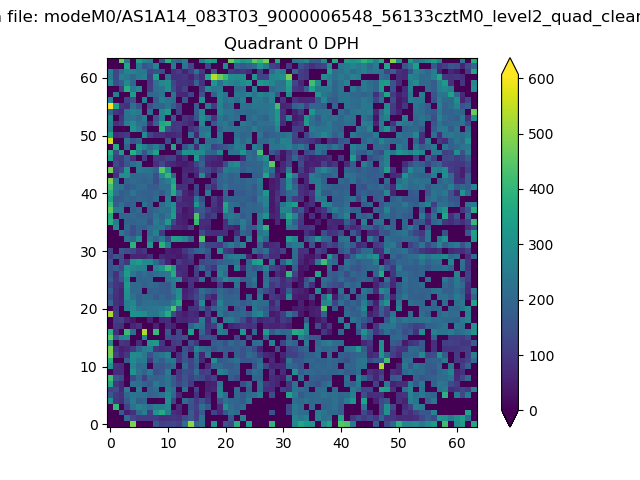 |
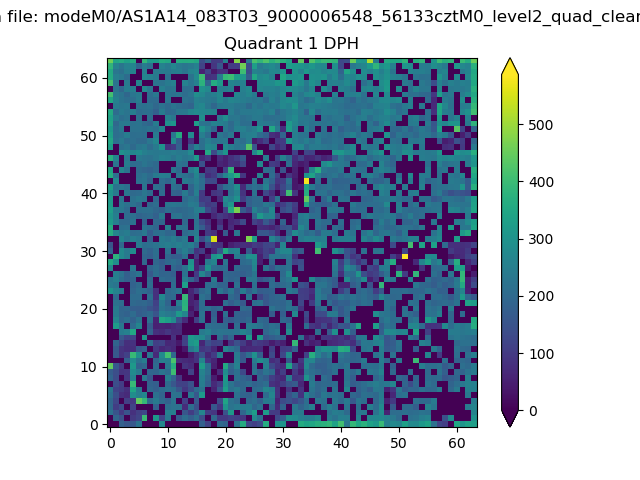 |
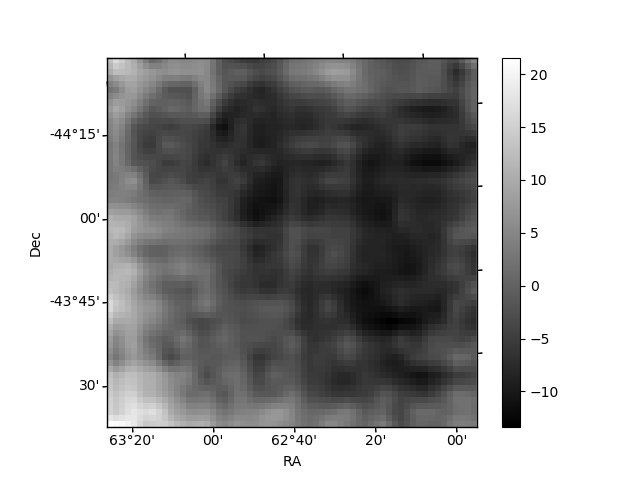
Quadrant B |
|---|---|---|---|
| Quadrant D | 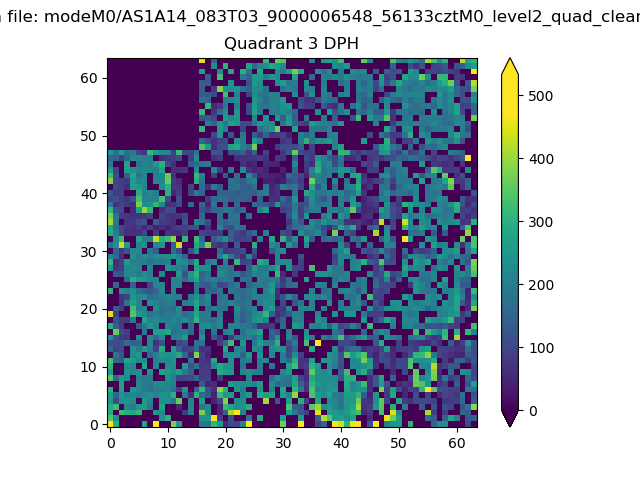 |
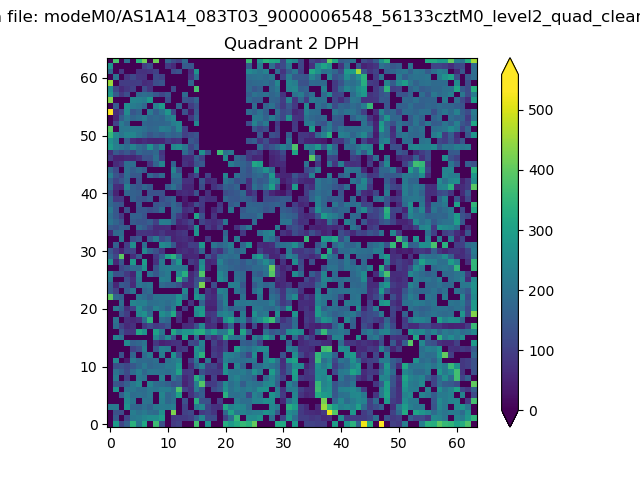 |
Quadrant C |
| Plot type | Count rate plots | Images |
|---|---|---|
| Comparison with Poisson distribution Blue bars denote a histogram of data divided into 1 sec bins. Red curve is a Poisson curve with rate = median count rate of data. |
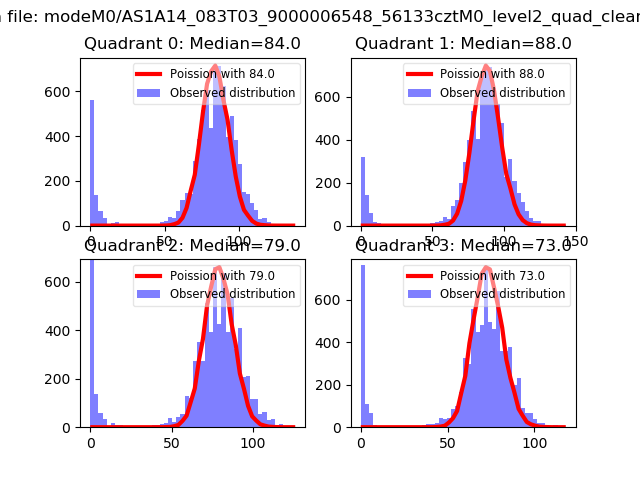 |
 |
| Quadrant-wise count rates Data is divided into 100 sec bins |
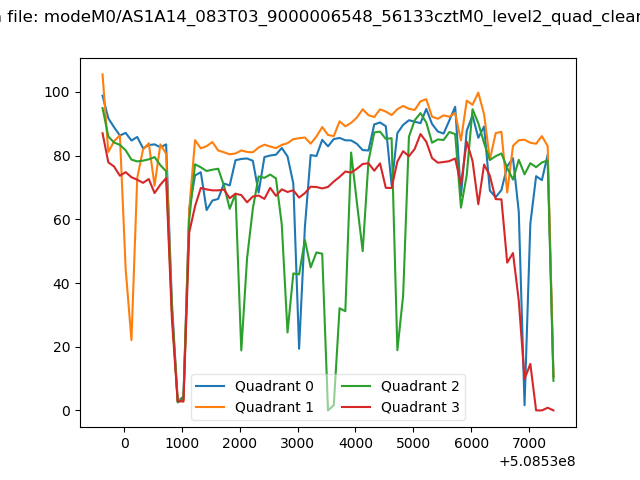 |
|
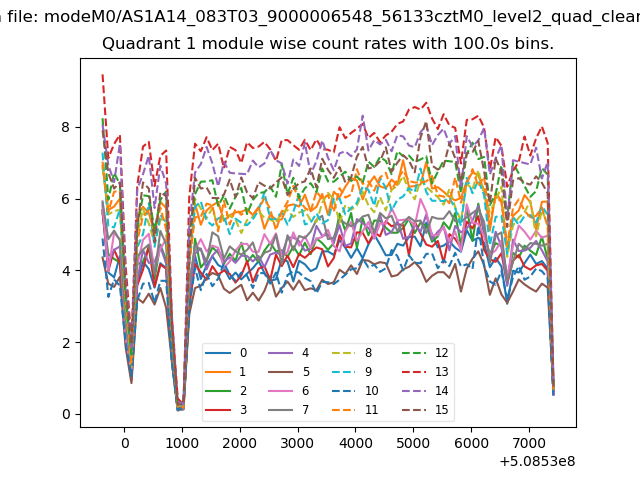
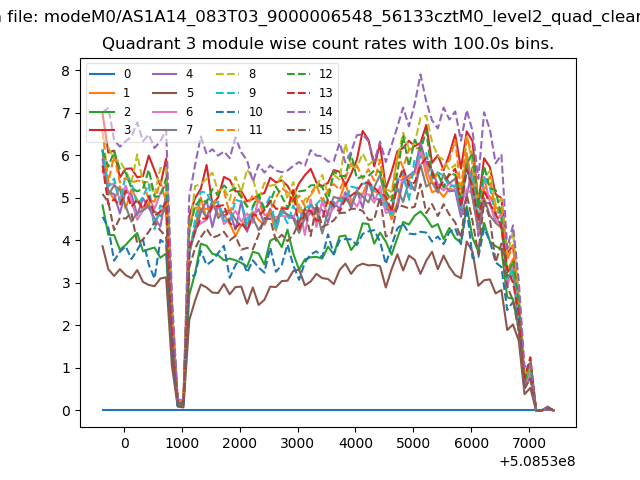
| Module-wise count rates for Quadrant A Data is divided into 100 sec bins |
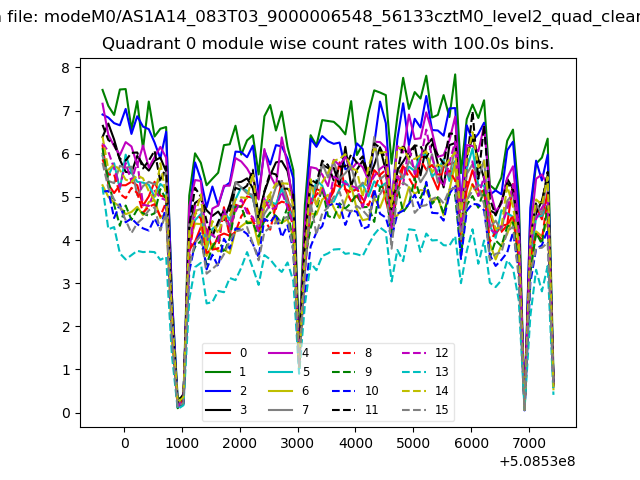 |
 |
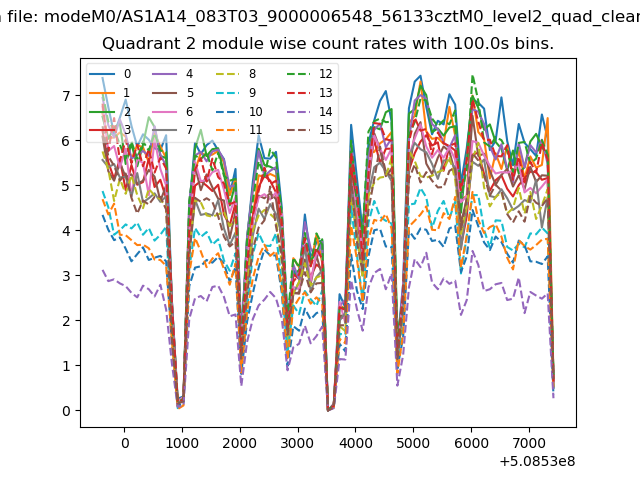
| Module-wise count rates for Quadrant B Data is divided into 100 sec bins |
 |
 |
| Module-wise count rates for Quadrant C Data is divided into 100 sec bins |
 |
 |
| Module-wise count rates for Quadrant D Data is divided into 100 sec bins |
 |
 |
| Parameter | Plot |
|---|---|
| CZT HV Monitor | 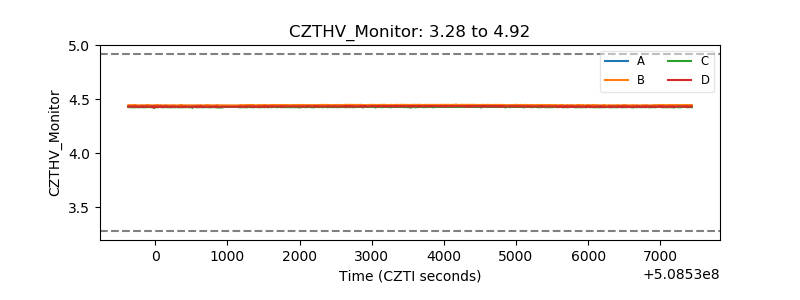 |
| D_VDD | 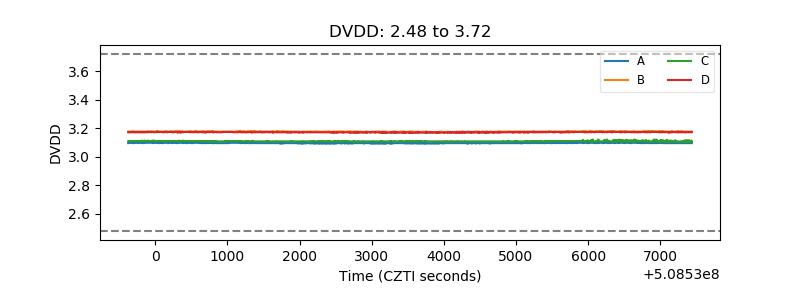 |
| Temperature 1 | 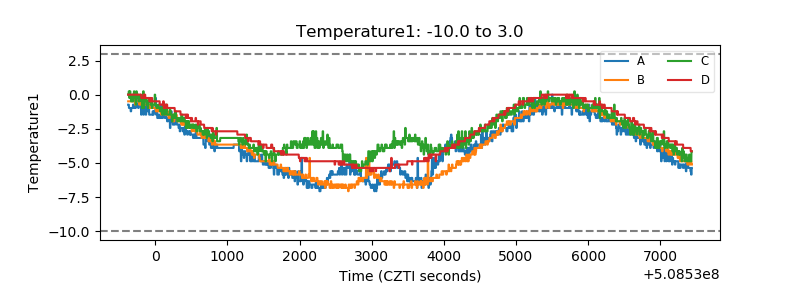 |
| Veto HV Monitor | 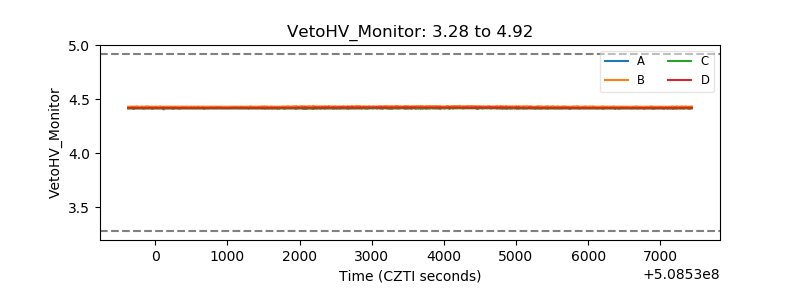 |
| Veto LLD | 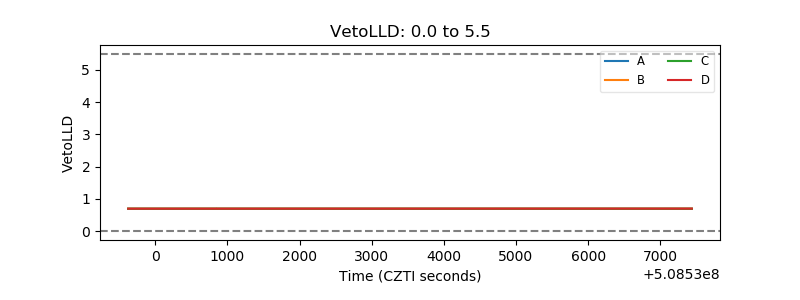 |
| Alpha Counter | 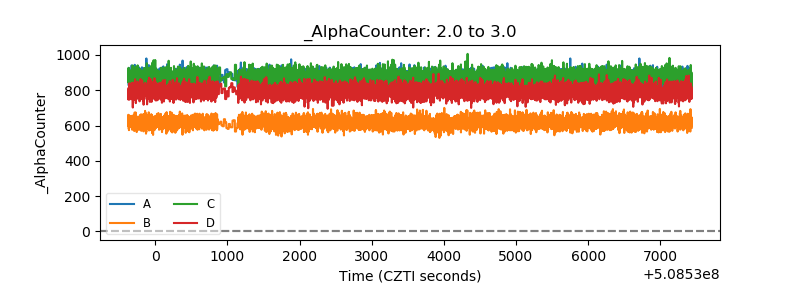 |
| _CPM_Rate | 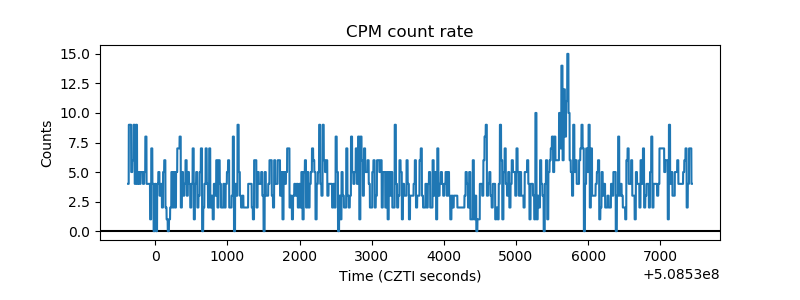 |
| CZT Counter | 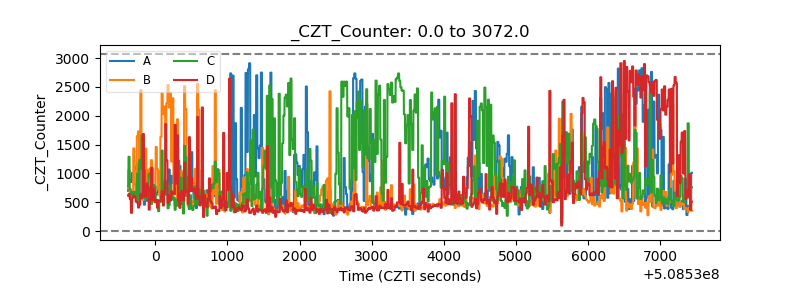 |
| +2.5 Volts monitor | 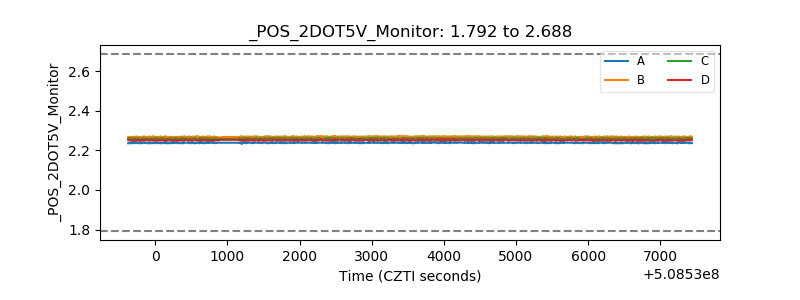 |
| +5 Volts monitor | 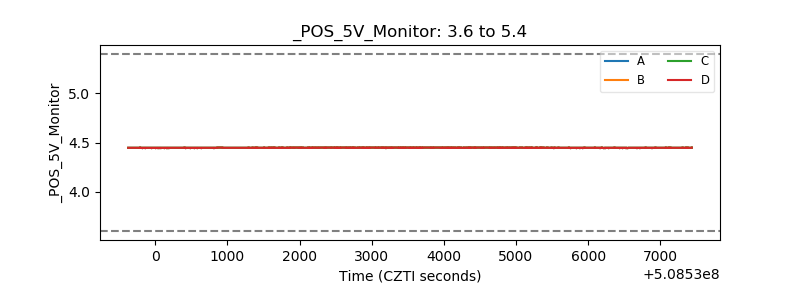 |
| _ROLL_ROT | 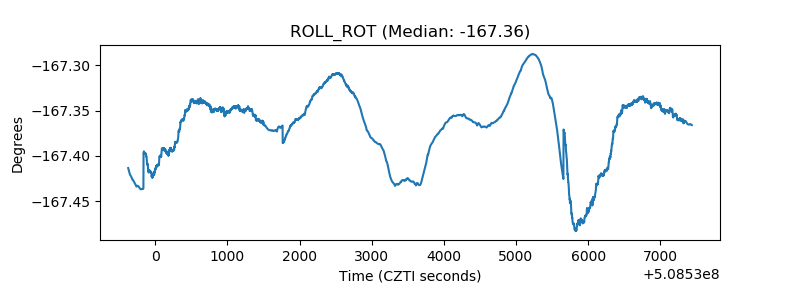 |
| _Roll_DEC | 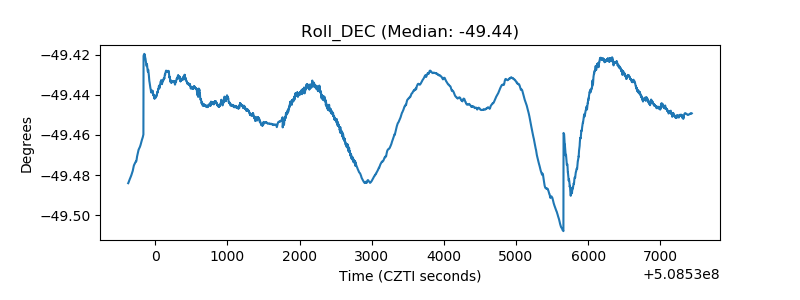 |
| _Roll_RA | 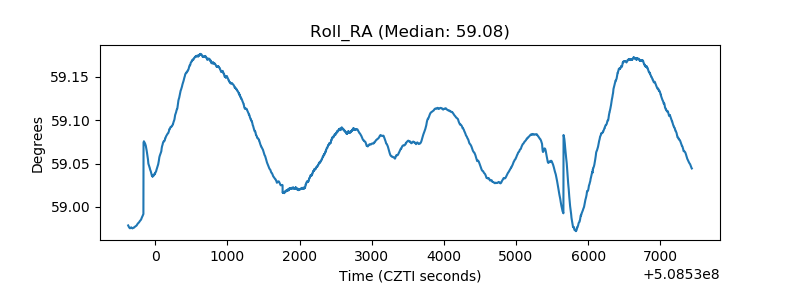 |
| Veto Counter | 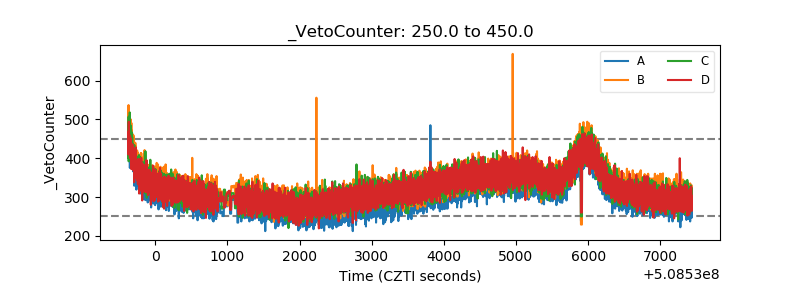 |