| Param | Original file | Final file |
|---|---|---|
| Filename | modeM0/AS1A14_083T03_9000006548_56134cztM0_level2.fits | modeM0/AS1A14_083T03_9000006548_56134cztM0_level2_quad_clean.evt |
| Size (bytes) | 757,877,760 | 105,531,840 |
| Size | 722.8 MB | 100.6 MB |
| Events in quadrant A | 6,617,837 | 698,321 |
| Events in quadrant B | 4,512,624 | 778,560 |
| Events in quadrant C | 8,674,780 | 606,675 |
| Events in quadrant D | 7,635,505 | 560,325 |
| Mode M0 | |||
|---|---|---|---|
| Quadrant | BADHDUFLAG | Total packets | Discarded packets |
| A | 0 | 25125 | 0 |
| B | 0 | 19088 | 0 |
| C | 0 | 31366 | 1 |
| D | 0 | 28327 | 0 |
| Mode SS | |||
|---|---|---|---|
| Quadrant | BADHDUFLAG | Total packets | Discarded packets |
| A | 0 | 158 | 0 |
| B | 0 | 158 | 0 |
| C | 0 | 158 | 0 |
| D | 0 | 158 | 0 |
| Quadrant | Total seconds | Saturated seconds | Saturation percentage |
|---|---|---|---|
| A | 7929 | 556 | 7.012234% |
| B | 7929 | 188 | 2.371043% |
| C | 7929 | 1192 | 15.033422% |
| D | 7929 | 1210 | 15.260436% |
Noise dominated data is calculated using 1-second bins in cleaned event files. If a bin has >2000 counts, and if more than 50% of those come from <1% of pixels, then it is considered to be noise-dominated and hence unusable.
| Quadrant | # 1 sec bins | Bins with >0 counts | Bins with >2000 counts | High rate bins dominated by noise | Noise dominated (total time) | Noise dominated (detector-on time) | Marked lightcurve |
|---|---|---|---|---|---|---|---|
| A | 7929 | 7929 | 518 | 518 | 6.53% | 6.53% | 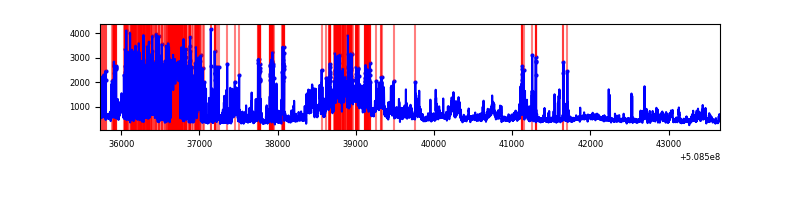 |
| B | 7929 | 7929 | 118 | 118 | 1.49% | 1.49% | 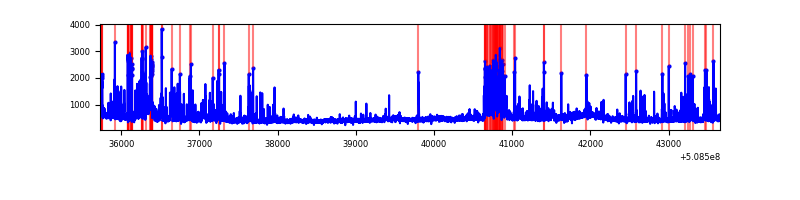 |
| C | 7929 | 7929 | 873 | 873 | 11.01% | 11.01% | 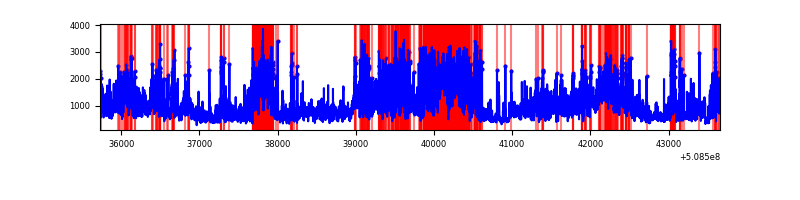 |
| D | 7929 | 7929 | 1153 | 1153 | 14.54% | 14.54% | 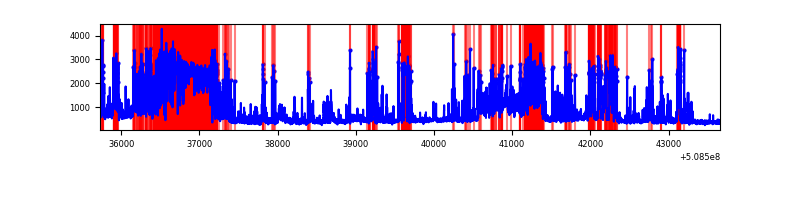 |
Top three noisy pixels from each quadrant. If the there are fewer than three noisy pixels in the level2.evt file, extra rows are filled as -1
| Pixel properties | Quadrant properties | ||||||
|---|---|---|---|---|---|---|---|
| Quadrant | DetID | PixID | Counts | Sigma | Mean | Median | Sigma |
| A | 12 | 115 | 2116091 | 10553.41 | 808 | 789 | 200.4 |
| A | 3 | 14 | 600984 | 2994.42 | 808 | 789 | 200.4 |
| A | 0 | 8 | 501882 | 2499.99 | 808 | 789 | 200.4 |
| B | 5 | 185 | 277045 | 1573.99 | 821 | 791 | 175.5 |
| B | 8 | 128 | 245359 | 1393.46 | 821 | 791 | 175.5 |
| B | 10 | 247 | 151185 | 856.89 | 821 | 791 | 175.5 |
| C | 9 | 38 | 2723359 | 13477.54 | 733 | 724 | 202.0 |
| C | 15 | 147 | 1569945 | 7767.93 | 733 | 724 | 202.0 |
| C | 15 | 148 | 690097 | 3412.52 | 733 | 724 | 202.0 |
| D | 2 | 62 | 3069554 | 15051.87 | 721 | 690 | 203.9 |
| D | 11 | 129 | 372487 | 1823.55 | 721 | 690 | 203.9 |
| D | 8 | 240 | 363025 | 1777.15 | 721 | 690 | 203.9 |
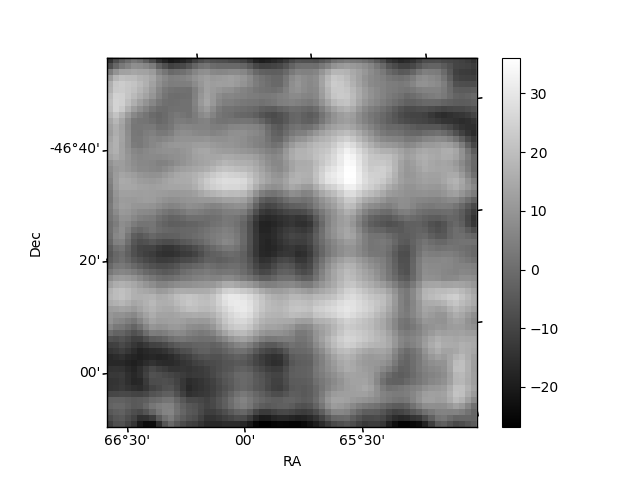
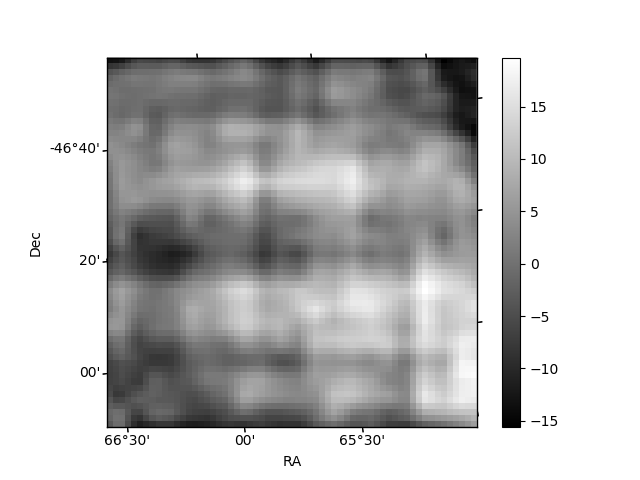
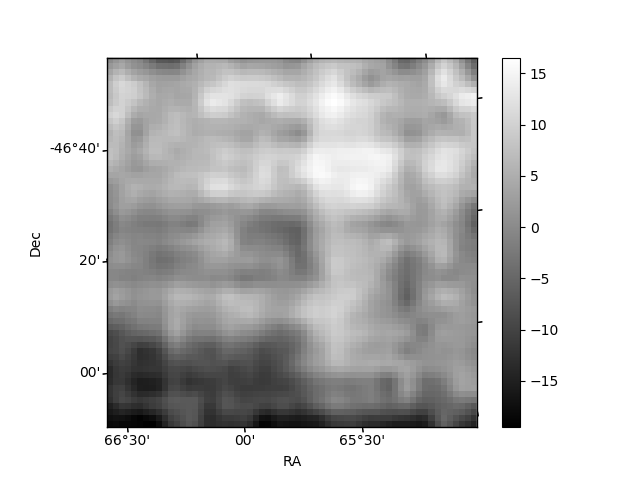
Histogram calculated using DETX and DETY for each event in the final _common_clean file
| Quadrant A | 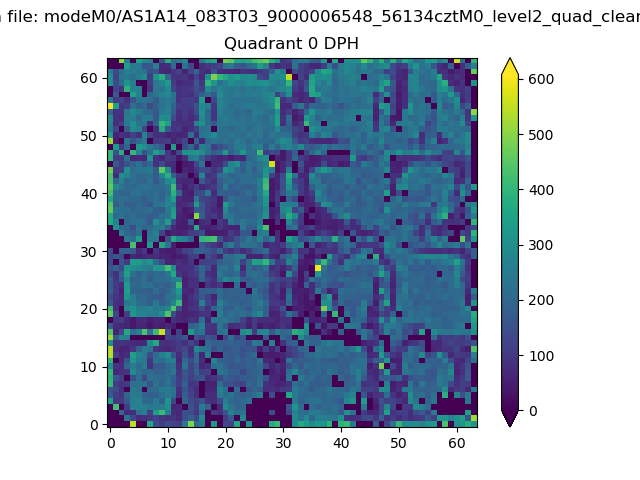 |
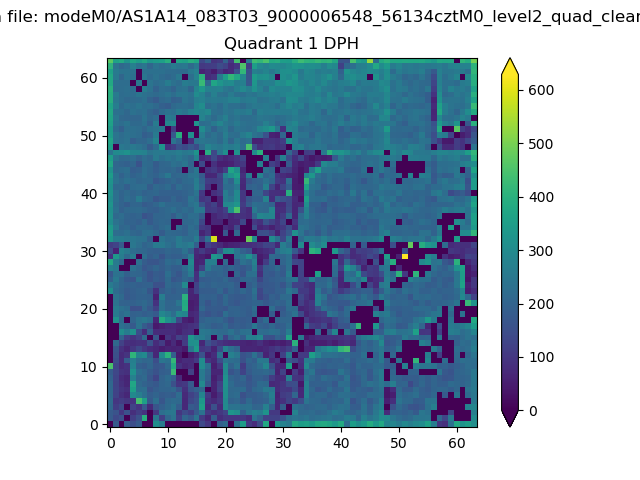 |
Quadrant B |
|---|---|---|---|
| Quadrant D | 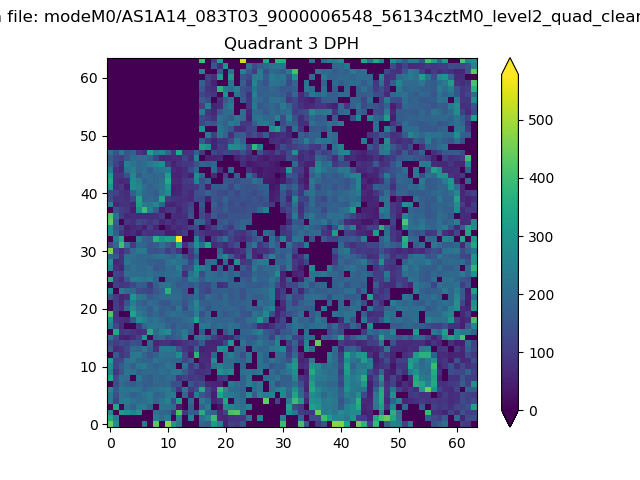 |
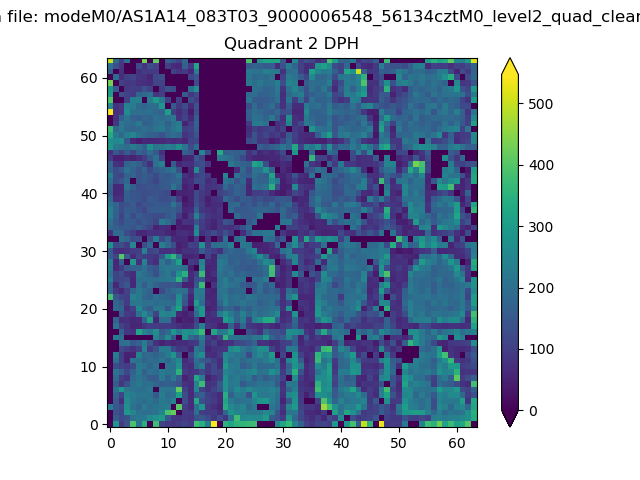 |
Quadrant C |
| Plot type | Count rate plots | Images |
|---|---|---|
| Comparison with Poisson distribution Blue bars denote a histogram of data divided into 1 sec bins. Red curve is a Poisson curve with rate = median count rate of data. |
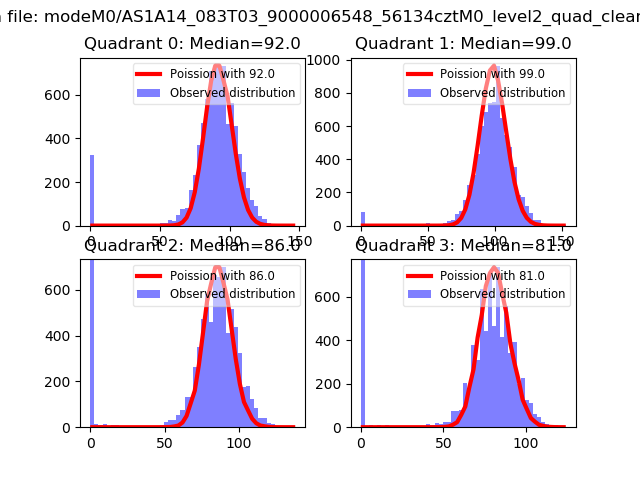 |
 |
| Quadrant-wise count rates Data is divided into 100 sec bins |
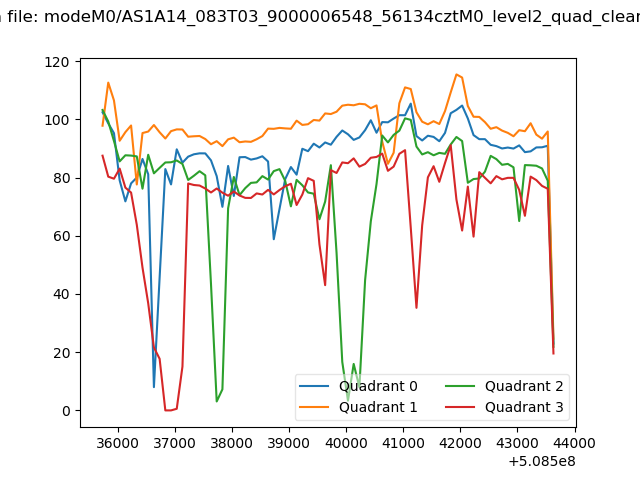 |
|
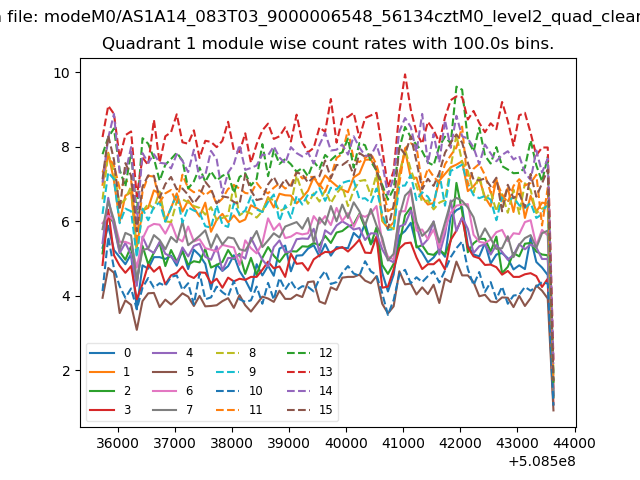
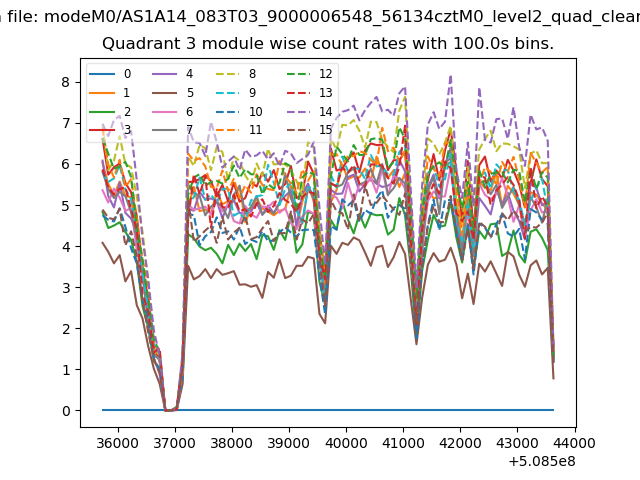
| Module-wise count rates for Quadrant A Data is divided into 100 sec bins |
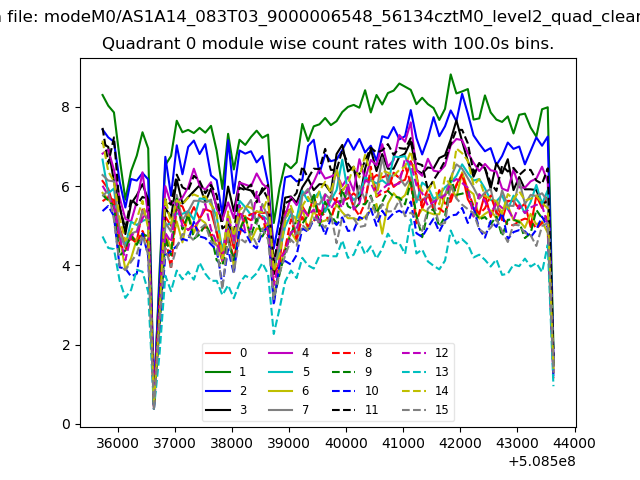 |
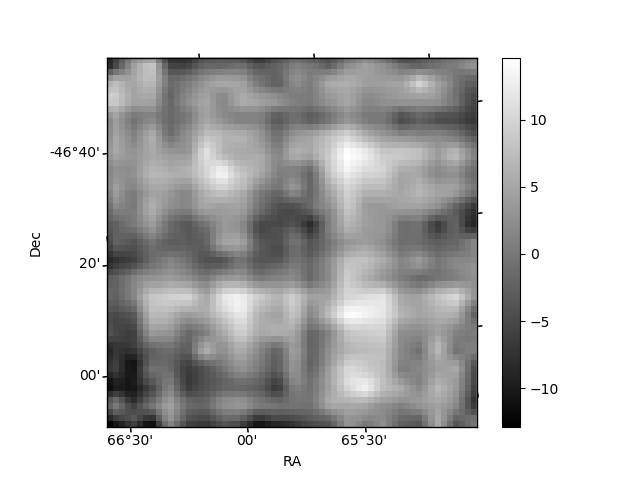 |
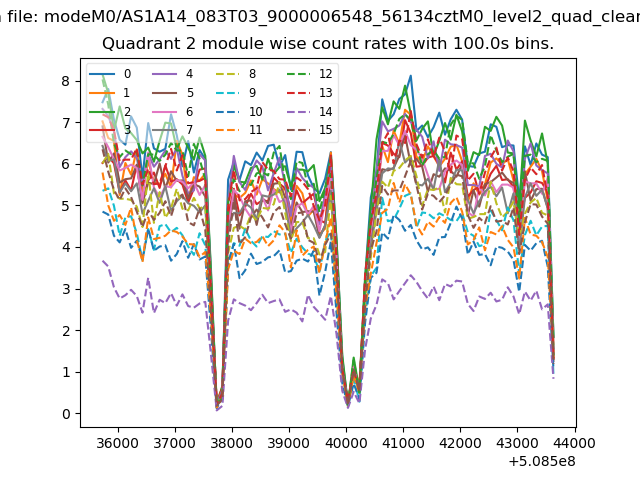
| Module-wise count rates for Quadrant B Data is divided into 100 sec bins |
 |
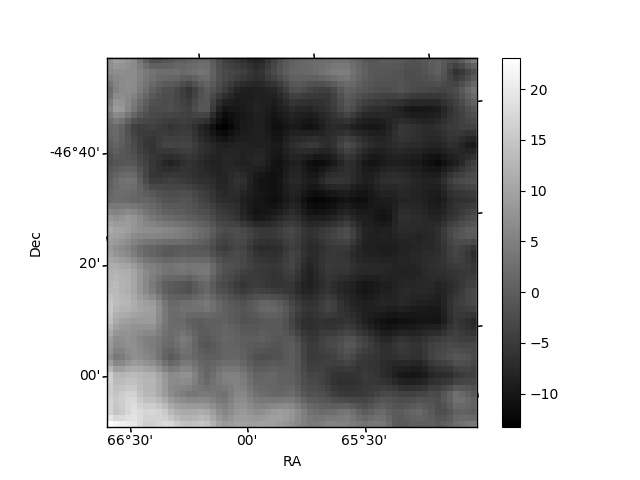 |
| Module-wise count rates for Quadrant C Data is divided into 100 sec bins |
 |
 |
| Module-wise count rates for Quadrant D Data is divided into 100 sec bins |
 |
 |
| Parameter | Plot |
|---|---|
| CZT HV Monitor | 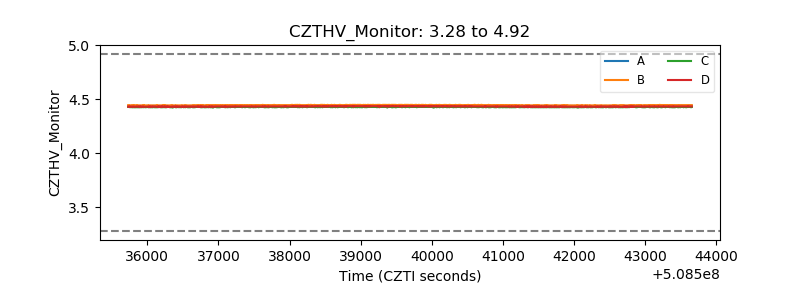 |
| D_VDD | 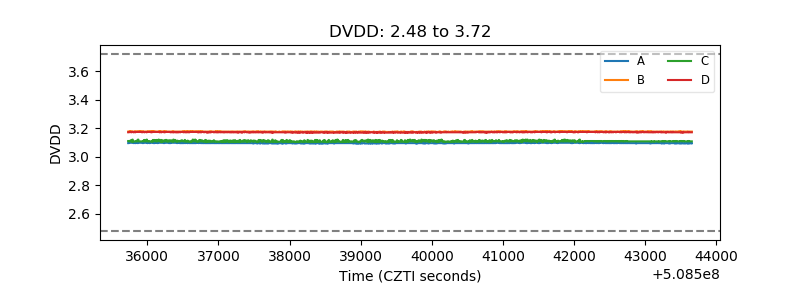 |
| Temperature 1 | 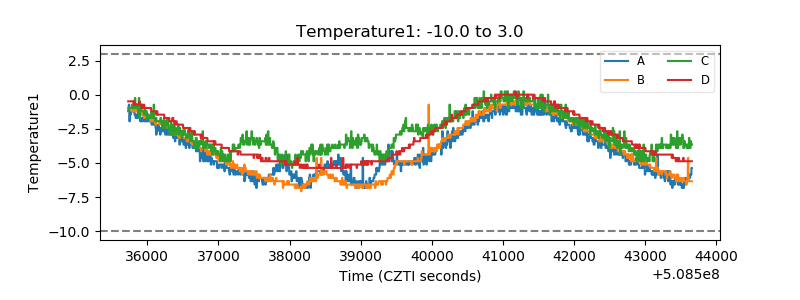 |
| Veto HV Monitor | 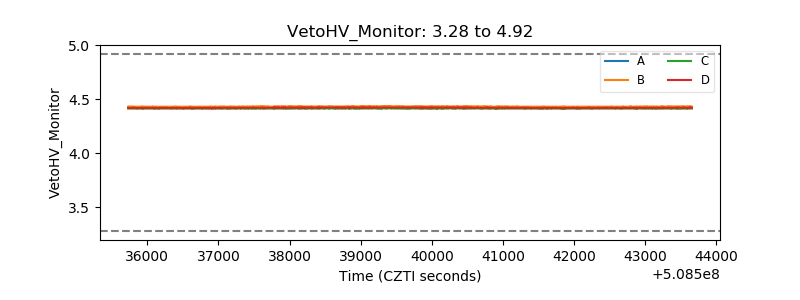 |
| Veto LLD | 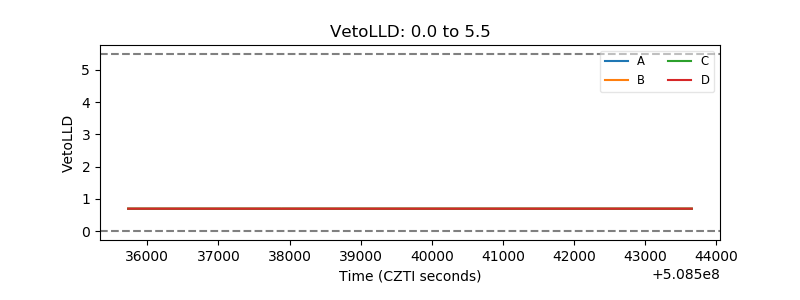 |
| Alpha Counter | 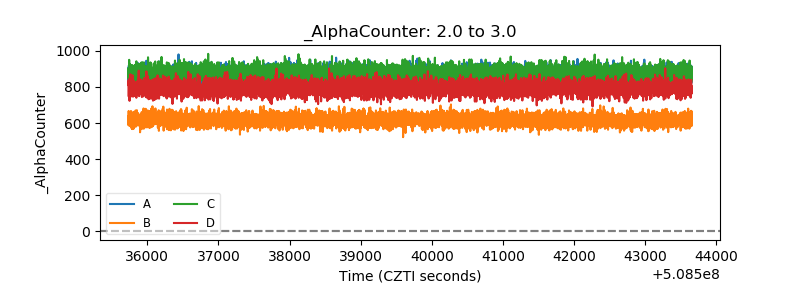 |
| _CPM_Rate | 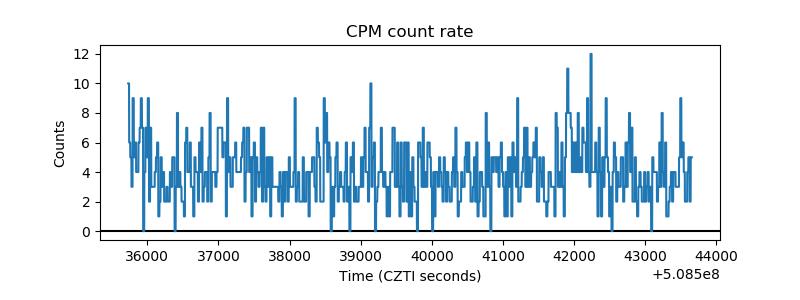 |
| CZT Counter | 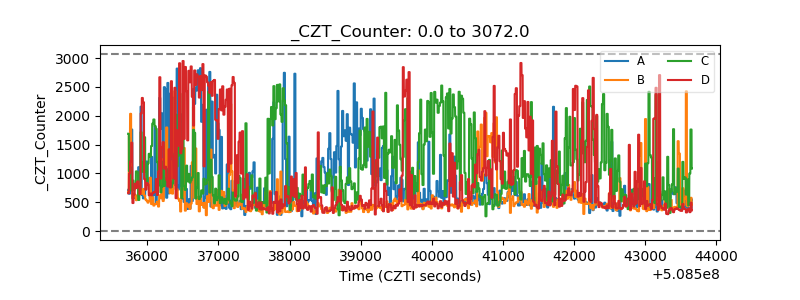 |
| +2.5 Volts monitor |  |
| +5 Volts monitor |  |
| _ROLL_ROT | 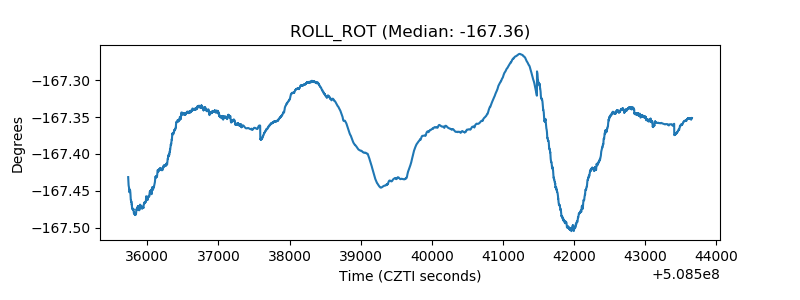 |
| _Roll_DEC | 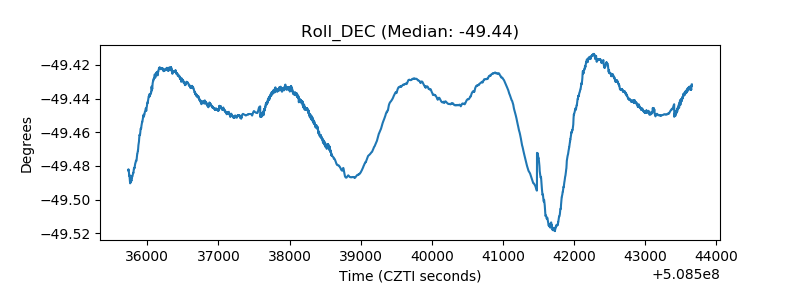 |
| _Roll_RA | 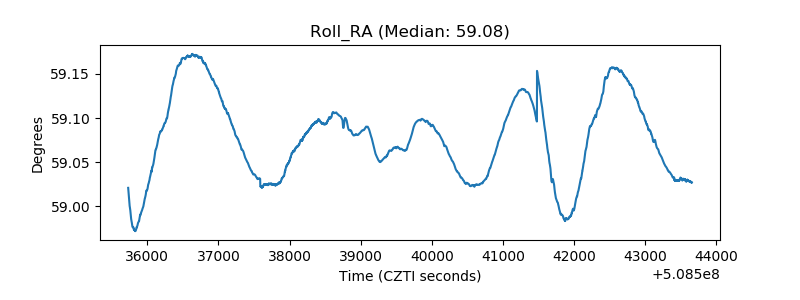 |
| Veto Counter | 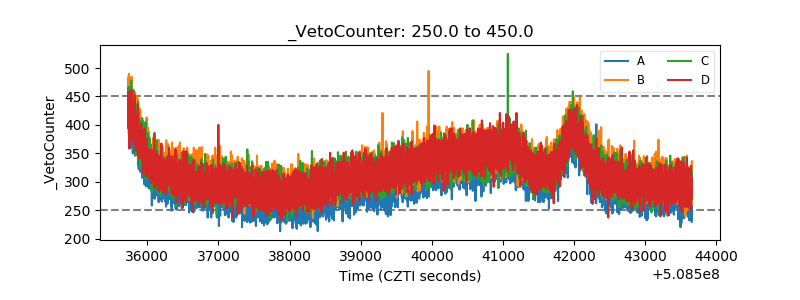 |