| Param | Original file | Final file |
|---|---|---|
| Filename | modeM0/AS1A14_083T03_9000006548_56141cztM0_level2.fits | modeM0/AS1A14_083T03_9000006548_56141cztM0_level2_quad_clean.evt |
| Size (bytes) | 533,396,160 | 99,734,400 |
| Size | 508.7 MB | 95.1 MB |
| Events in quadrant A | 6,958,275 | 589,206 |
| Events in quadrant B | 3,837,168 | 714,092 |
| Events in quadrant C | 3,685,581 | 644,424 |
| Events in quadrant D | 4,726,728 | 590,036 |
| Mode M0 | |||
|---|---|---|---|
| Quadrant | BADHDUFLAG | Total packets | Discarded packets |
| A | 0 | 25414 | 2 |
| B | 0 | 16294 | 2 |
| C | 0 | 15915 | 4 |
| D | 0 | 18813 | 2 |
| Mode SS | |||
|---|---|---|---|
| Quadrant | BADHDUFLAG | Total packets | Discarded packets |
| A | 0 | 144 | 0 |
| B | 0 | 144 | 0 |
| C | 0 | 144 | 0 |
| D | 0 | 144 | 0 |
| Mode M9 | |||
|---|---|---|---|
| Quadrant | BADHDUFLAG | Total packets | Discarded packets |
| A | 0 | 19 | 0 |
| B | 0 | 19 | 0 |
| C | 0 | 19 | 0 |
| D | 0 | 19 | 0 |
| Quadrant | Total seconds | Saturated seconds | Saturation percentage |
|---|---|---|---|
| A | 6913 | 1021 | 14.769275% |
| B | 6914 | 250 | 3.615852% |
| C | 6913 | 173 | 2.502531% |
| D | 6913 | 324 | 4.686822% |
Noise dominated data is calculated using 1-second bins in cleaned event files. If a bin has >2000 counts, and if more than 50% of those come from <1% of pixels, then it is considered to be noise-dominated and hence unusable.
| Quadrant | # 1 sec bins | Bins with >0 counts | Bins with >2000 counts | High rate bins dominated by noise | Noise dominated (total time) | Noise dominated (detector-on time) | Marked lightcurve |
|---|---|---|---|---|---|---|---|
| A | 8858 | 6913 | 922 | 922 | 10.41% | 13.34% | 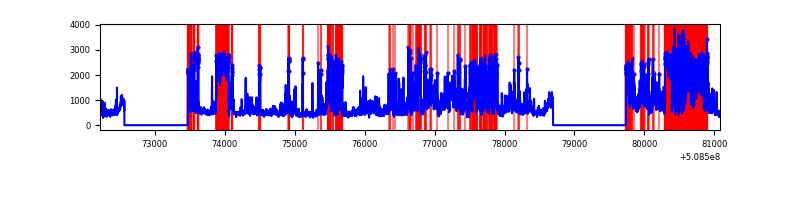 |
| B | 8859 | 6914 | 97 | 97 | 1.09% | 1.40% | 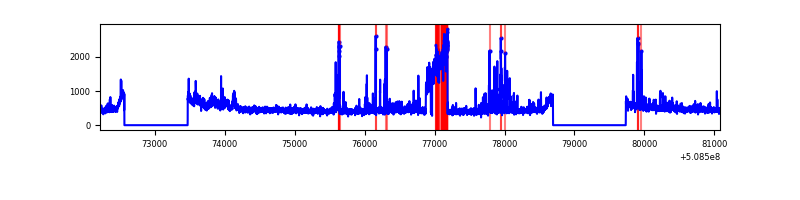 |
| C | 8858 | 6913 | 68 | 68 | 0.77% | 0.98% | 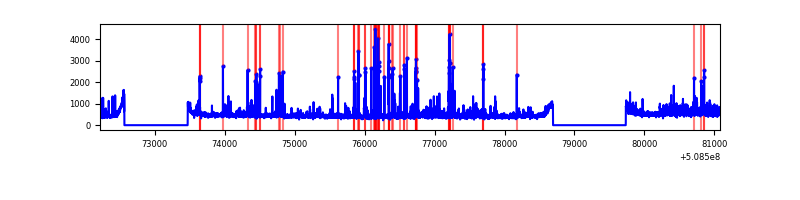 |
| D | 8858 | 6913 | 219 | 219 | 2.47% | 3.17% | 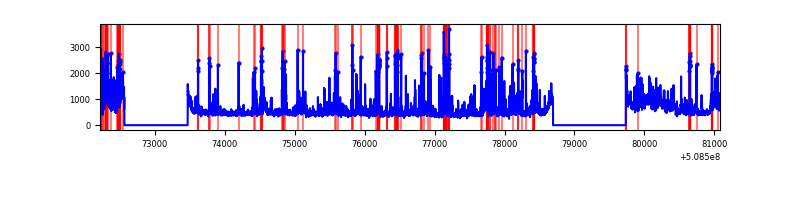 |
Top three noisy pixels from each quadrant. If the there are fewer than three noisy pixels in the level2.evt file, extra rows are filled as -1
| Pixel properties | Quadrant properties | ||||||
|---|---|---|---|---|---|---|---|
| Quadrant | DetID | PixID | Counts | Sigma | Mean | Median | Sigma |
| A | 12 | 115 | 2111627 | 11988.25 | 712 | 693 | 176.1 |
| A | 3 | 14 | 927643 | 5264.26 | 712 | 693 | 176.1 |
| A | 7 | 64 | 484273 | 2746.31 | 712 | 693 | 176.1 |
| B | 0 | 171 | 407239 | 2491.75 | 756 | 728 | 163.1 |
| B | 5 | 172 | 114732 | 698.8 | 756 | 728 | 163.1 |
| B | 10 | 247 | 89164 | 542.08 | 756 | 728 | 163.1 |
| C | 12 | 252 | 376546 | 1854.12 | 746 | 739 | 202.7 |
| C | 12 | 254 | 171257 | 841.29 | 746 | 739 | 202.7 |
| C | 1 | 16 | 131986 | 647.53 | 746 | 739 | 202.7 |
| D | 2 | 62 | 695021 | 3335.42 | 739 | 704 | 208.2 |
| D | 11 | 129 | 311631 | 1493.66 | 739 | 704 | 208.2 |
| D | 2 | 31 | 201059 | 962.48 | 739 | 704 | 208.2 |
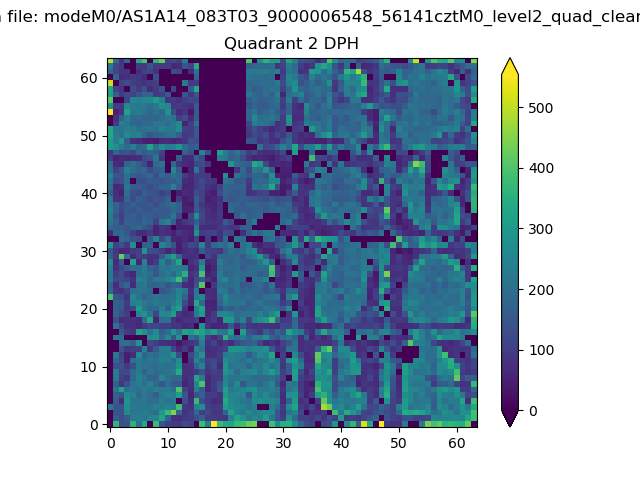
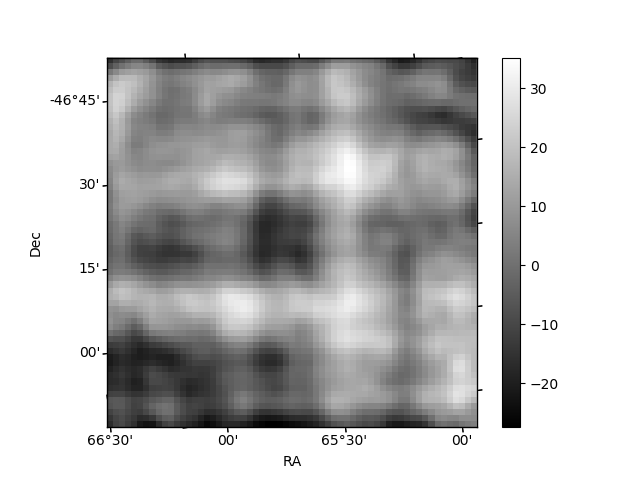
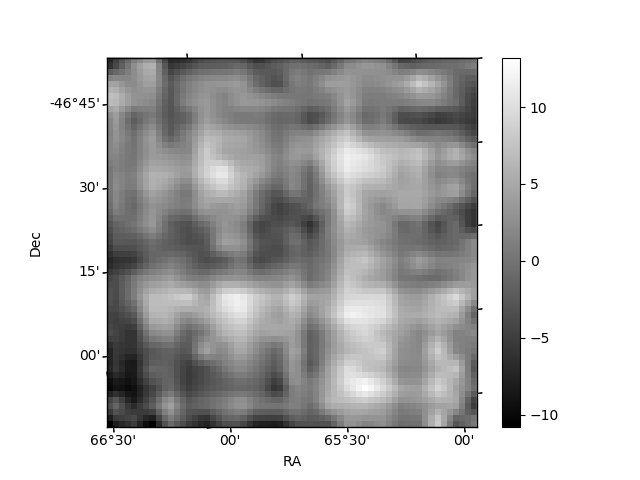
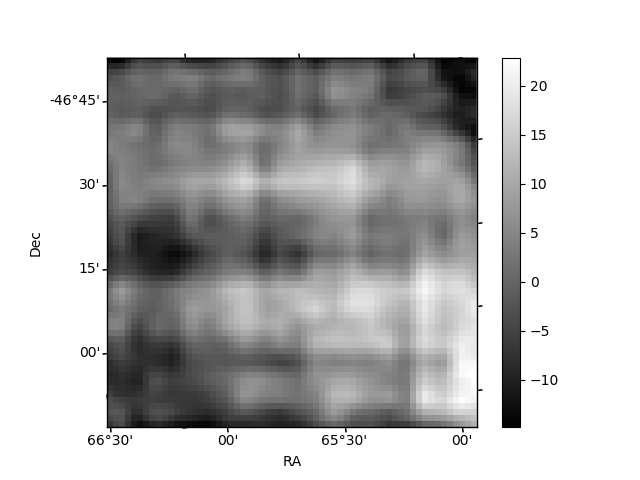
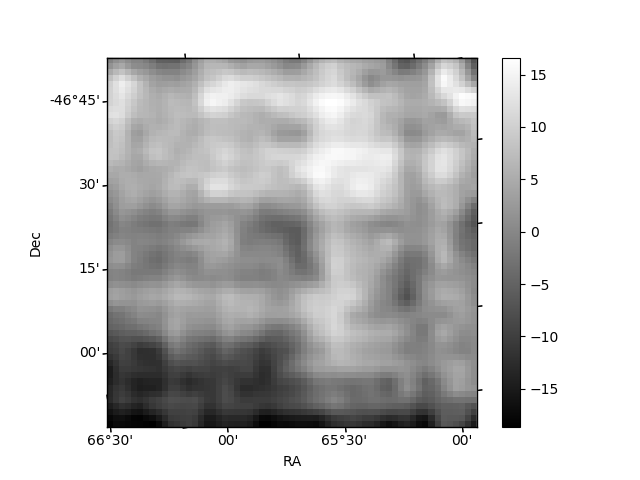
Histogram calculated using DETX and DETY for each event in the final _common_clean file
| Quadrant A | 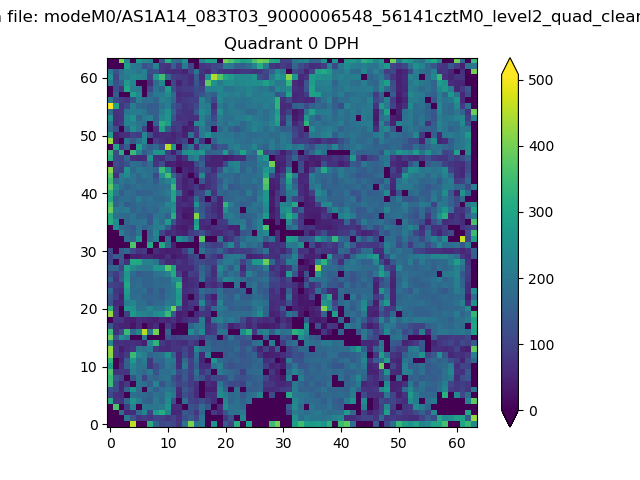 |
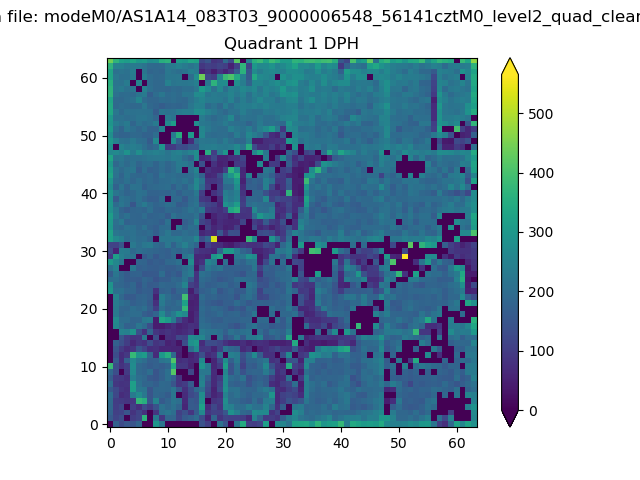 |
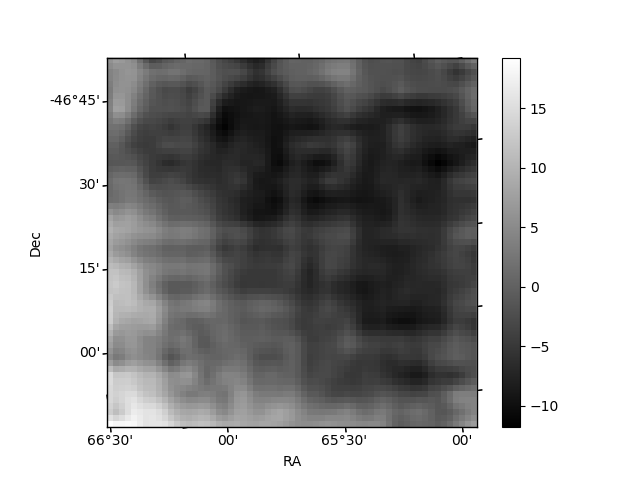
Quadrant B |
|---|---|---|---|
| Quadrant D | 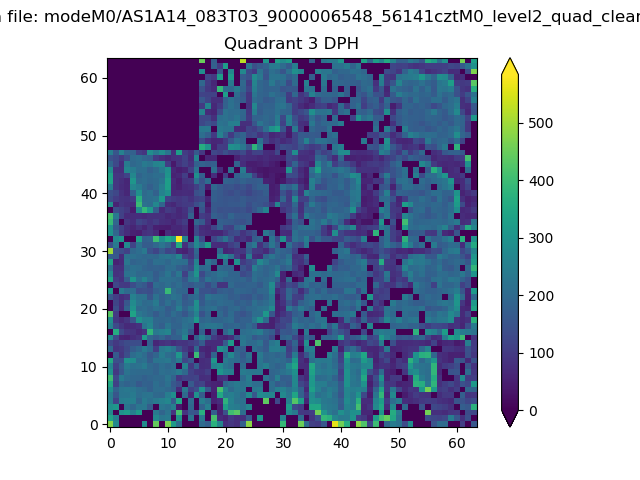 |
 |
Quadrant C |
| Plot type | Count rate plots | Images |
|---|---|---|
| Comparison with Poisson distribution Blue bars denote a histogram of data divided into 1 sec bins. Red curve is a Poisson curve with rate = median count rate of data. |
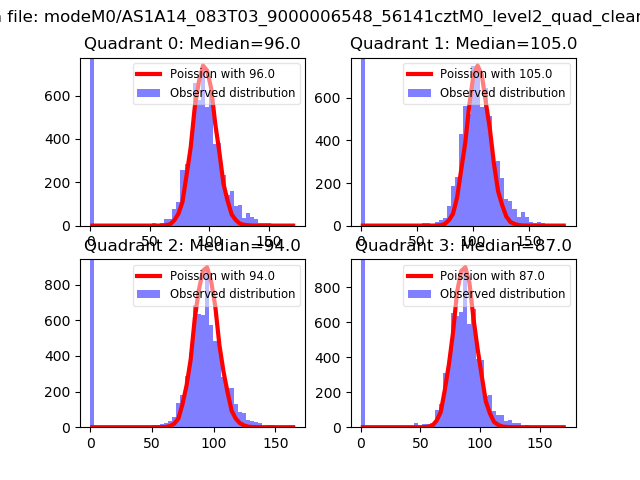 |
 |
| Quadrant-wise count rates Data is divided into 100 sec bins |
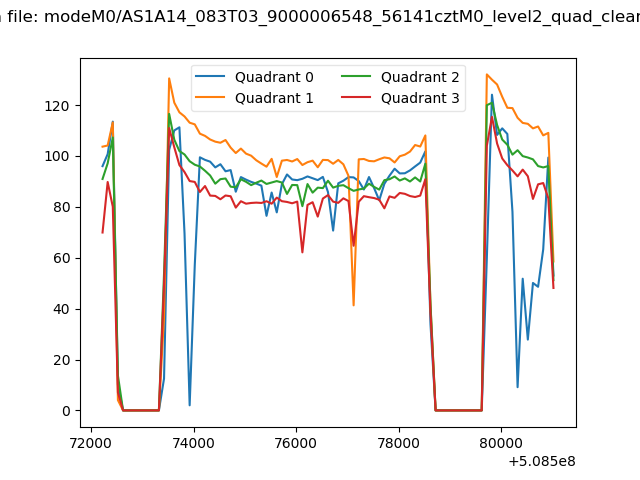 |
|
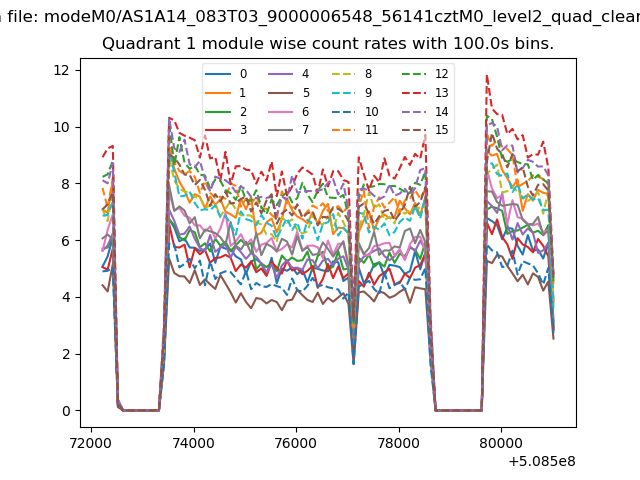
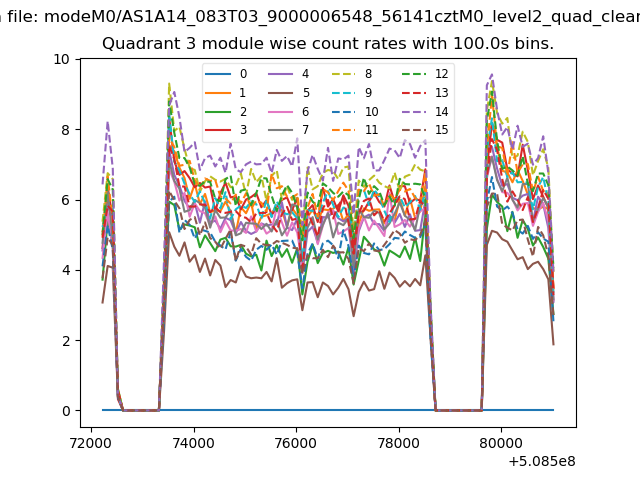
| Module-wise count rates for Quadrant A Data is divided into 100 sec bins |
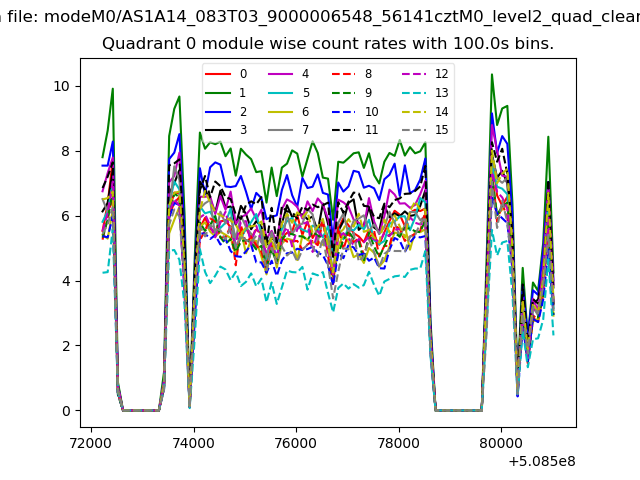 |
 |
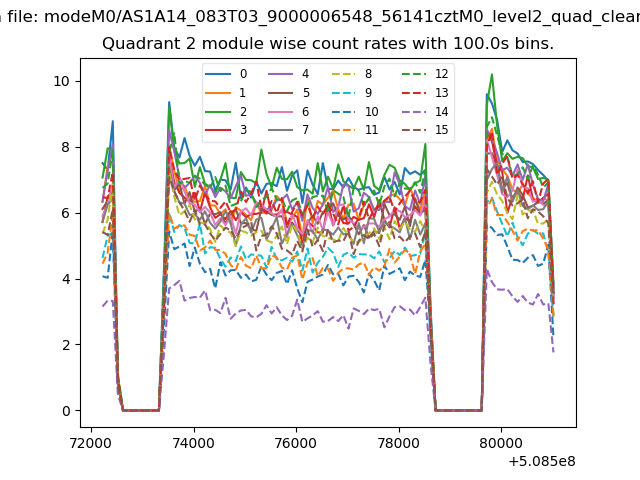
| Module-wise count rates for Quadrant B Data is divided into 100 sec bins |
 |
 |
| Module-wise count rates for Quadrant C Data is divided into 100 sec bins |
 |
 |
| Module-wise count rates for Quadrant D Data is divided into 100 sec bins |
 |
 |
| Parameter | Plot |
|---|---|
| CZT HV Monitor | 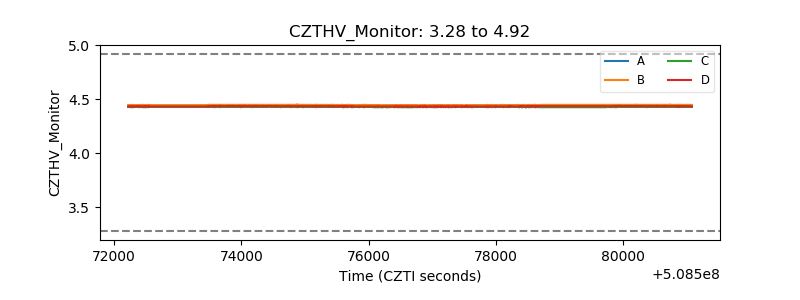 |
| D_VDD | 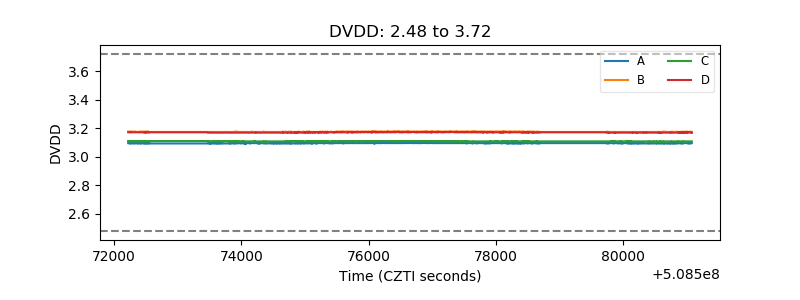 |
| Temperature 1 | 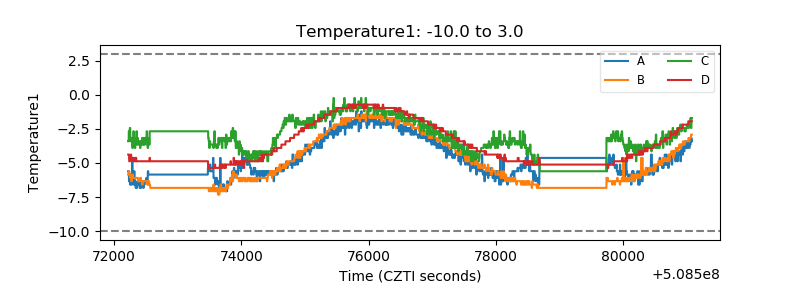 |
| Veto HV Monitor | 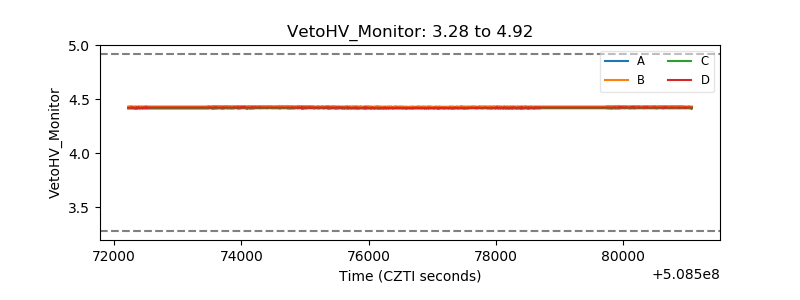 |
| Veto LLD | 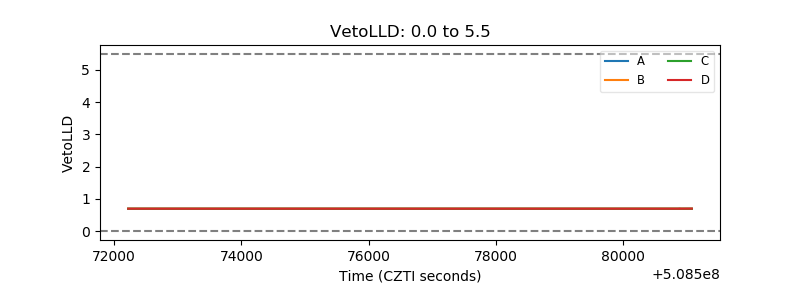 |
| Alpha Counter | 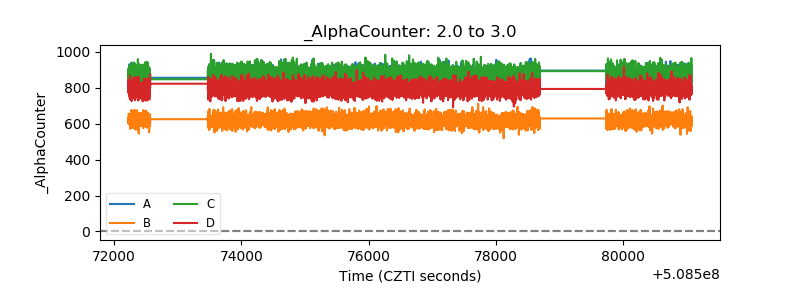 |
| _CPM_Rate | 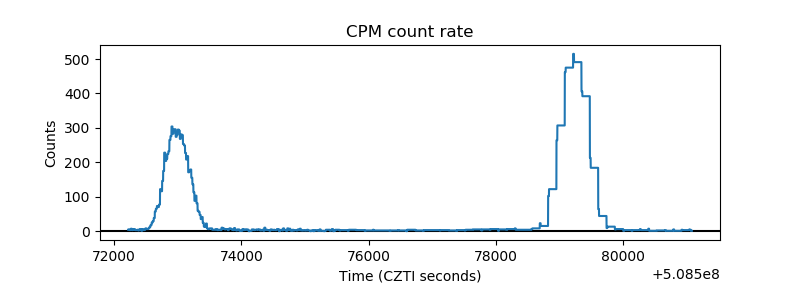 |
| CZT Counter | 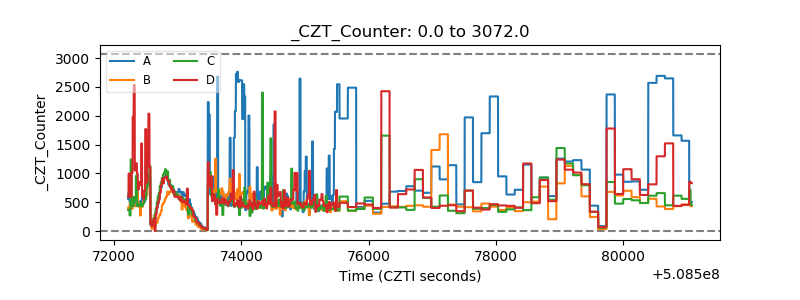 |
| +2.5 Volts monitor | 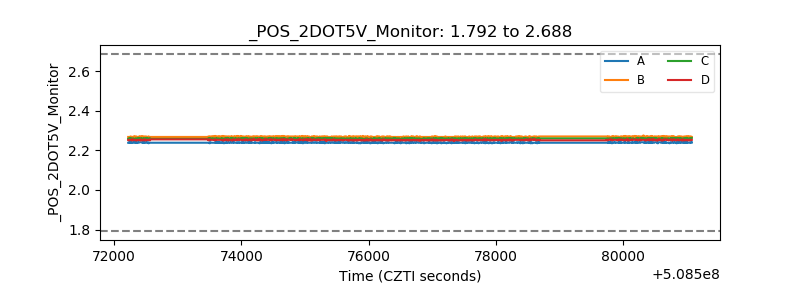 |
| +5 Volts monitor | 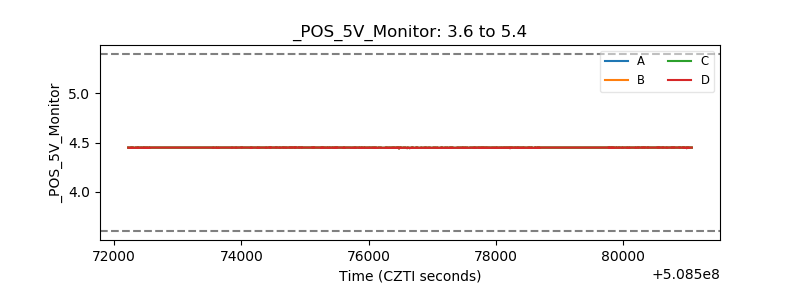 |
| _ROLL_ROT | 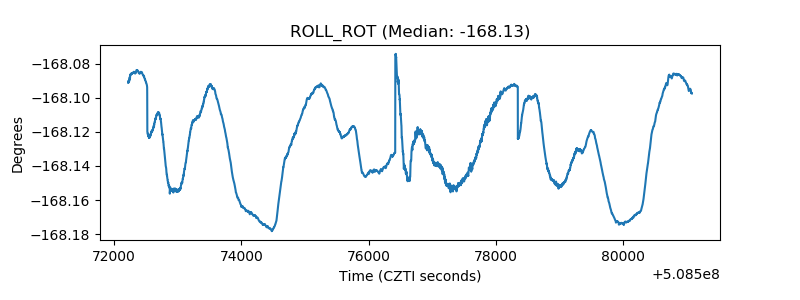 |
| _Roll_DEC | 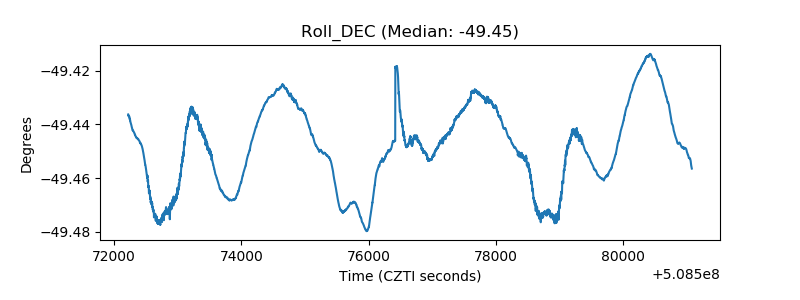 |
| _Roll_RA | 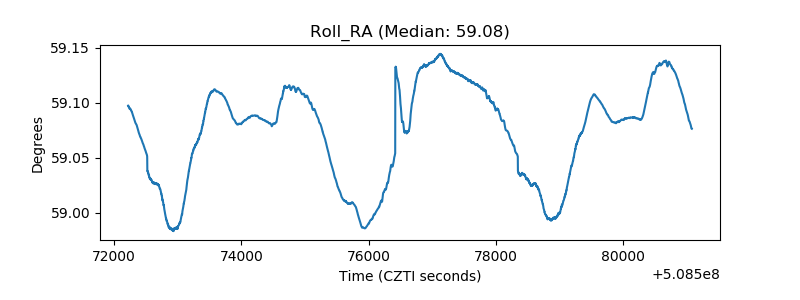 |
| Veto Counter | 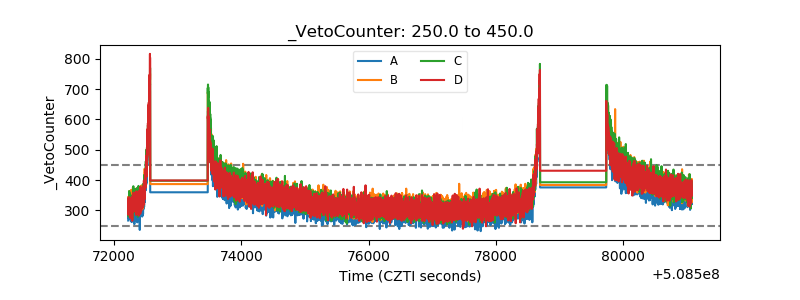 |