| Param | Original file | Final file |
|---|---|---|
| Filename | modeM0/AS1A14_083T03_9000006548_56144cztM0_level2.fits | modeM0/AS1A14_083T03_9000006548_56144cztM0_level2_quad_clean.evt |
| Size (bytes) | 750,352,320 | 82,347,840 |
| Size | 715.6 MB | 78.5 MB |
| Events in quadrant A | 9,569,356 | 398,130 |
| Events in quadrant B | 3,687,203 | 686,301 |
| Events in quadrant C | 4,149,140 | 603,606 |
| Events in quadrant D | 9,865,409 | 351,346 |
| Mode M0 | |||
|---|---|---|---|
| Quadrant | BADHDUFLAG | Total packets | Discarded packets |
| A | 0 | 32838 | 1 |
| B | 0 | 15588 | 1 |
| C | 0 | 17024 | 1 |
| D | 0 | 33803 | 2 |
| Mode SS | |||
|---|---|---|---|
| Quadrant | BADHDUFLAG | Total packets | Discarded packets |
| A | 0 | 132 | 0 |
| B | 0 | 132 | 0 |
| C | 0 | 132 | 0 |
| D | 0 | 132 | 0 |
| Mode M9 | |||
|---|---|---|---|
| Quadrant | BADHDUFLAG | Total packets | Discarded packets |
| A | 0 | 11 | 0 |
| B | 0 | 11 | 0 |
| C | 0 | 11 | 0 |
| D | 0 | 11 | 0 |
| Quadrant | Total seconds | Saturated seconds | Saturation percentage |
|---|---|---|---|
| A | 6509 | 2640 | 40.559226% |
| B | 6509 | 247 | 3.794746% |
| C | 6509 | 256 | 3.933016% |
| D | 6509 | 2756 | 42.341373% |
Noise dominated data is calculated using 1-second bins in cleaned event files. If a bin has >2000 counts, and if more than 50% of those come from <1% of pixels, then it is considered to be noise-dominated and hence unusable.
| Quadrant | # 1 sec bins | Bins with >0 counts | Bins with >2000 counts | High rate bins dominated by noise | Noise dominated (total time) | Noise dominated (detector-on time) | Marked lightcurve |
|---|---|---|---|---|---|---|---|
| A | 7614 | 6509 | 2558 | 2558 | 33.60% | 39.30% | 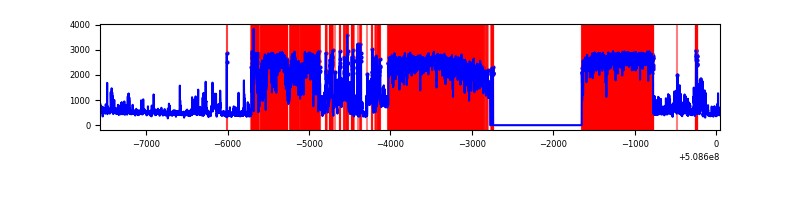 |
| B | 7614 | 6509 | 77 | 77 | 1.01% | 1.18% | 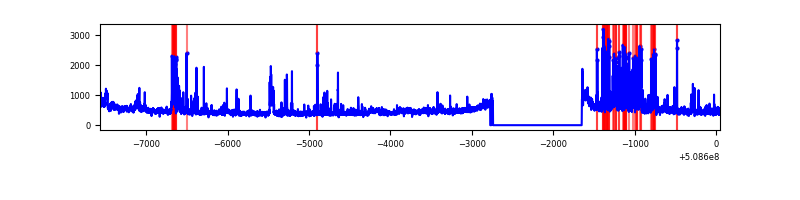 |
| C | 7614 | 6510 | 238 | 238 | 3.13% | 3.66% | 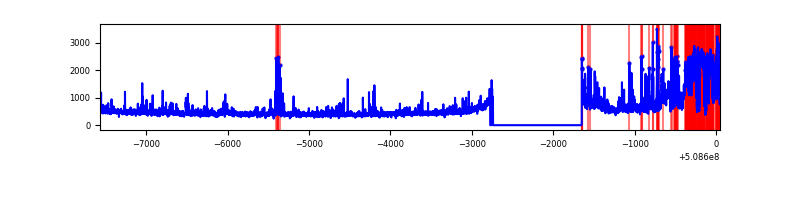 |
| D | 7614 | 6509 | 2676 | 2676 | 35.15% | 41.11% | 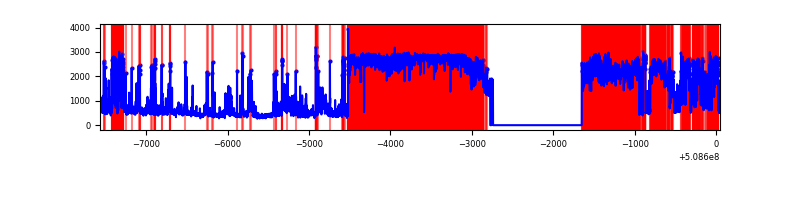 |
Top three noisy pixels from each quadrant. If the there are fewer than three noisy pixels in the level2.evt file, extra rows are filled as -1
| Pixel properties | Quadrant properties | ||||||
|---|---|---|---|---|---|---|---|
| Quadrant | DetID | PixID | Counts | Sigma | Mean | Median | Sigma |
| A | 12 | 115 | 5818681 | 40166.24 | 581 | 567 | 144.9 |
| A | 3 | 14 | 666924 | 4600.3 | 581 | 567 | 144.9 |
| A | 15 | 32 | 344479 | 2374.25 | 581 | 567 | 144.9 |
| B | 5 | 185 | 441518 | 2950.41 | 705 | 682 | 149.4 |
| B | 5 | 172 | 166400 | 1109.11 | 705 | 682 | 149.4 |
| B | 0 | 171 | 63188 | 418.34 | 705 | 682 | 149.4 |
| C | 9 | 38 | 987114 | 5303.08 | 681 | 676 | 186.0 |
| C | 1 | 16 | 138823 | 742.68 | 681 | 676 | 186.0 |
| C | 12 | 254 | 82218 | 438.37 | 681 | 676 | 186.0 |
| D | 2 | 62 | 5876074 | 38125.63 | 538 | 514 | 154.1 |
| D | 11 | 129 | 701484 | 4548.49 | 538 | 514 | 154.1 |
| D | 2 | 249 | 463175 | 3002.14 | 538 | 514 | 154.1 |
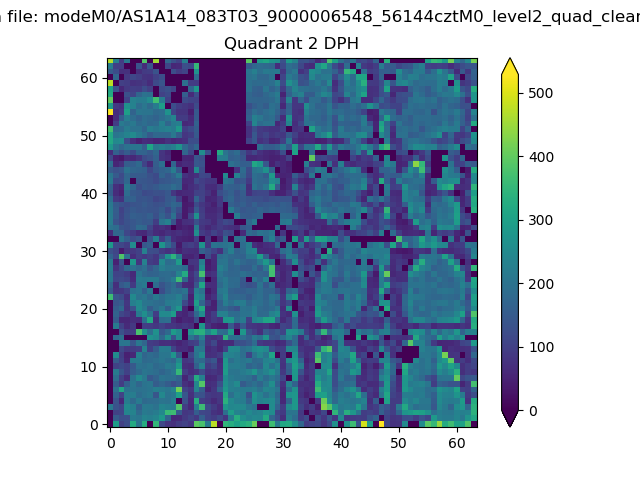
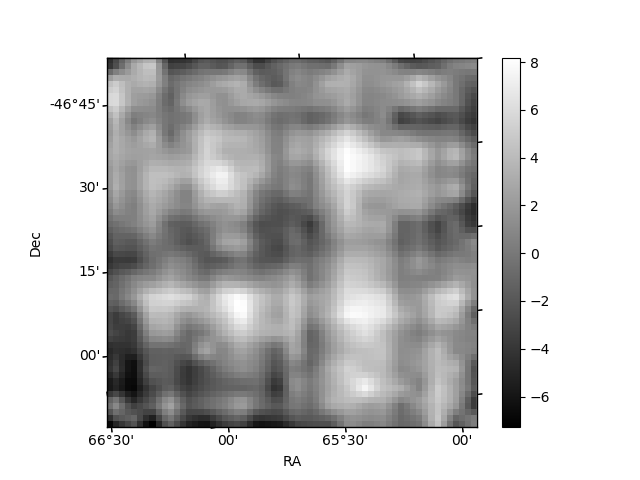
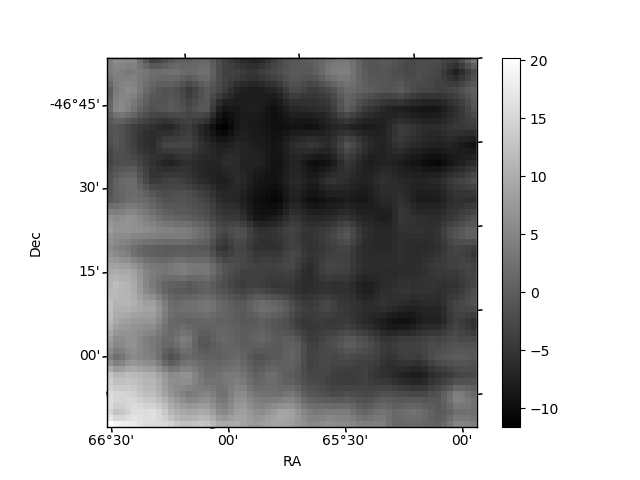
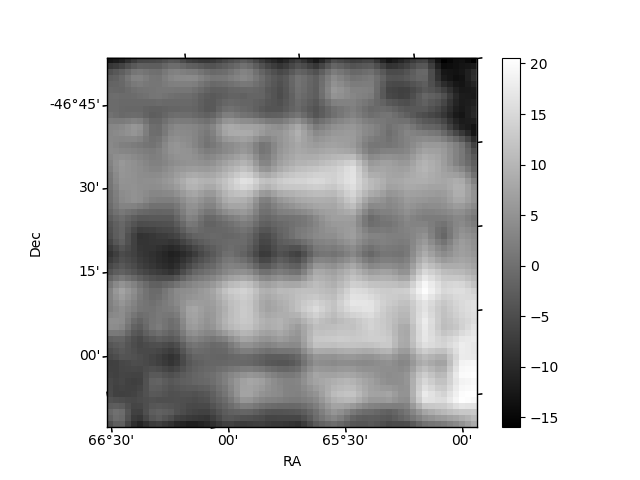
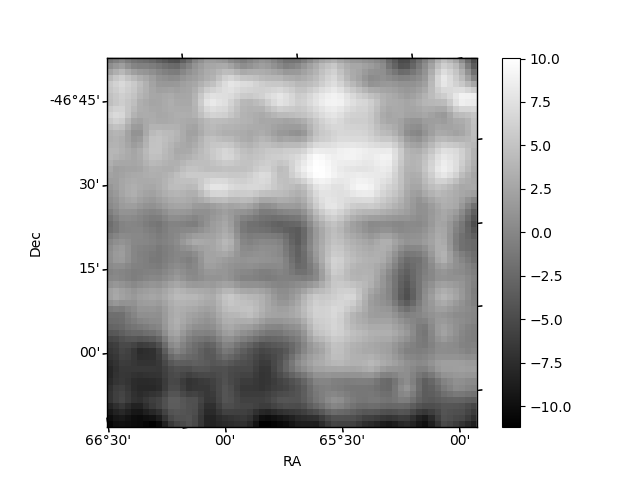
Histogram calculated using DETX and DETY for each event in the final _common_clean file
| Quadrant A | 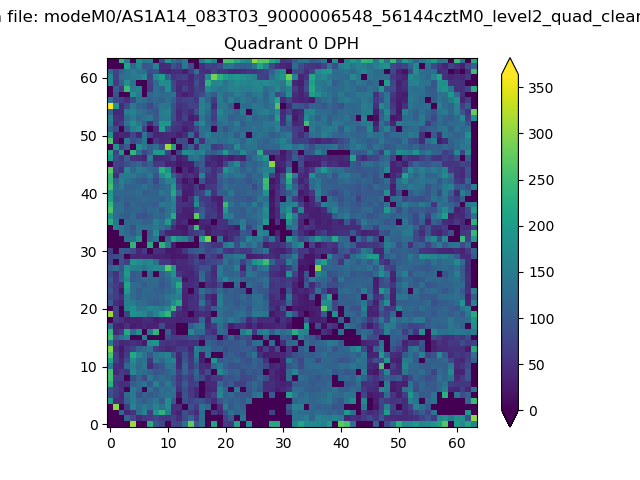 |
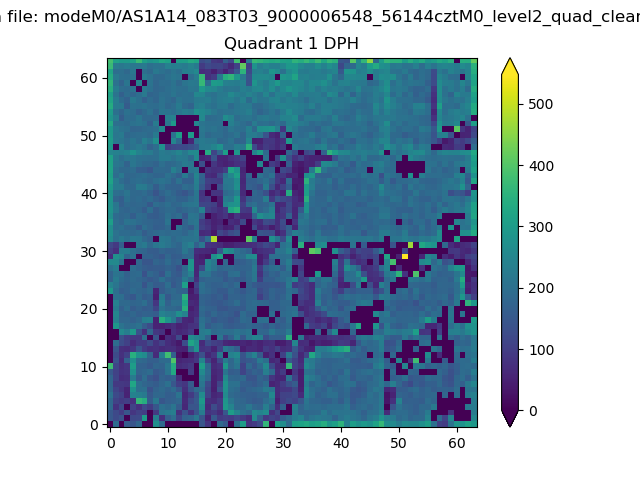 |
Quadrant B |
|---|---|---|---|
| Quadrant D | 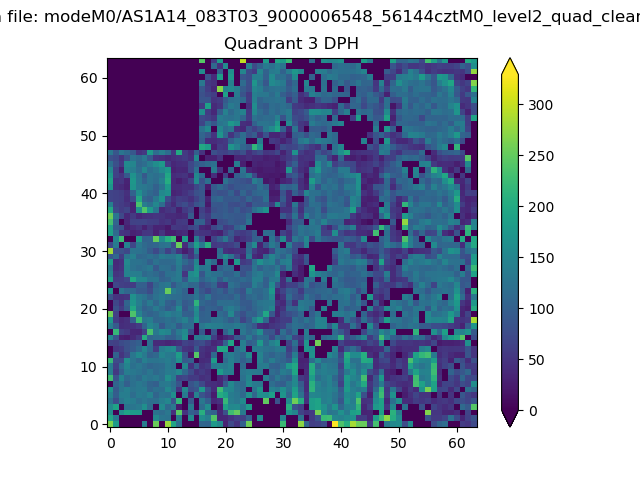 |
 |
Quadrant C |
| Plot type | Count rate plots | Images |
|---|---|---|
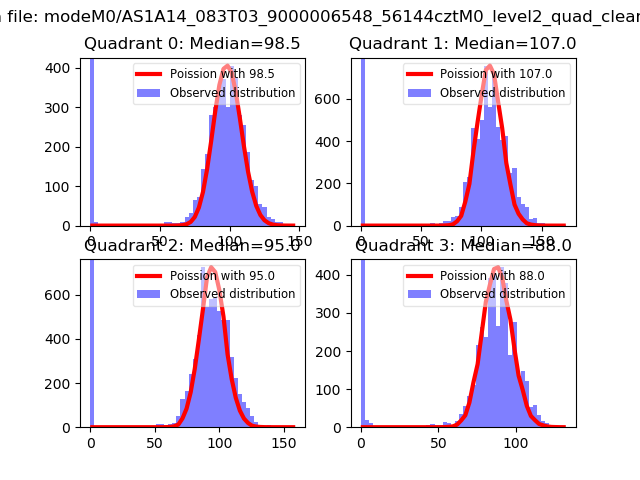
| Comparison with Poisson distribution Blue bars denote a histogram of data divided into 1 sec bins. Red curve is a Poisson curve with rate = median count rate of data. |
 |
 |
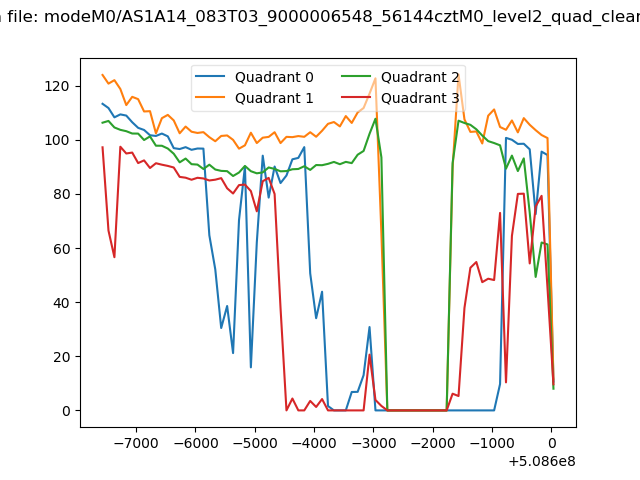
| Quadrant-wise count rates Data is divided into 100 sec bins |
 |
|
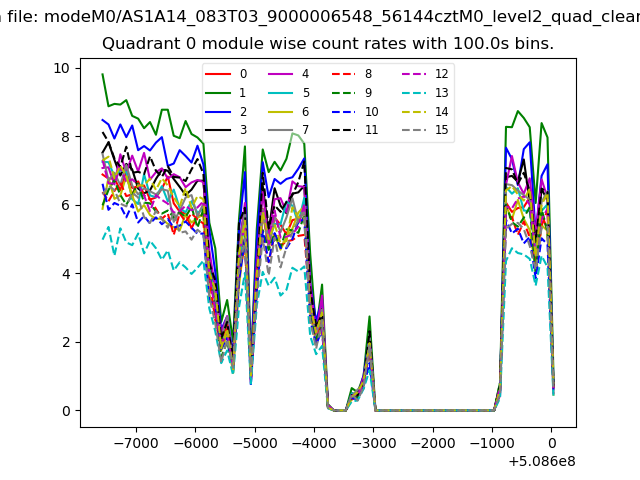
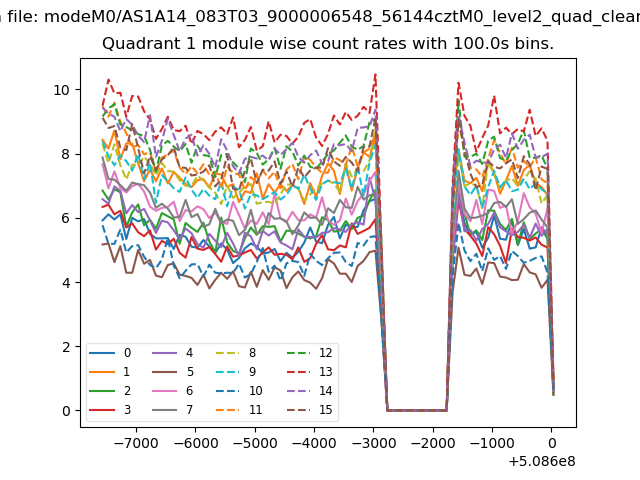
| Module-wise count rates for Quadrant A Data is divided into 100 sec bins |
 |
 |
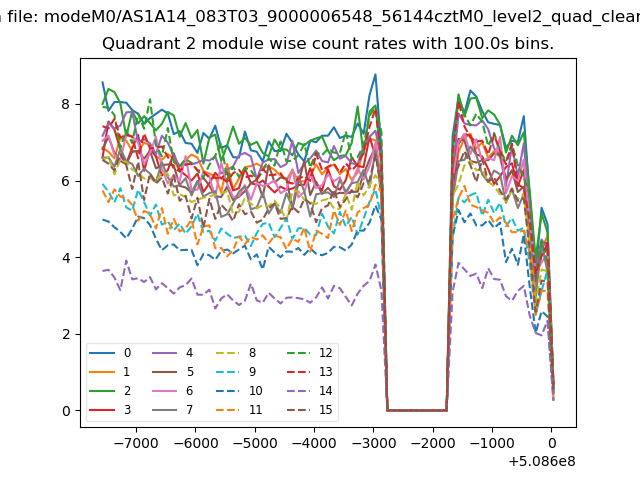
| Module-wise count rates for Quadrant B Data is divided into 100 sec bins |
 |
 |
| Module-wise count rates for Quadrant C Data is divided into 100 sec bins |
 |
 |
| Module-wise count rates for Quadrant D Data is divided into 100 sec bins |
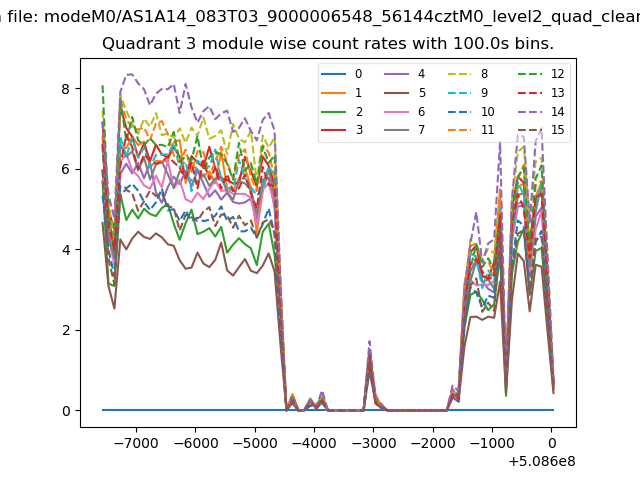 |
 |
| Parameter | Plot |
|---|---|
| CZT HV Monitor | 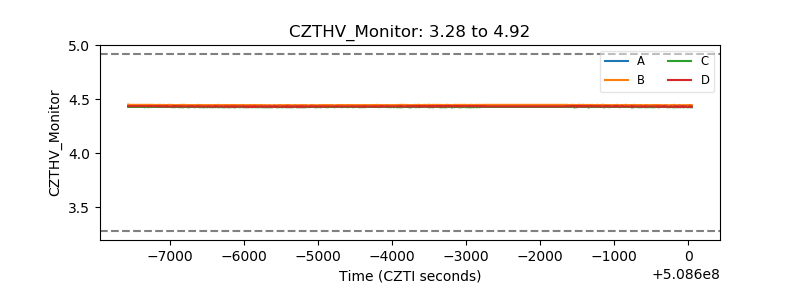 |
| D_VDD | 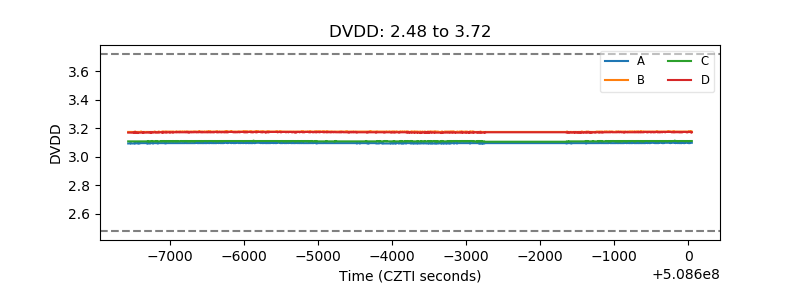 |
| Temperature 1 | 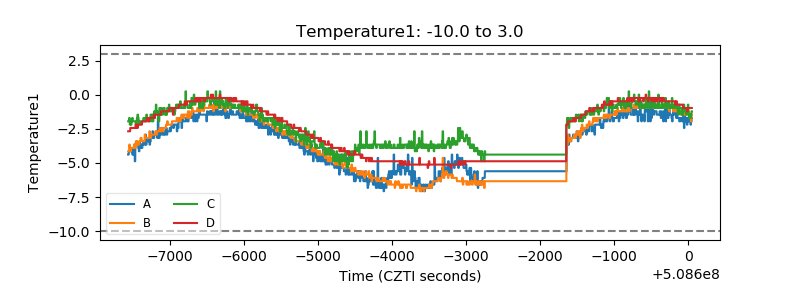 |
| Veto HV Monitor | 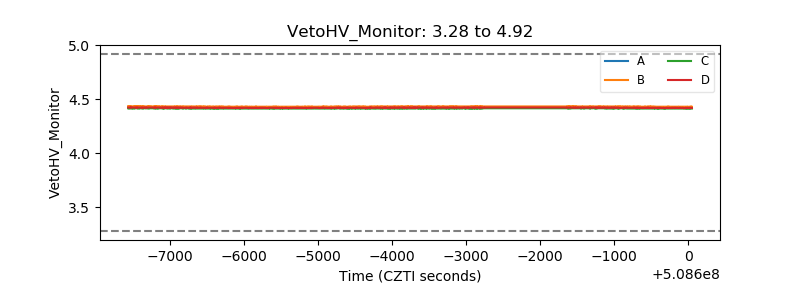 |
| Veto LLD | 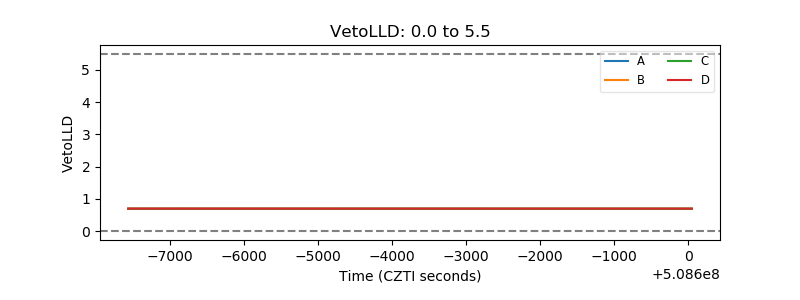 |
| Alpha Counter | 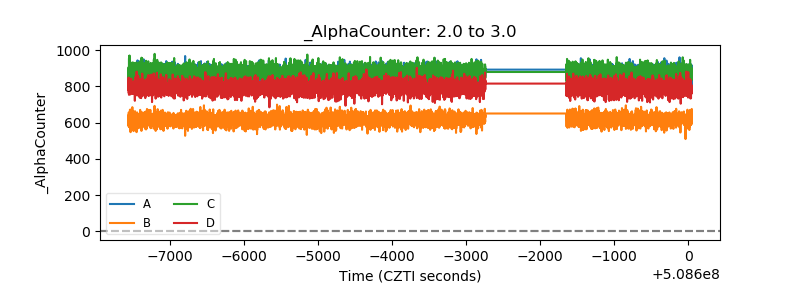 |
| _CPM_Rate | 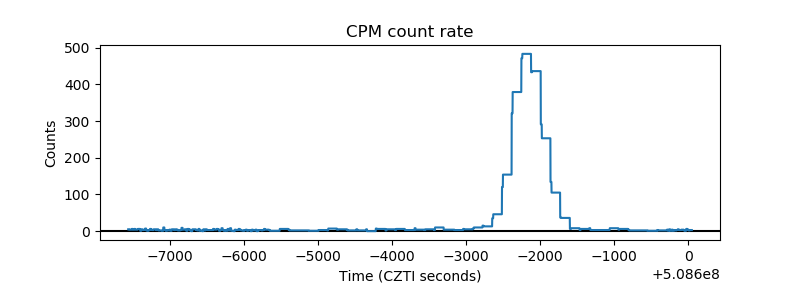 |
| CZT Counter | 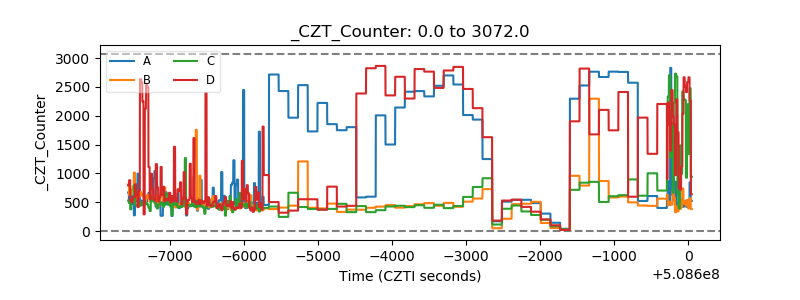 |
| +2.5 Volts monitor |  |
| +5 Volts monitor |  |
| _ROLL_ROT | 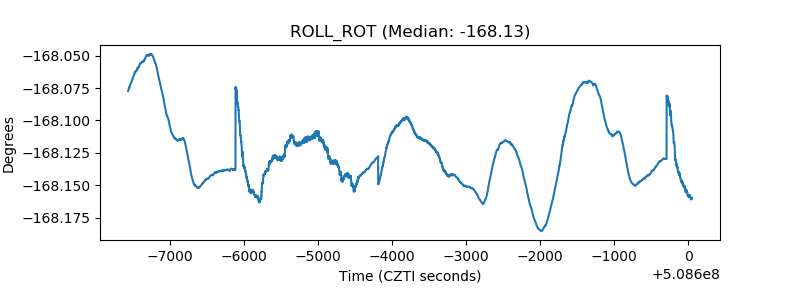 |
| _Roll_DEC | 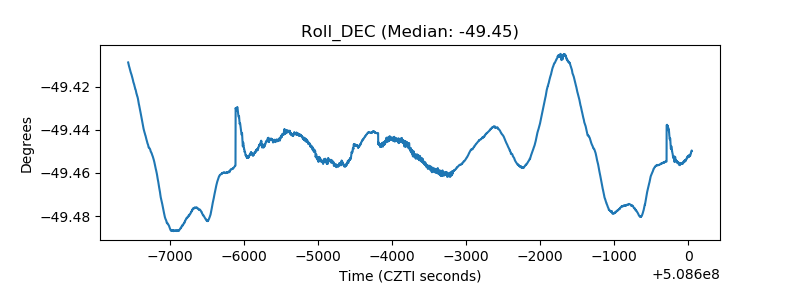 |
| _Roll_RA | 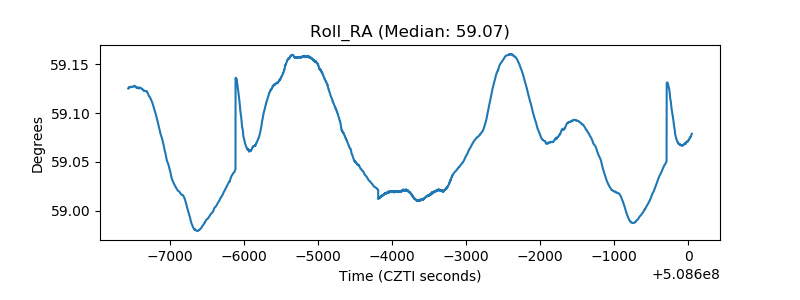 |
| Veto Counter | 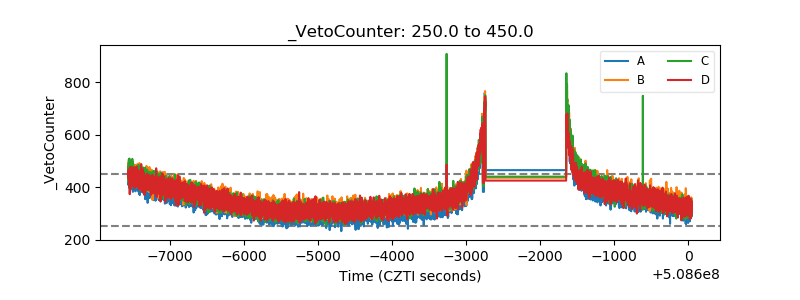 |