| Param | Original file | Final file |
|---|---|---|
| Filename | modeM0/AS1A14_083T03_9000006548_56145cztM0_level2.fits | modeM0/AS1A14_083T03_9000006548_56145cztM0_level2_quad_clean.evt |
| Size (bytes) | 171,440,640 | 21,168,000 |
| Size | 163.5 MB | 20.2 MB |
| Events in quadrant A | 941,643 | 143,846 |
| Events in quadrant B | 756,972 | 156,942 |
| Events in quadrant C | 2,217,640 | 118,501 |
| Events in quadrant D | 2,307,491 | 107,467 |
| Mode M0 | |||
|---|---|---|---|
| Quadrant | BADHDUFLAG | Total packets | Discarded packets |
| A | 0 | 3872 | 0 |
| B | 0 | 3372 | 0 |
| C | 0 | 7669 | 0 |
| D | 0 | 7934 | 0 |
| Mode SS | |||
|---|---|---|---|
| Quadrant | BADHDUFLAG | Total packets | Discarded packets |
| A | 0 | 30 | 0 |
| B | 0 | 30 | 0 |
| C | 0 | 30 | 0 |
| D | 0 | 30 | 0 |
| Quadrant | Total seconds | Saturated seconds | Saturation percentage |
|---|---|---|---|
| A | 1547 | 36 | 2.327085% |
| B | 1548 | 14 | 0.904393% |
| C | 1548 | 306 | 19.767442% |
| D | 1548 | 360 | 23.255814% |
Noise dominated data is calculated using 1-second bins in cleaned event files. If a bin has >2000 counts, and if more than 50% of those come from <1% of pixels, then it is considered to be noise-dominated and hence unusable.
| Quadrant | # 1 sec bins | Bins with >0 counts | Bins with >2000 counts | High rate bins dominated by noise | Noise dominated (total time) | Noise dominated (detector-on time) | Marked lightcurve |
|---|---|---|---|---|---|---|---|
| A | 1547 | 1547 | 24 | 24 | 1.55% | 1.55% | 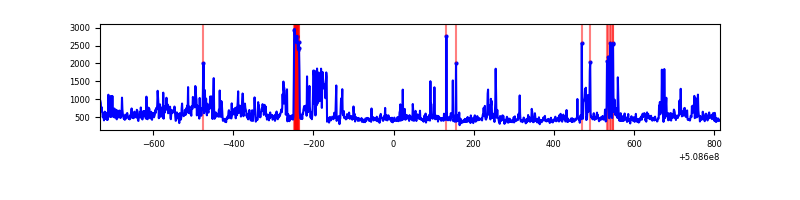 |
| B | 1548 | 1548 | 9 | 9 | 0.58% | 0.58% | 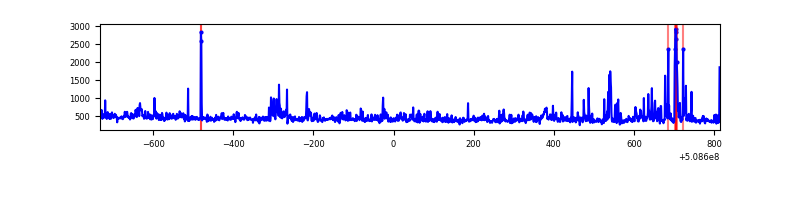 |
| C | 1548 | 1548 | 391 | 391 | 25.26% | 25.26% | 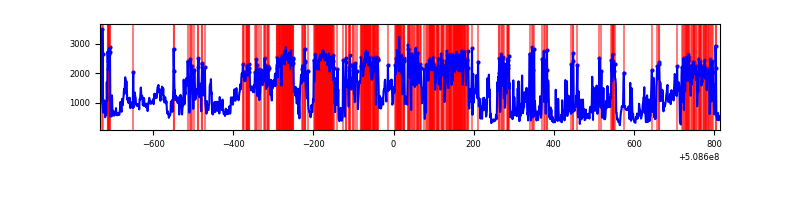 |
| D | 1548 | 1548 | 445 | 445 | 28.75% | 28.75% | 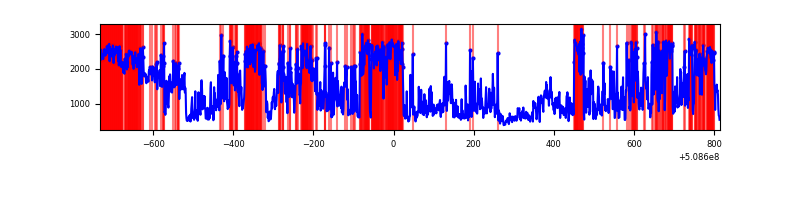 |
Top three noisy pixels from each quadrant. If the there are fewer than three noisy pixels in the level2.evt file, extra rows are filled as -1
| Pixel properties | Quadrant properties | ||||||
|---|---|---|---|---|---|---|---|
| Quadrant | DetID | PixID | Counts | Sigma | Mean | Median | Sigma |
| A | 3 | 14 | 95275 | 2362.46 | 153 | 149 | 40.3 |
| A | 15 | 32 | 71245 | 1765.67 | 153 | 149 | 40.3 |
| A | 8 | 249 | 54935 | 1360.61 | 153 | 149 | 40.3 |
| B | 4 | 171 | 41641 | 1176.57 | 153 | 149 | 35.3 |
| B | 10 | 247 | 35931 | 1014.65 | 153 | 149 | 35.3 |
| B | 0 | 213 | 35321 | 997.36 | 153 | 149 | 35.3 |
| C | 9 | 38 | 1469740 | 37277.27 | 137 | 136 | 39.4 |
| C | 12 | 254 | 64938 | 1643.74 | 137 | 136 | 39.4 |
| C | 1 | 16 | 41350 | 1045.41 | 137 | 136 | 39.4 |
| D | 2 | 62 | 718751 | 17941.29 | 134 | 127 | 40.1 |
| D | 11 | 129 | 537958 | 13427.58 | 134 | 127 | 40.1 |
| D | 2 | 249 | 379930 | 9482.23 | 134 | 127 | 40.1 |
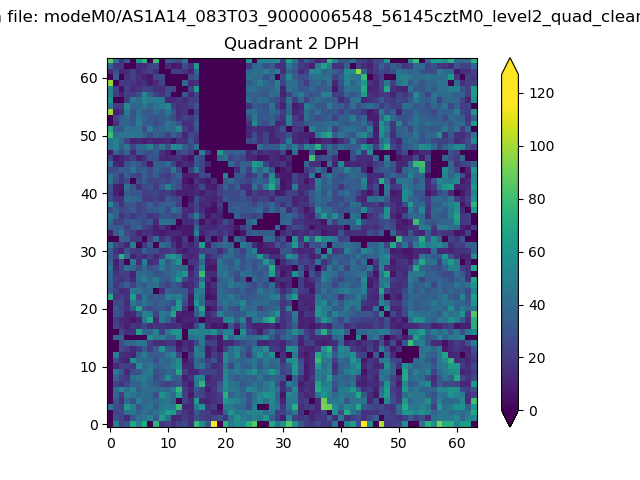
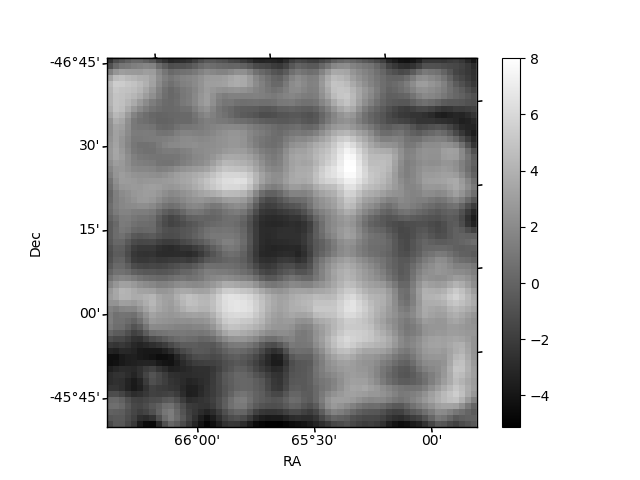
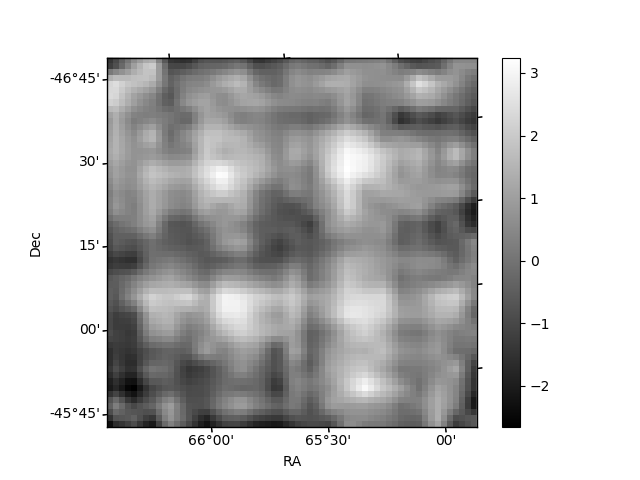
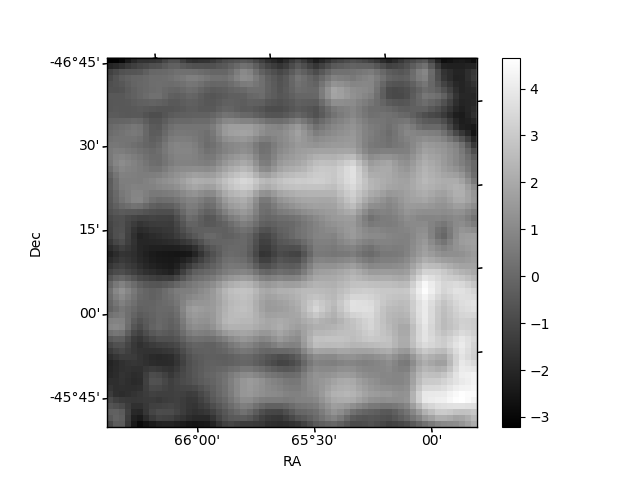
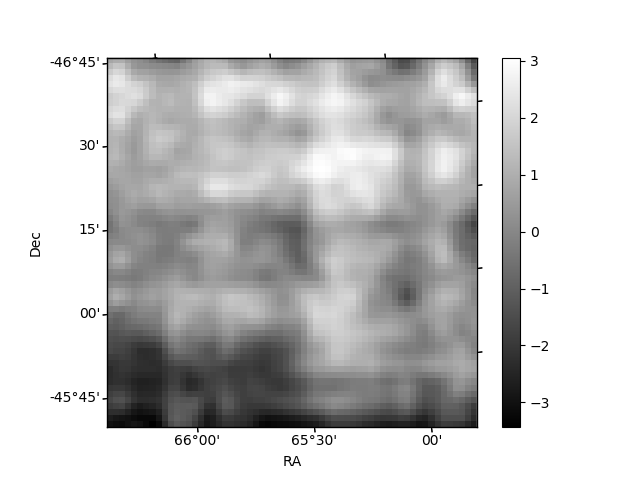
Histogram calculated using DETX and DETY for each event in the final _common_clean file
| Quadrant A | 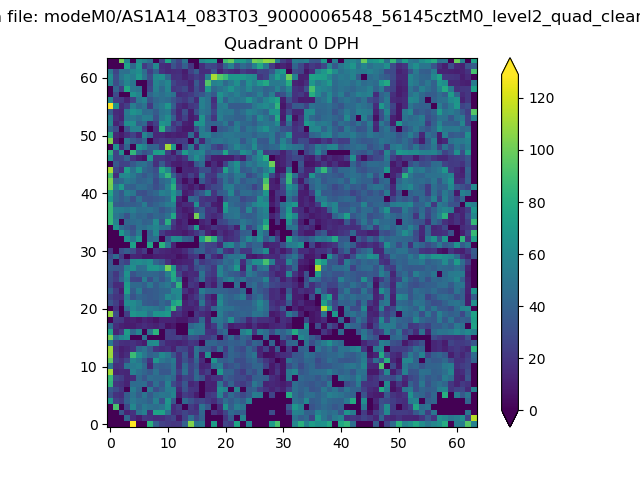 |
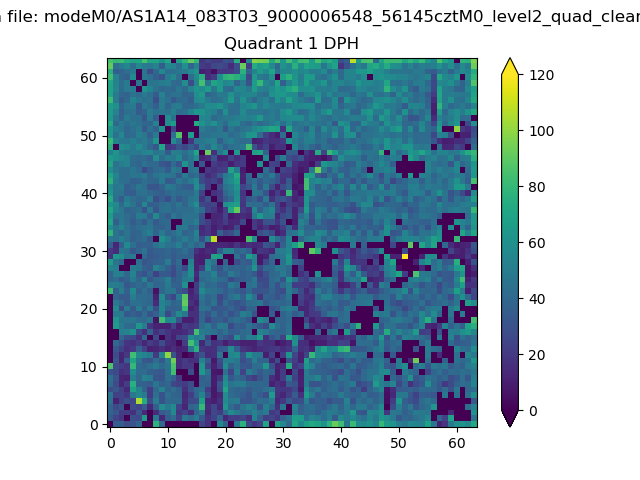 |
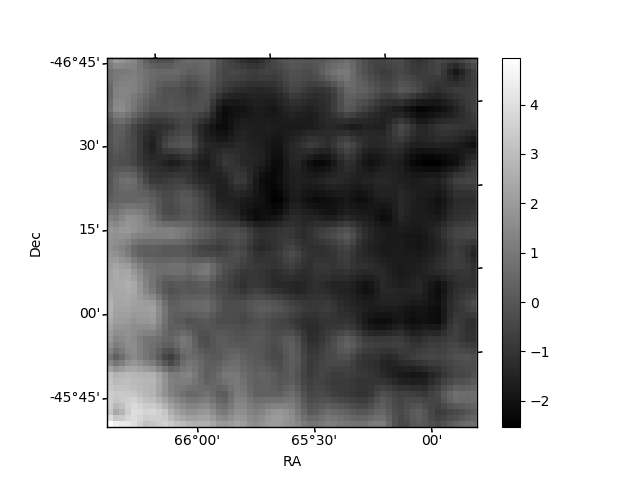
Quadrant B |
|---|---|---|---|
| Quadrant D | 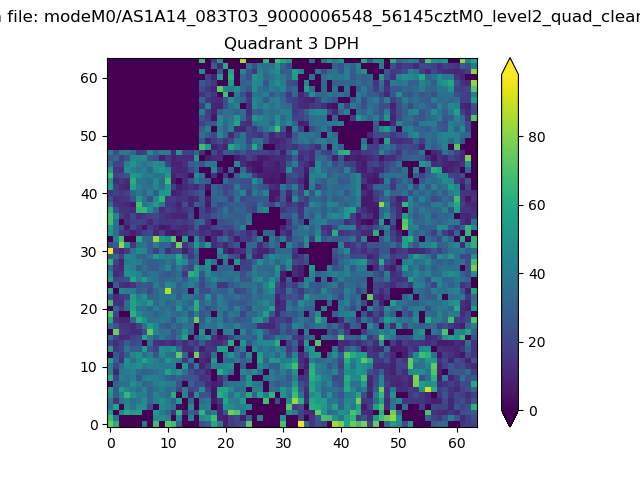 |
 |
Quadrant C |
| Plot type | Count rate plots | Images |
|---|---|---|
| Comparison with Poisson distribution Blue bars denote a histogram of data divided into 1 sec bins. Red curve is a Poisson curve with rate = median count rate of data. |
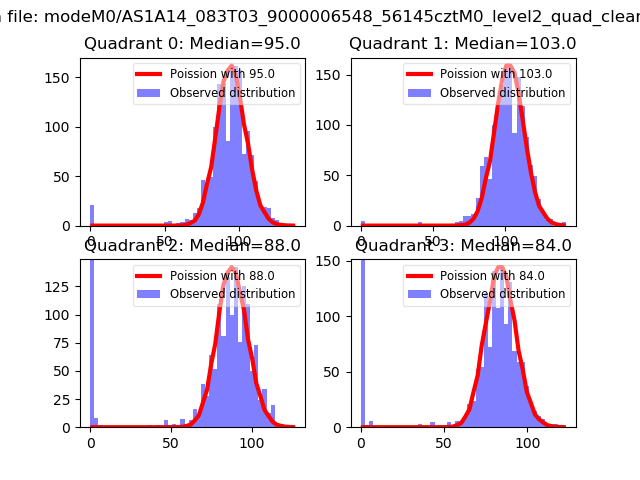 |
 |
| Quadrant-wise count rates Data is divided into 100 sec bins |
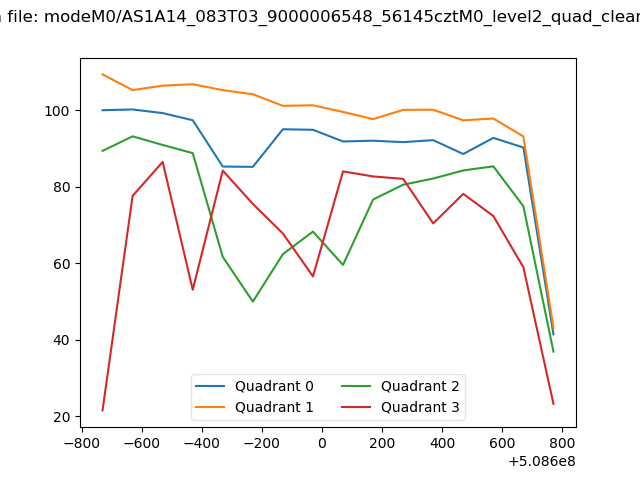 |
|
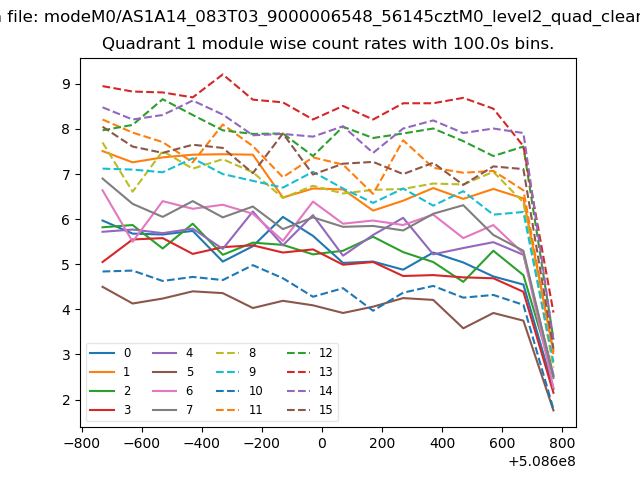
| Module-wise count rates for Quadrant A Data is divided into 100 sec bins |
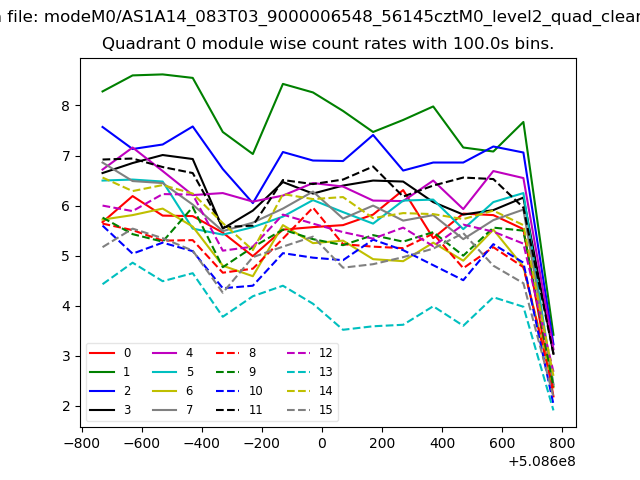 |
 |
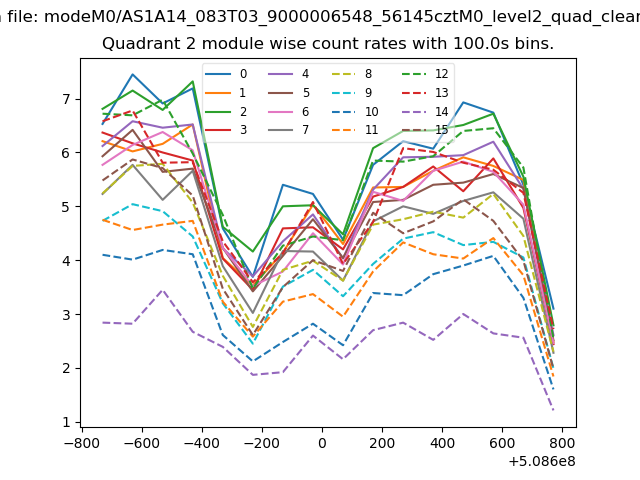
| Module-wise count rates for Quadrant B Data is divided into 100 sec bins |
 |
 |
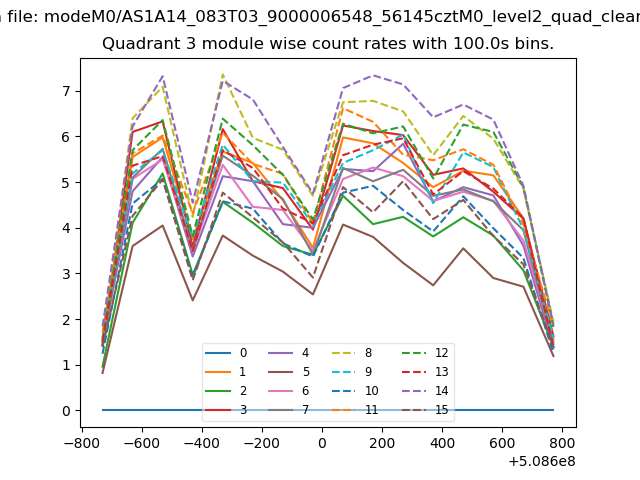
| Module-wise count rates for Quadrant C Data is divided into 100 sec bins |
 |
 |
| Module-wise count rates for Quadrant D Data is divided into 100 sec bins |
 |
 |
| Parameter | Plot |
|---|---|
| CZT HV Monitor | 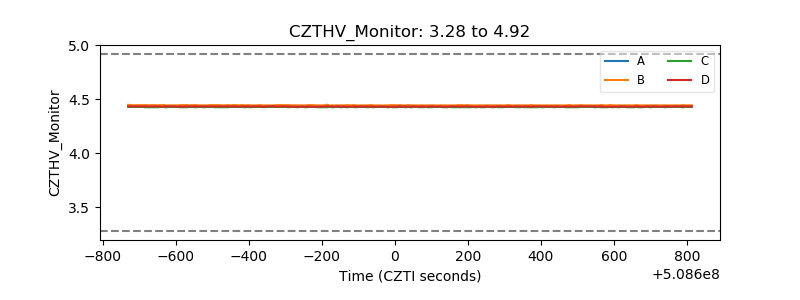 |
| D_VDD | 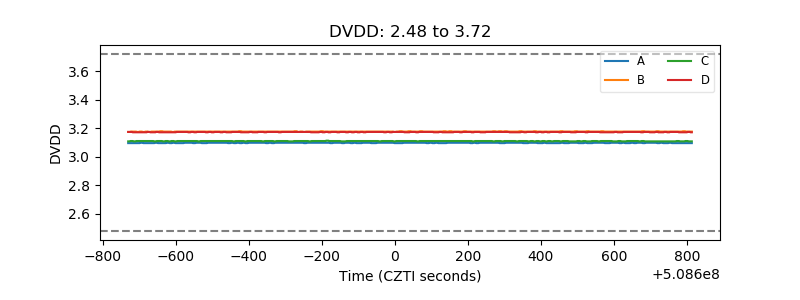 |
| Temperature 1 | 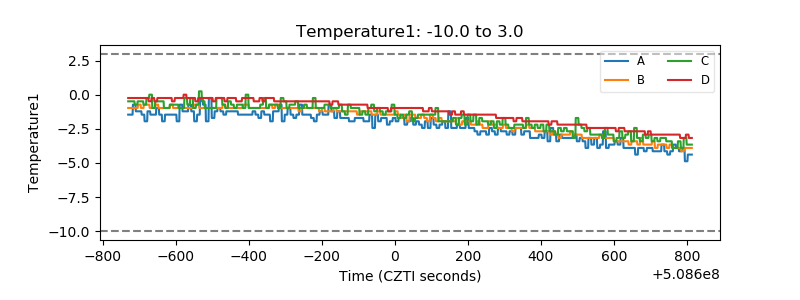 |
| Veto HV Monitor | 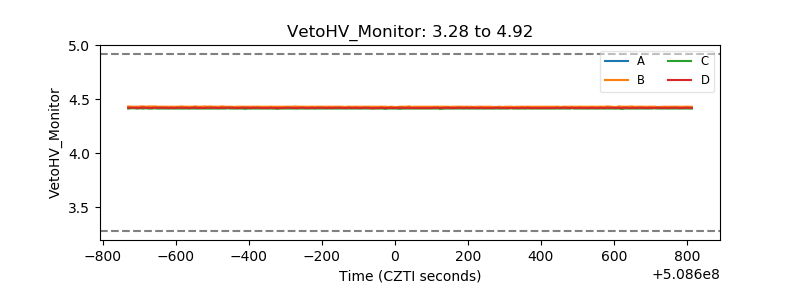 |
| Veto LLD | 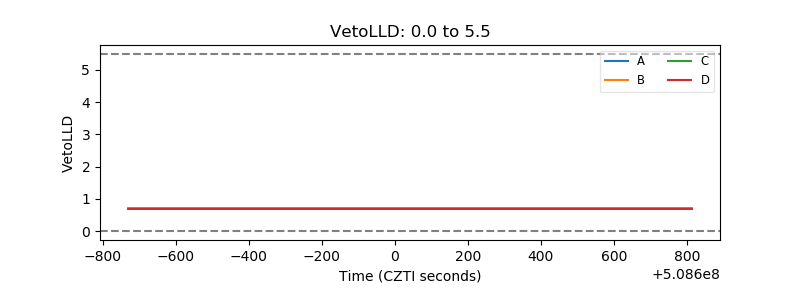 |
| Alpha Counter | 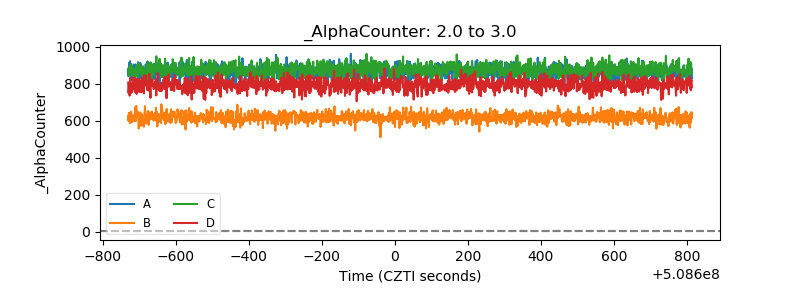 |
| _CPM_Rate | 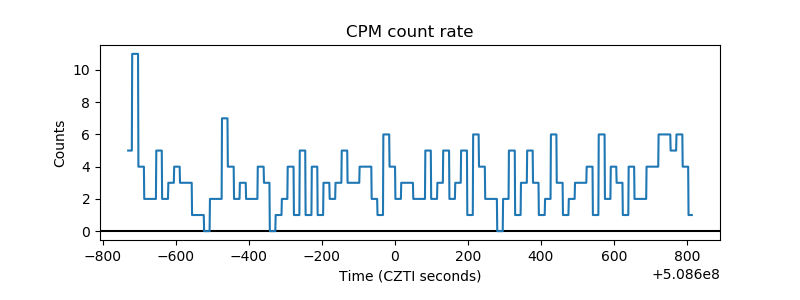 |
| CZT Counter | 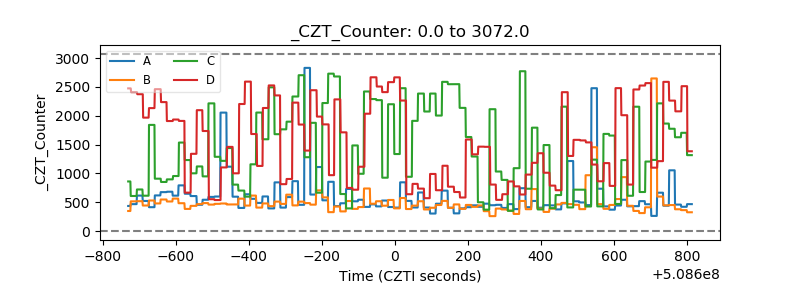 |
| +2.5 Volts monitor |  |
| +5 Volts monitor | 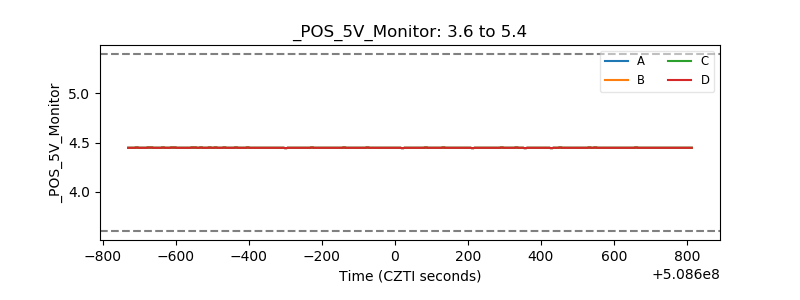 |
| _ROLL_ROT | 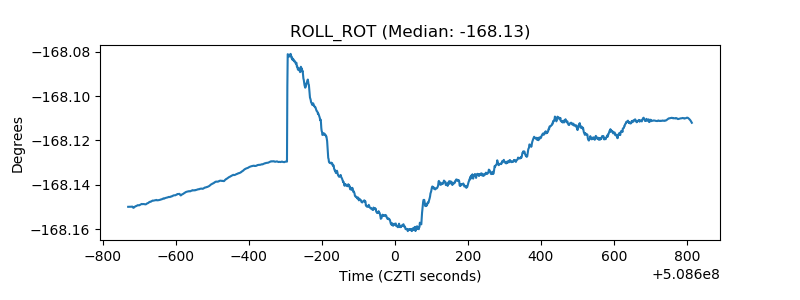 |
| _Roll_DEC | 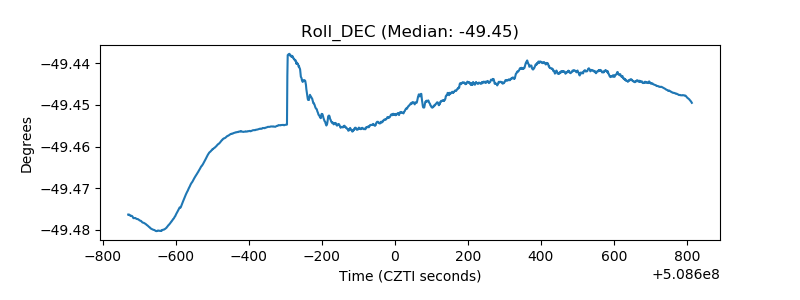 |
| _Roll_RA | 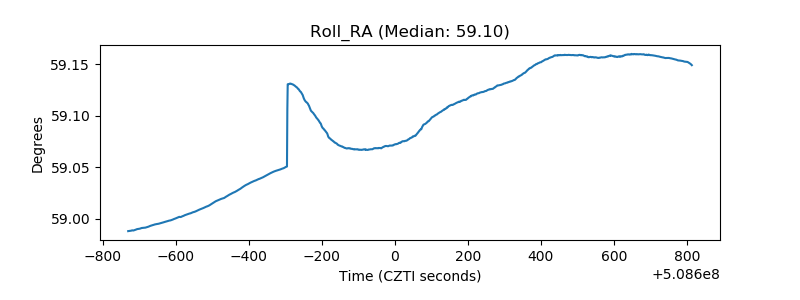 |
| Veto Counter | 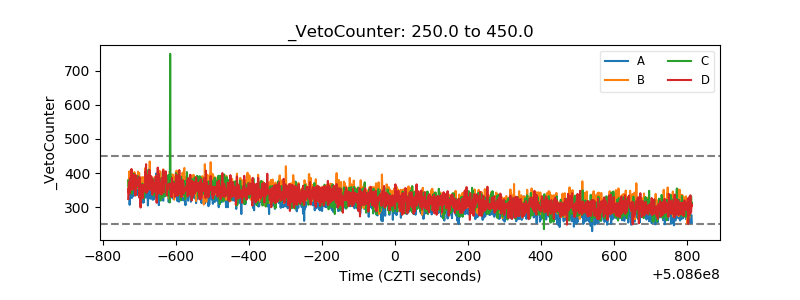 |