| Param | Original file | Final file |
|---|---|---|
| Filename | modeM0/AS1A14_083T04_9000006550_56146cztM0_level2.fits | modeM0/AS1A14_083T04_9000006550_56146cztM0_level2_quad_clean.evt |
| Size (bytes) | 758,082,240 | 87,215,040 |
| Size | 723.0 MB | 83.2 MB |
| Events in quadrant A | 5,091,844 | 626,397 |
| Events in quadrant B | 3,725,032 | 681,193 |
| Events in quadrant C | 12,818,396 | 327,252 |
| Events in quadrant D | 5,899,758 | 531,594 |
| Mode SS | |||
|---|---|---|---|
| Quadrant | BADHDUFLAG | Total packets | Discarded packets |
| A | 0 | 138 | 0 |
| B | 0 | 138 | 0 |
| C | 0 | 138 | 0 |
| D | 0 | 138 | 0 |
| Mode M9 | |||
|---|---|---|---|
| Quadrant | BADHDUFLAG | Total packets | Discarded packets |
| A | 0 | 7 | 0 |
| B | 0 | 7 | 0 |
| C | 0 | 7 | 0 |
| D | 0 | 7 | 0 |
| Mode M0 | |||
|---|---|---|---|
| Quadrant | BADHDUFLAG | Total packets | Discarded packets |
| A | 0 | 19756 | 1 |
| B | 0 | 15805 | 1 |
| C | 0 | 42756 | 1 |
| D | 0 | 22299 | 1 |
| Quadrant | Total seconds | Saturated seconds | Saturation percentage |
|---|---|---|---|
| A | 6799 | 307 | 4.515370% |
| B | 6799 | 216 | 3.176938% |
| C | 6800 | 3579 | 52.632353% |
| D | 6800 | 614 | 9.029412% |
Noise dominated data is calculated using 1-second bins in cleaned event files. If a bin has >2000 counts, and if more than 50% of those come from <1% of pixels, then it is considered to be noise-dominated and hence unusable.
| Quadrant | # 1 sec bins | Bins with >0 counts | Bins with >2000 counts | High rate bins dominated by noise | Noise dominated (total time) | Noise dominated (detector-on time) | Marked lightcurve |
|---|---|---|---|---|---|---|---|
| A | 7548 | 6798 | 268 | 268 | 3.55% | 3.94% | 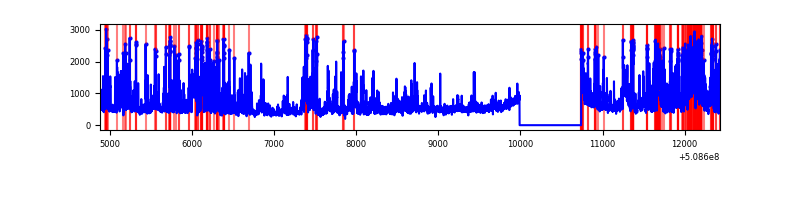 |
| B | 7548 | 6798 | 120 | 120 | 1.59% | 1.77% | 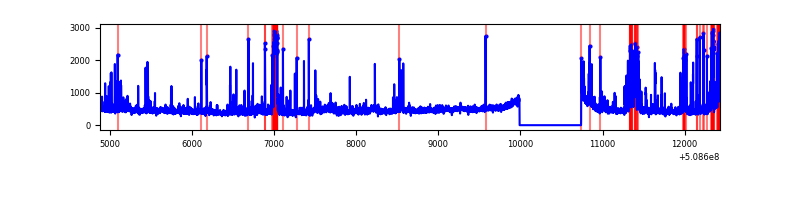 |
| C | 7550 | 6801 | 3607 | 3607 | 47.77% | 53.04% | 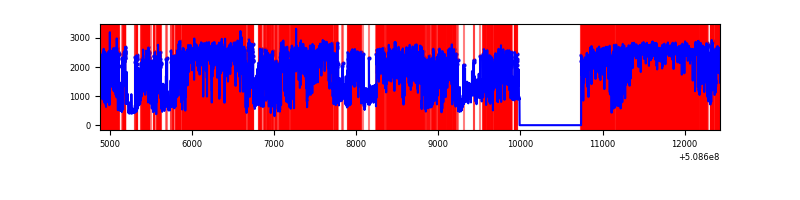 |
| D | 7550 | 6801 | 652 | 652 | 8.64% | 9.59% | 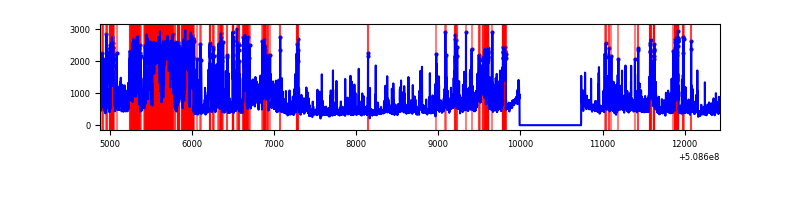 |
Top three noisy pixels from each quadrant. If the there are fewer than three noisy pixels in the level2.evt file, extra rows are filled as -1
| Pixel properties | Quadrant properties | ||||||
|---|---|---|---|---|---|---|---|
| Quadrant | DetID | PixID | Counts | Sigma | Mean | Median | Sigma |
| A | 7 | 64 | 1245891 | 7035.41 | 708 | 689 | 177.0 |
| A | 3 | 14 | 332241 | 1873.27 | 708 | 689 | 177.0 |
| A | 0 | 8 | 310317 | 1749.4 | 708 | 689 | 177.0 |
| B | 5 | 185 | 212373 | 1395.5 | 709 | 684 | 151.7 |
| B | 4 | 171 | 188161 | 1235.89 | 709 | 684 | 151.7 |
| B | 0 | 171 | 119029 | 780.16 | 709 | 684 | 151.7 |
| C | 9 | 38 | 8480489 | 57100.03 | 542 | 539 | 148.5 |
| C | 15 | 147 | 1029235 | 6926.76 | 542 | 539 | 148.5 |
| C | 15 | 148 | 707839 | 4762.63 | 542 | 539 | 148.5 |
| D | 11 | 129 | 1424436 | 7534.6 | 665 | 635 | 189.0 |
| D | 2 | 249 | 765237 | 4046.19 | 665 | 635 | 189.0 |
| D | 8 | 240 | 396458 | 2094.65 | 665 | 635 | 189.0 |
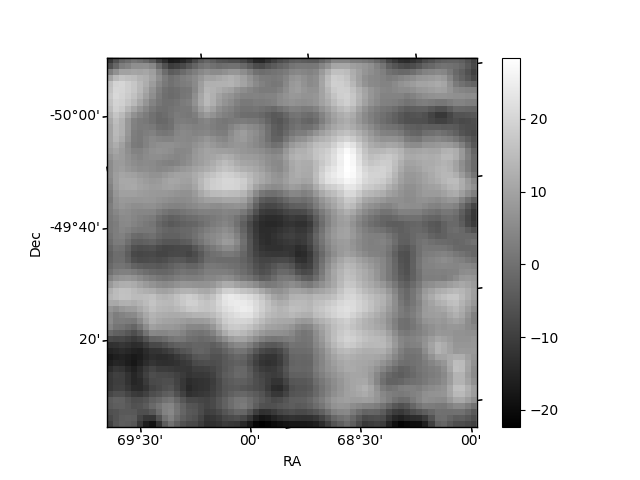
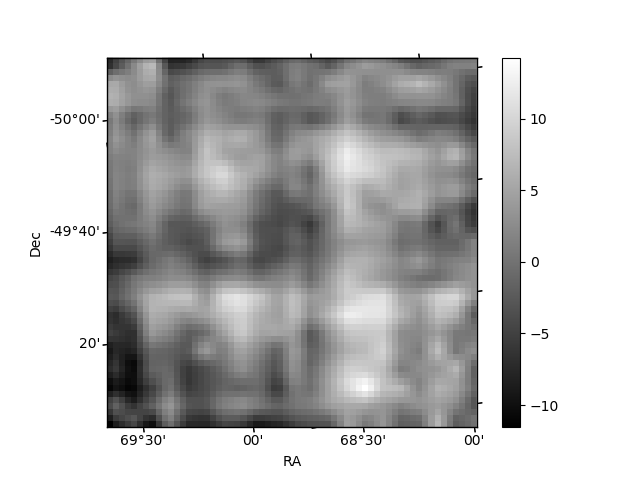
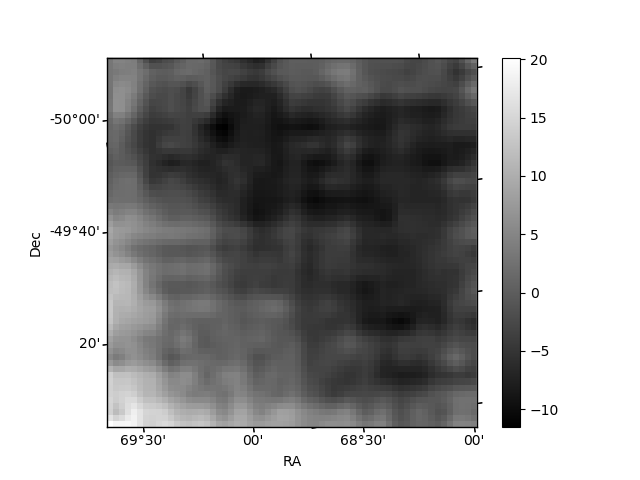
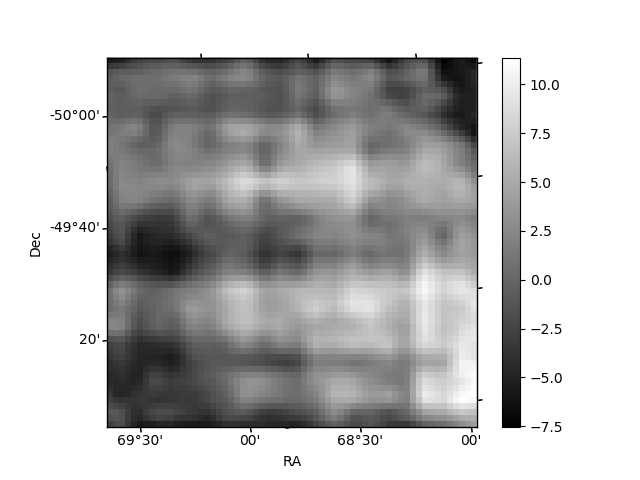
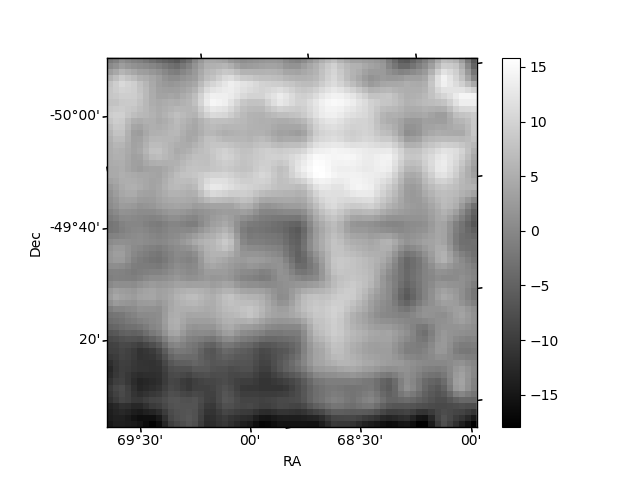
Histogram calculated using DETX and DETY for each event in the final _common_clean file
| Quadrant A | 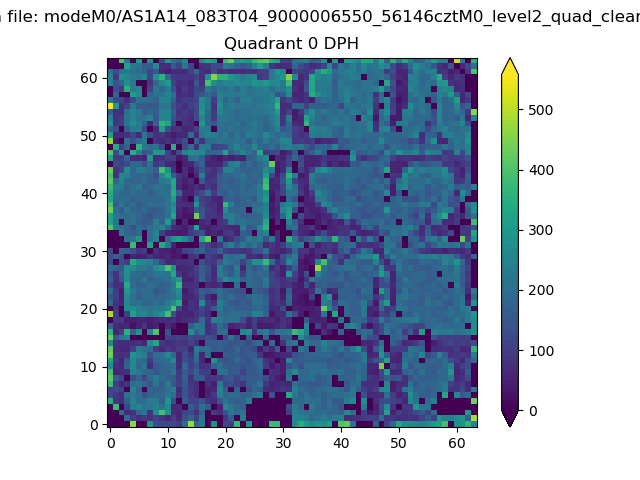 |
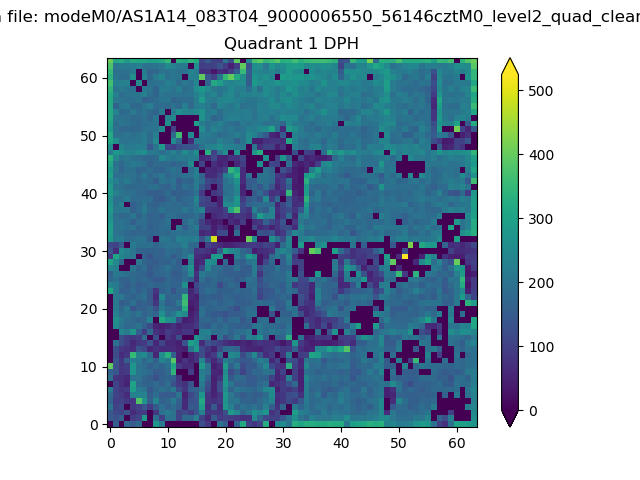 |
Quadrant B |
|---|---|---|---|
| Quadrant D | 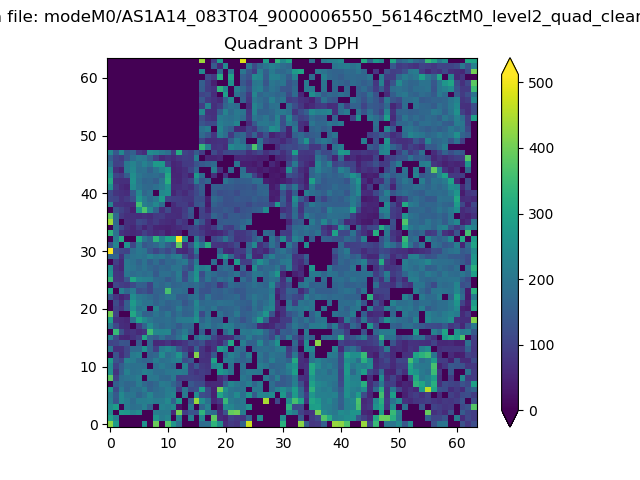 |
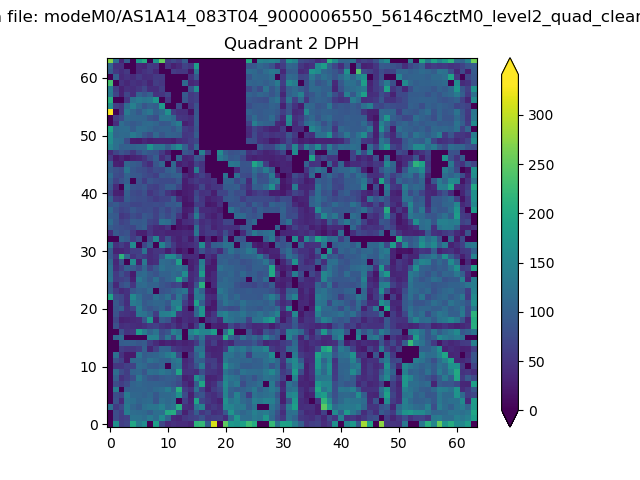 |
Quadrant C |
| Plot type | Count rate plots | Images |
|---|---|---|
| Comparison with Poisson distribution Blue bars denote a histogram of data divided into 1 sec bins. Red curve is a Poisson curve with rate = median count rate of data. |
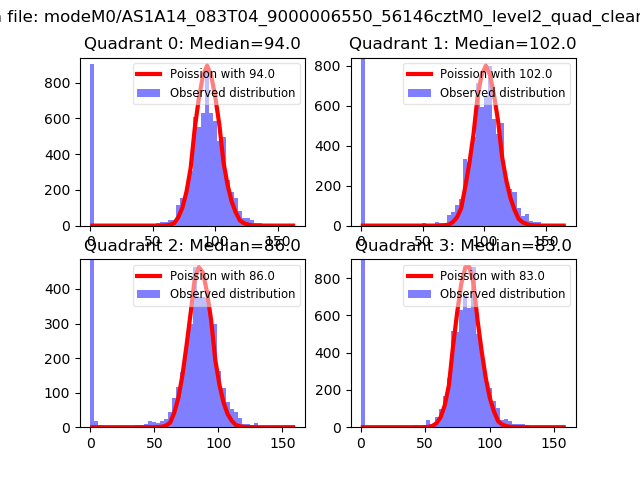 |
 |
| Quadrant-wise count rates Data is divided into 100 sec bins |
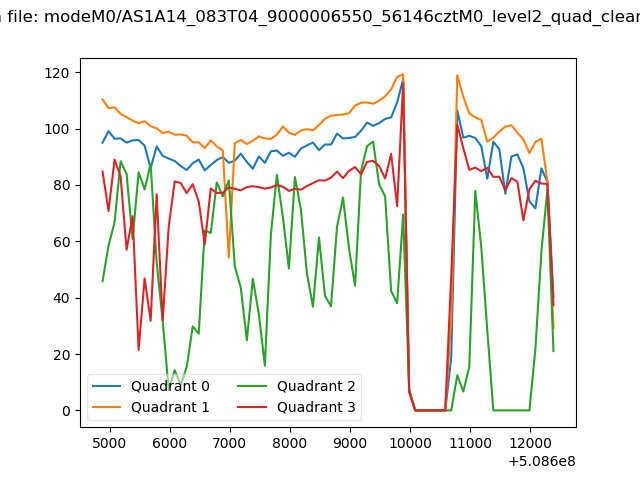 |
|
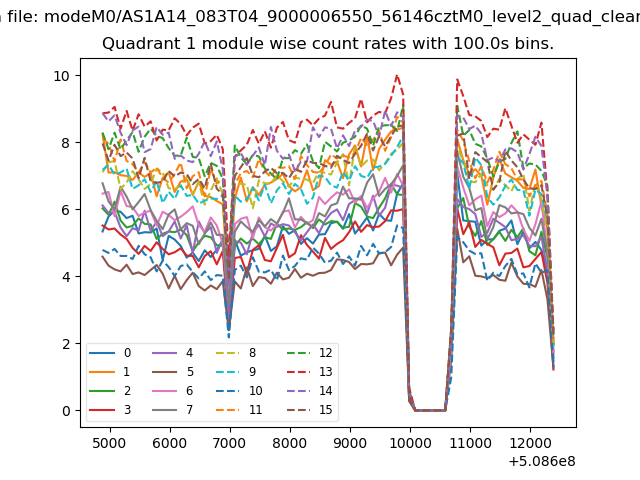
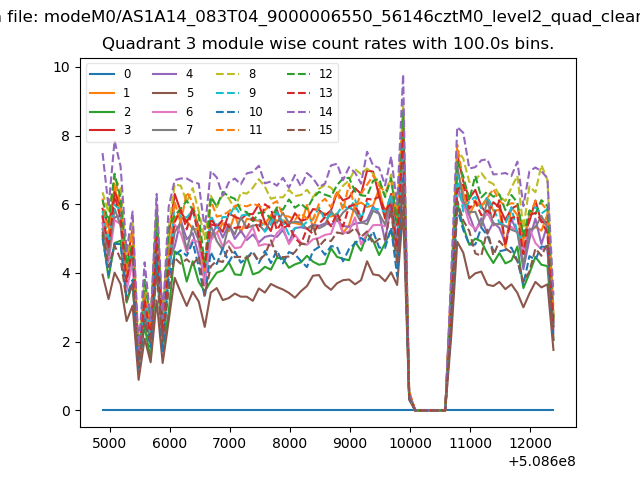
| Module-wise count rates for Quadrant A Data is divided into 100 sec bins |
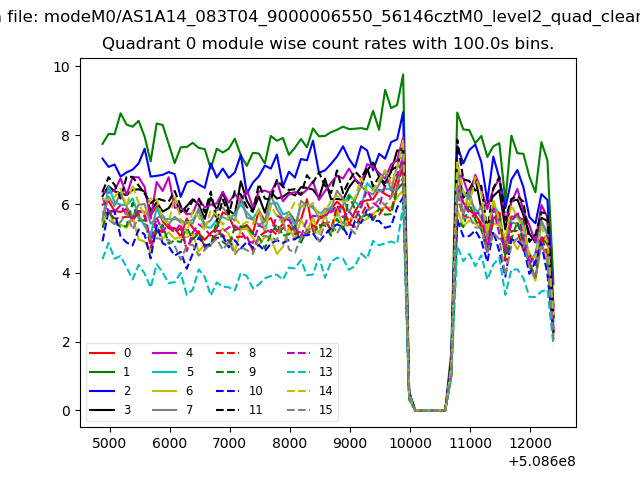 |
 |
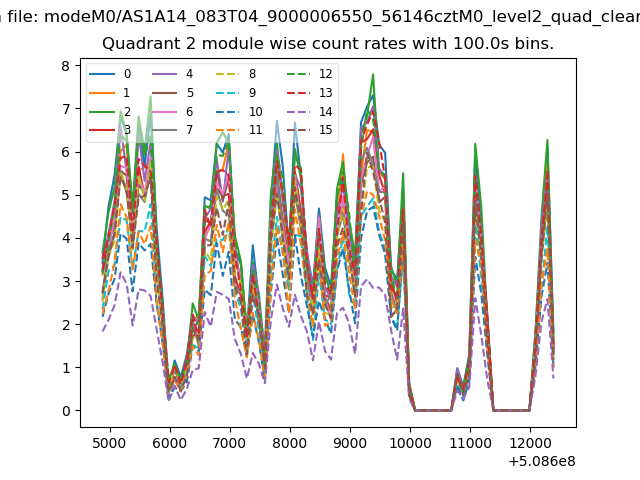
| Module-wise count rates for Quadrant B Data is divided into 100 sec bins |
 |
 |
| Module-wise count rates for Quadrant C Data is divided into 100 sec bins |
 |
 |
| Module-wise count rates for Quadrant D Data is divided into 100 sec bins |
 |
 |
| Parameter | Plot |
|---|---|
| CZT HV Monitor |  |
| D_VDD | 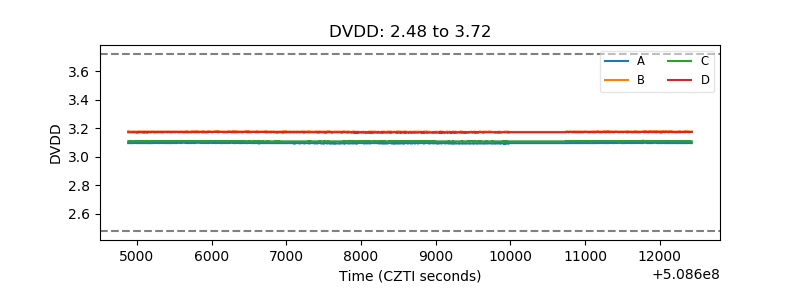 |
| Temperature 1 | 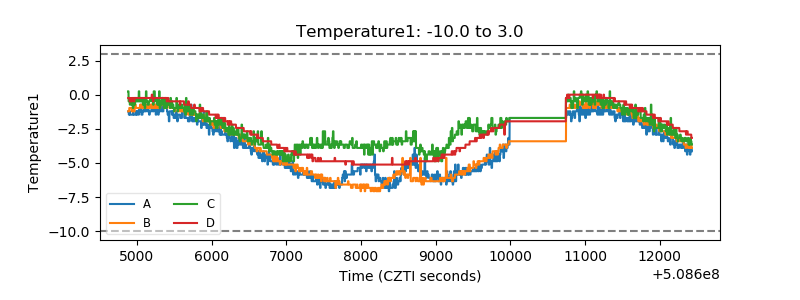 |
| Veto HV Monitor | 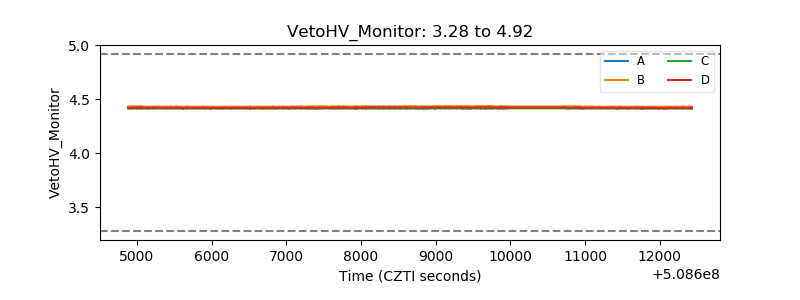 |
| Veto LLD | 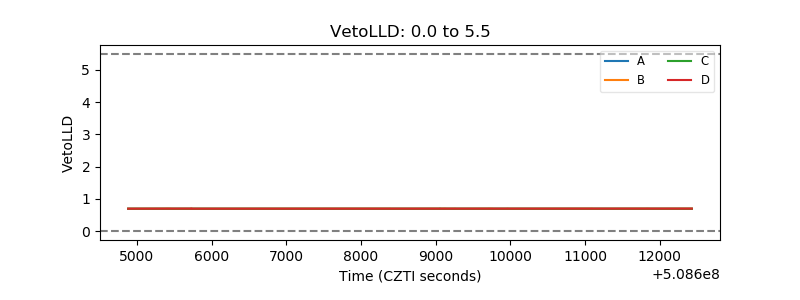 |
| Alpha Counter | 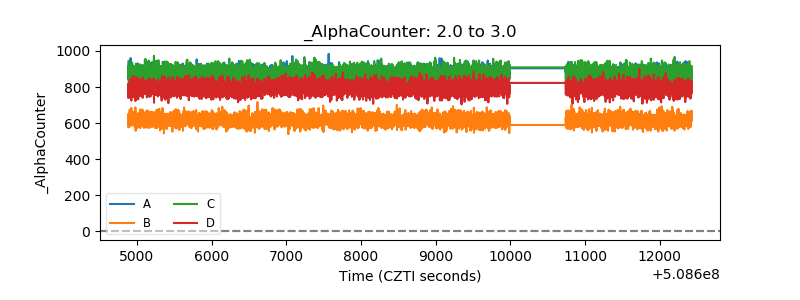 |
| _CPM_Rate | 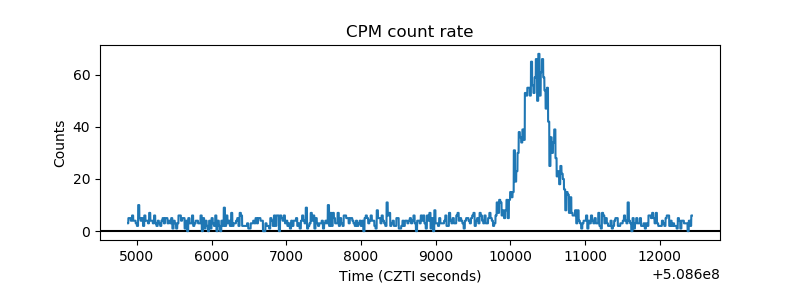 |
| CZT Counter | 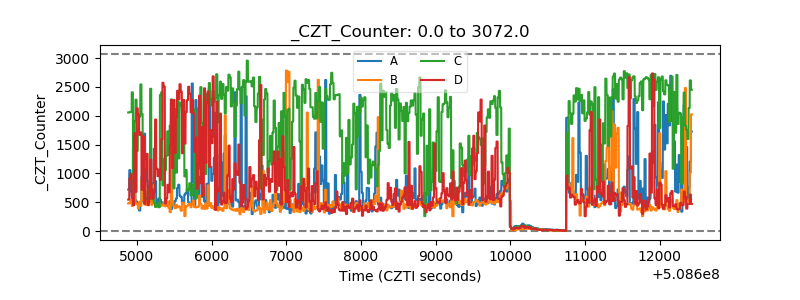 |
| +2.5 Volts monitor | 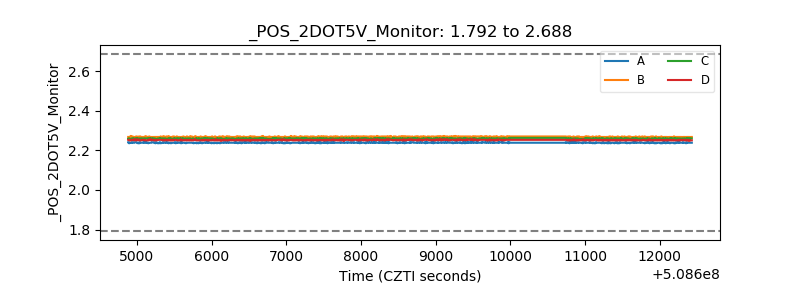 |
| +5 Volts monitor | 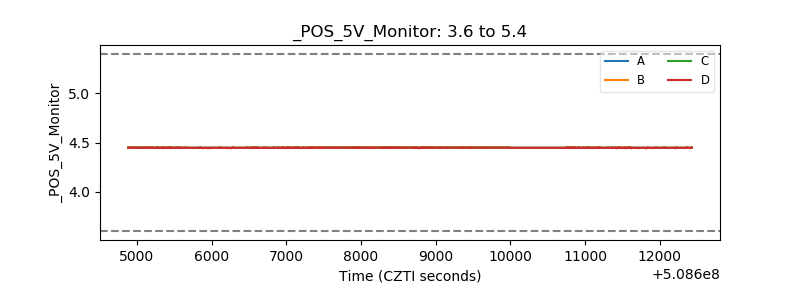 |
| _ROLL_ROT | 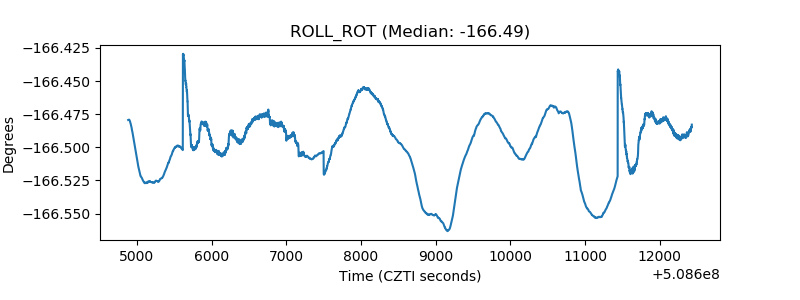 |
| _Roll_DEC | 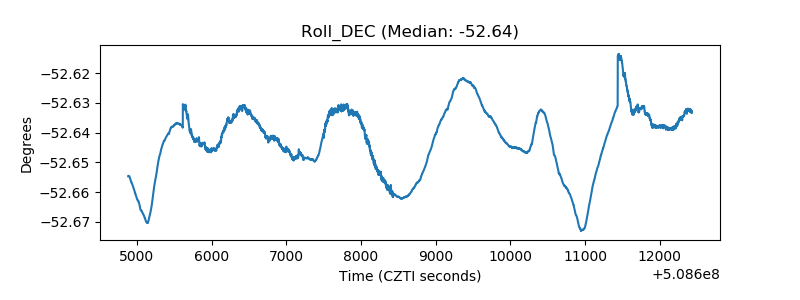 |
| _Roll_RA | 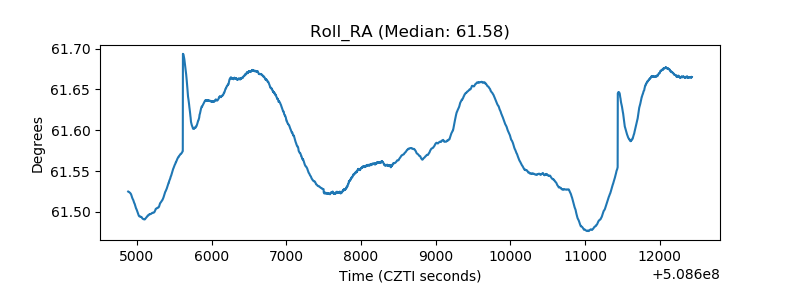 |
| Veto Counter | 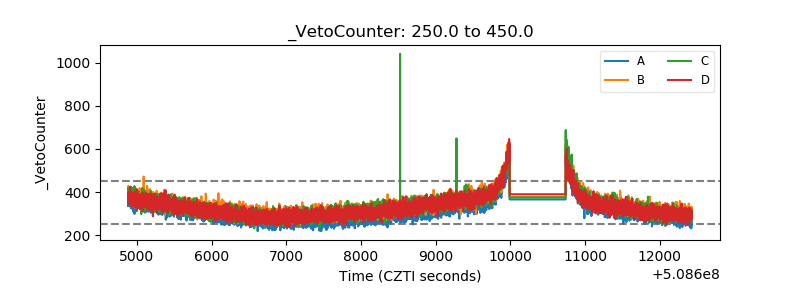 |