| Param | Original file | Final file |
|---|---|---|
| Filename | modeM0/AS1A14_083T04_9000006550_56147cztM0_level2.fits | modeM0/AS1A14_083T04_9000006550_56147cztM0_level2_quad_clean.evt |
| Size (bytes) | 846,492,480 | 96,721,920 |
| Size | 807.3 MB | 92.2 MB |
| Events in quadrant A | 9,149,159 | 599,430 |
| Events in quadrant B | 4,366,945 | 743,812 |
| Events in quadrant C | 11,997,030 | 449,306 |
| Events in quadrant D | 5,240,678 | 613,333 |
| Mode SS | |||
|---|---|---|---|
| Quadrant | BADHDUFLAG | Total packets | Discarded packets |
| A | 0 | 150 | 0 |
| B | 0 | 150 | 0 |
| C | 0 | 150 | 0 |
| D | 0 | 150 | 0 |
| Mode M0 | |||
|---|---|---|---|
| Quadrant | BADHDUFLAG | Total packets | Discarded packets |
| A | 0 | 32468 | 2 |
| B | 0 | 18227 | 2 |
| C | 0 | 40886 | 2 |
| D | 0 | 20905 | 2 |
| Quadrant | Total seconds | Saturated seconds | Saturation percentage |
|---|---|---|---|
| A | 7508 | 1431 | 19.059670% |
| B | 7508 | 307 | 4.088972% |
| C | 7508 | 2880 | 38.359084% |
| D | 7509 | 257 | 3.422560% |
Noise dominated data is calculated using 1-second bins in cleaned event files. If a bin has >2000 counts, and if more than 50% of those come from <1% of pixels, then it is considered to be noise-dominated and hence unusable.
| Quadrant | # 1 sec bins | Bins with >0 counts | Bins with >2000 counts | High rate bins dominated by noise | Noise dominated (total time) | Noise dominated (detector-on time) | Marked lightcurve |
|---|---|---|---|---|---|---|---|
| A | 7588 | 7508 | 1397 | 1397 | 18.41% | 18.61% |  |
| B | 7588 | 7510 | 197 | 197 | 2.60% | 2.62% |  |
| C | 7588 | 7510 | 2782 | 2782 | 36.66% | 37.04% |  |
| D | 7589 | 7511 | 226 | 226 | 2.98% | 3.01% |  |
Top three noisy pixels from each quadrant. If the there are fewer than three noisy pixels in the level2.evt file, extra rows are filled as -1
| Pixel properties | Quadrant properties | ||||||
|---|---|---|---|---|---|---|---|
| Quadrant | DetID | PixID | Counts | Sigma | Mean | Median | Sigma |
| A | 12 | 115 | 3329375 | 17898.73 | 752 | 733 | 186.0 |
| A | 7 | 64 | 1209804 | 6501.4 | 752 | 733 | 186.0 |
| A | 3 | 14 | 579014 | 3109.53 | 752 | 733 | 186.0 |
| B | 4 | 171 | 579076 | 3461.24 | 787 | 759 | 167.1 |
| B | 5 | 185 | 185226 | 1104.04 | 787 | 759 | 167.1 |
| B | 10 | 247 | 85566 | 507.57 | 787 | 759 | 167.1 |
| C | 9 | 38 | 5647846 | 32684.51 | 628 | 623 | 172.8 |
| C | 15 | 147 | 1652860 | 9562.68 | 628 | 623 | 172.8 |
| C | 15 | 148 | 1425915 | 8249.18 | 628 | 623 | 172.8 |
| D | 8 | 240 | 557699 | 2594.47 | 756 | 722 | 214.7 |
| D | 2 | 62 | 490094 | 2279.56 | 756 | 722 | 214.7 |
| D | 2 | 249 | 363582 | 1690.25 | 756 | 722 | 214.7 |
Histogram calculated using DETX and DETY for each event in the final _common_clean file
| Quadrant A |  |
 |
Quadrant B |
|---|---|---|---|
| Quadrant D |  |
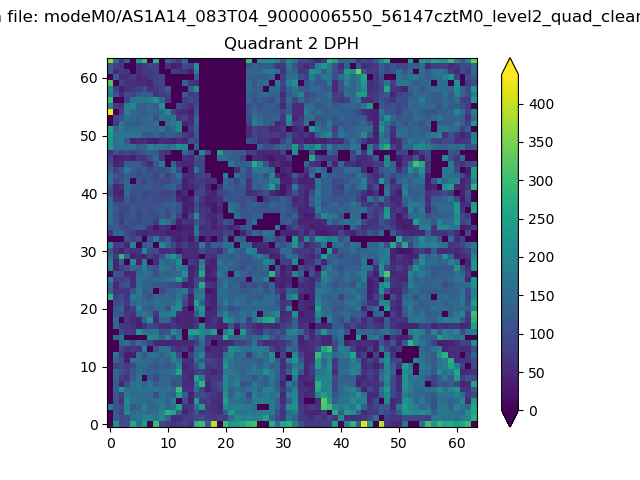 |
Quadrant C |
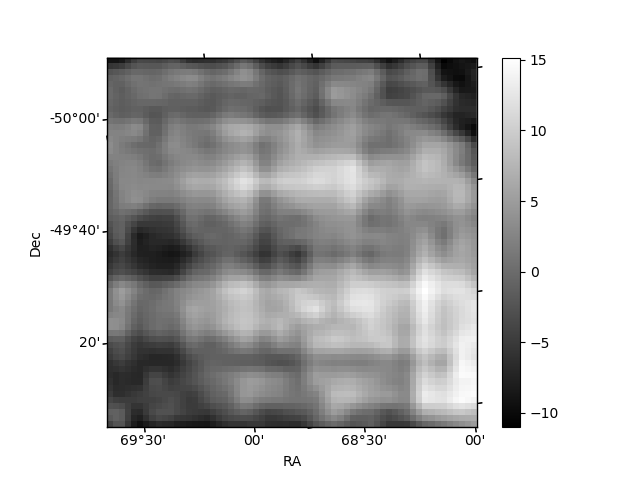
| Plot type | Count rate plots | Images |
|---|---|---|
| Comparison with Poisson distribution Blue bars denote a histogram of data divided into 1 sec bins. Red curve is a Poisson curve with rate = median count rate of data. |
 |
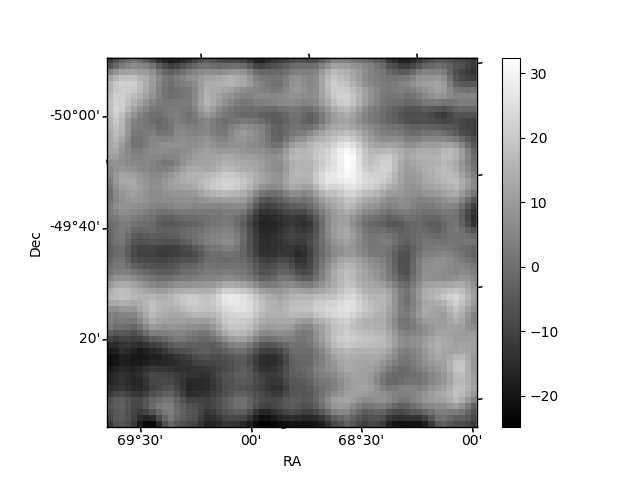 |
| Quadrant-wise count rates Data is divided into 100 sec bins |
 |
|
| Module-wise count rates for Quadrant A Data is divided into 100 sec bins |
 |
 |
| Module-wise count rates for Quadrant B Data is divided into 100 sec bins |
 |
 |
| Module-wise count rates for Quadrant C Data is divided into 100 sec bins |
 |
 |
| Module-wise count rates for Quadrant D Data is divided into 100 sec bins |
 |
 |
| Parameter | Plot |
|---|---|
| CZT HV Monitor |  |
| D_VDD |  |
| Temperature 1 |  |
| Veto HV Monitor |  |
| Veto LLD |  |
| Alpha Counter |  |
| _CPM_Rate | 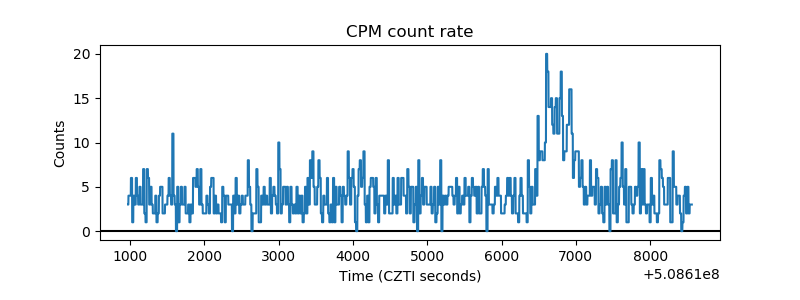 |
| CZT Counter |  |
| +2.5 Volts monitor |  |
| +5 Volts monitor |  |
| _ROLL_ROT |  |
| _Roll_DEC |  |
| _Roll_RA |  |
| Veto Counter |  |