| Param | Original file | Final file |
|---|---|---|
| Filename | modeM0/AS1A14_083T04_9000006550_56148cztM0_level2.fits | modeM0/AS1A14_083T04_9000006550_56148cztM0_level2_quad_clean.evt |
| Size (bytes) | 576,002,880 | 99,103,680 |
| Size | 549.3 MB | 94.5 MB |
| Events in quadrant A | 5,704,942 | 654,282 |
| Events in quadrant B | 3,963,258 | 731,861 |
| Events in quadrant C | 6,456,134 | 490,205 |
| Events in quadrant D | 4,619,601 | 606,493 |
| Mode SS | |||
|---|---|---|---|
| Quadrant | BADHDUFLAG | Total packets | Discarded packets |
| A | 0 | 150 | 0 |
| B | 0 | 150 | 0 |
| C | 0 | 150 | 0 |
| D | 0 | 150 | 0 |
| Mode M0 | |||
|---|---|---|---|
| Quadrant | BADHDUFLAG | Total packets | Discarded packets |
| A | 0 | 22138 | 0 |
| B | 0 | 17092 | 0 |
| C | 0 | 24607 | 0 |
| D | 0 | 18961 | 0 |
| Quadrant | Total seconds | Saturated seconds | Saturation percentage |
|---|---|---|---|
| A | 7435 | 433 | 5.823806% |
| B | 7436 | 154 | 2.071006% |
| C | 7436 | 1873 | 25.188273% |
| D | 7436 | 130 | 1.748252% |
Noise dominated data is calculated using 1-second bins in cleaned event files. If a bin has >2000 counts, and if more than 50% of those come from <1% of pixels, then it is considered to be noise-dominated and hence unusable.
| Quadrant | # 1 sec bins | Bins with >0 counts | Bins with >2000 counts | High rate bins dominated by noise | Noise dominated (total time) | Noise dominated (detector-on time) | Marked lightcurve |
|---|---|---|---|---|---|---|---|
| A | 7435 | 7435 | 356 | 356 | 4.79% | 4.79% | 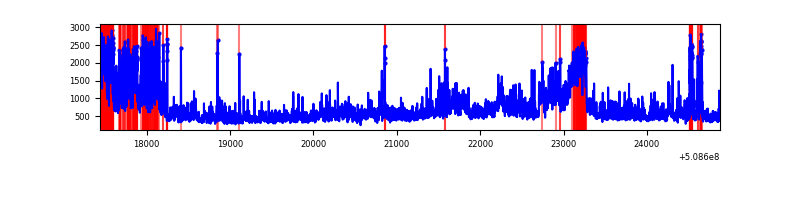 |
| B | 7436 | 7436 | 93 | 93 | 1.25% | 1.25% | 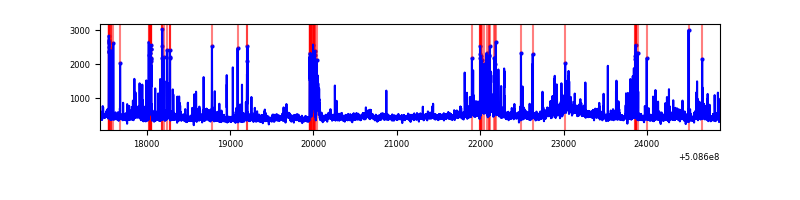 |
| C | 7436 | 7436 | 884 | 884 | 11.89% | 11.89% | 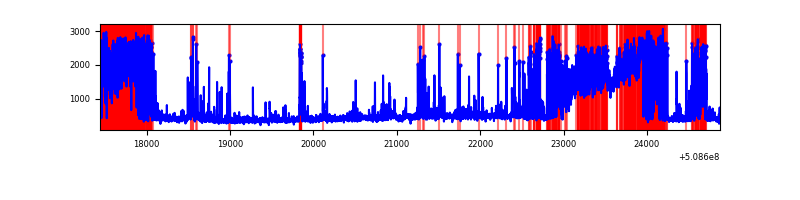 |
| D | 7436 | 7436 | 147 | 147 | 1.98% | 1.98% | 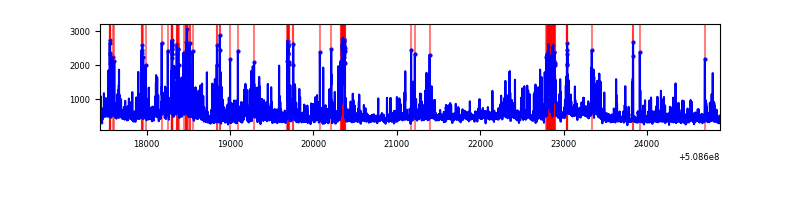 |
Top three noisy pixels from each quadrant. If the there are fewer than three noisy pixels in the level2.evt file, extra rows are filled as -1
| Pixel properties | Quadrant properties | ||||||
|---|---|---|---|---|---|---|---|
| Quadrant | DetID | PixID | Counts | Sigma | Mean | Median | Sigma |
| A | 12 | 115 | 890690 | 4719.66 | 754 | 734 | 188.6 |
| A | 3 | 14 | 689383 | 3652.08 | 754 | 734 | 188.6 |
| A | 15 | 32 | 606434 | 3212.18 | 754 | 734 | 188.6 |
| B | 5 | 185 | 276072 | 1707.76 | 759 | 733 | 161.2 |
| B | 4 | 171 | 170840 | 1055.07 | 759 | 733 | 161.2 |
| B | 10 | 247 | 110230 | 679.14 | 759 | 733 | 161.2 |
| C | 15 | 147 | 1864017 | 11449.99 | 585 | 579 | 162.7 |
| C | 15 | 148 | 1517560 | 9321.17 | 585 | 579 | 162.7 |
| C | 12 | 254 | 459531 | 2820.05 | 585 | 579 | 162.7 |
| D | 2 | 249 | 384418 | 1837.54 | 732 | 698 | 208.8 |
| D | 8 | 240 | 269302 | 1286.28 | 732 | 698 | 208.8 |
| D | 2 | 120 | 236182 | 1127.67 | 732 | 698 | 208.8 |
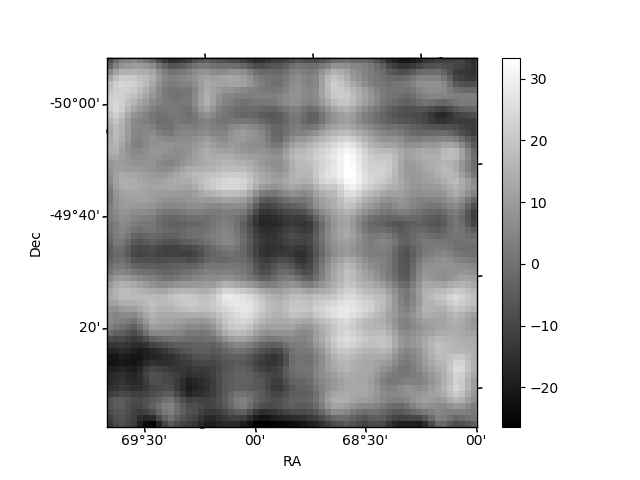
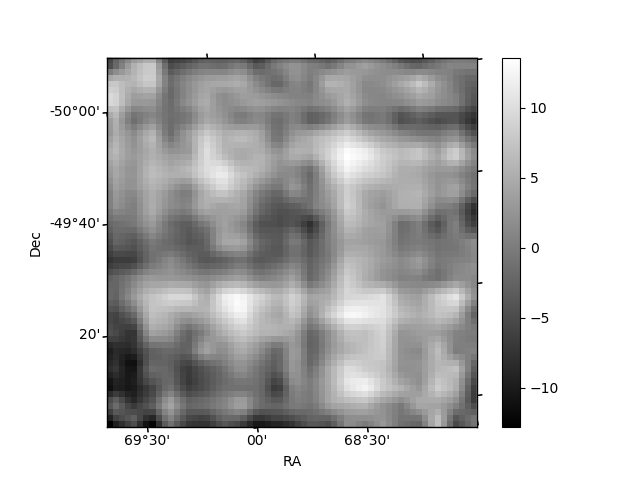
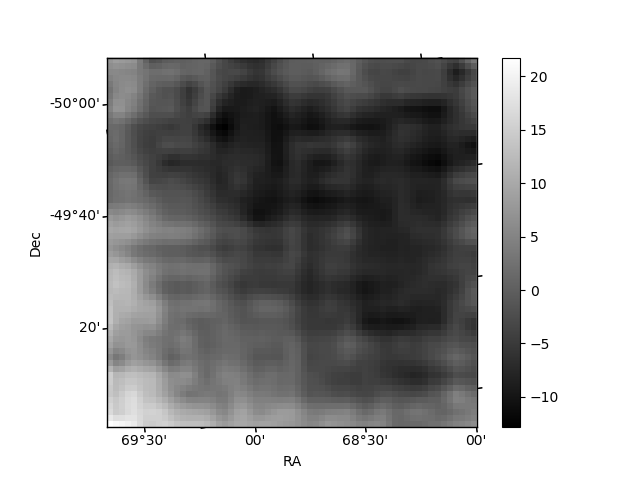
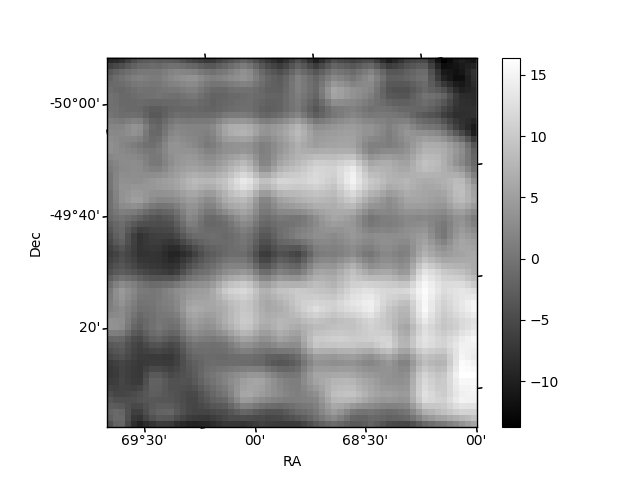
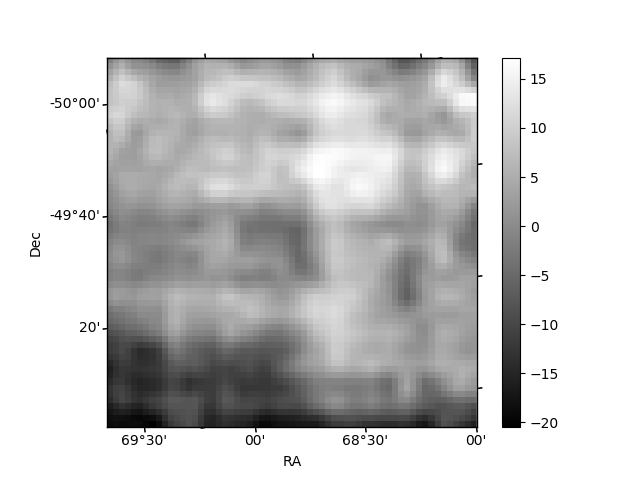
Histogram calculated using DETX and DETY for each event in the final _common_clean file
| Quadrant A | 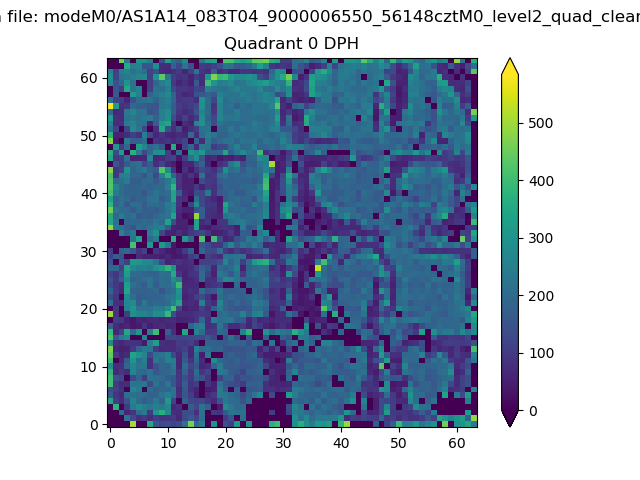 |
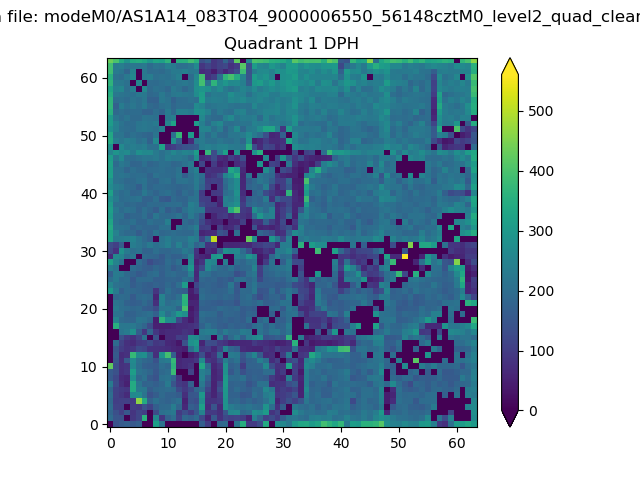 |
Quadrant B |
|---|---|---|---|
| Quadrant D | 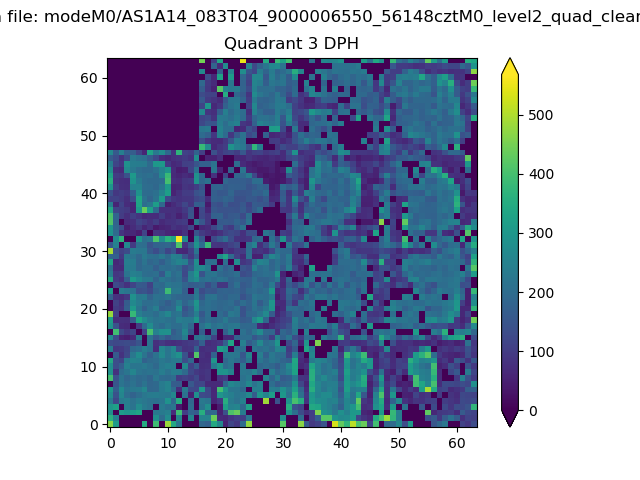 |
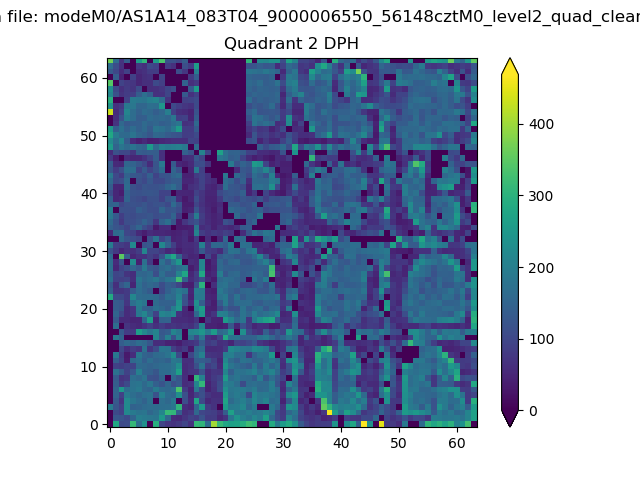 |
Quadrant C |
| Plot type | Count rate plots | Images |
|---|---|---|
| Comparison with Poisson distribution Blue bars denote a histogram of data divided into 1 sec bins. Red curve is a Poisson curve with rate = median count rate of data. |
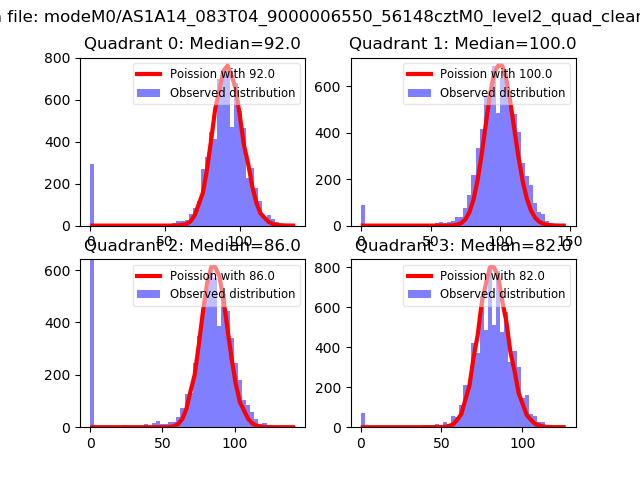 |
 |
| Quadrant-wise count rates Data is divided into 100 sec bins |
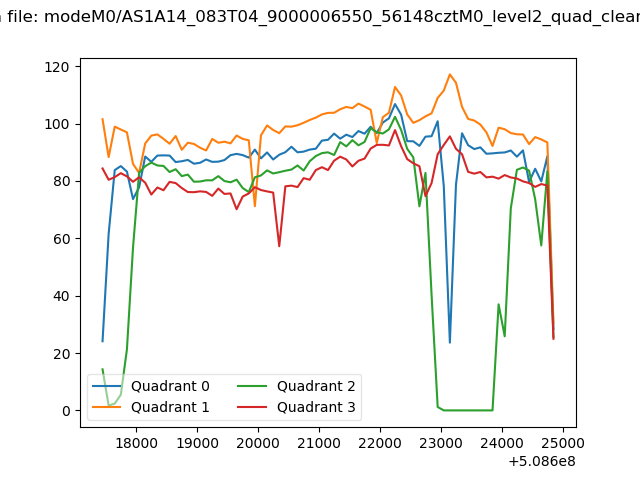 |
|
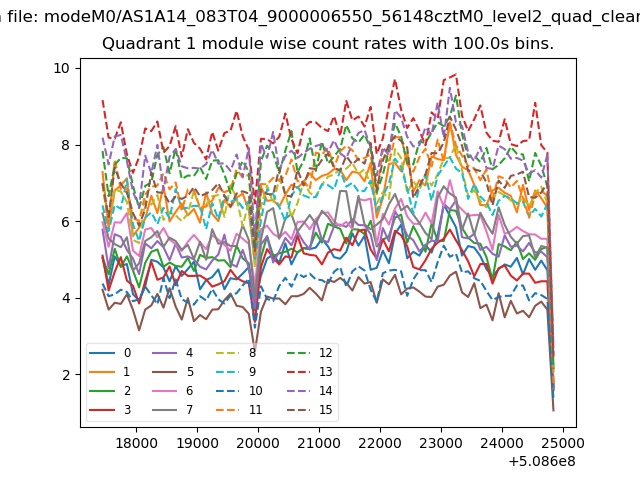
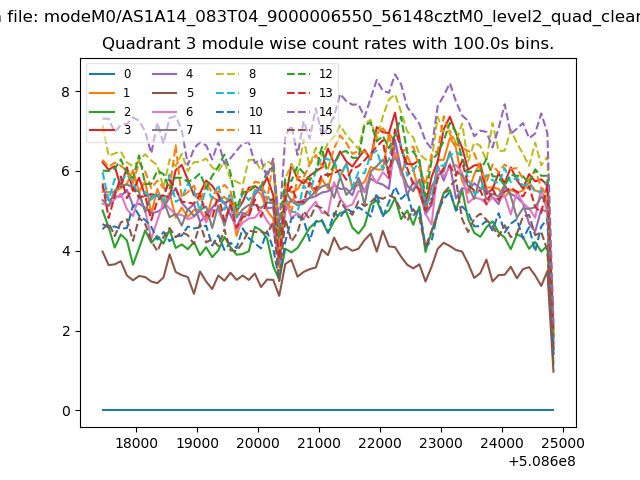
| Module-wise count rates for Quadrant A Data is divided into 100 sec bins |
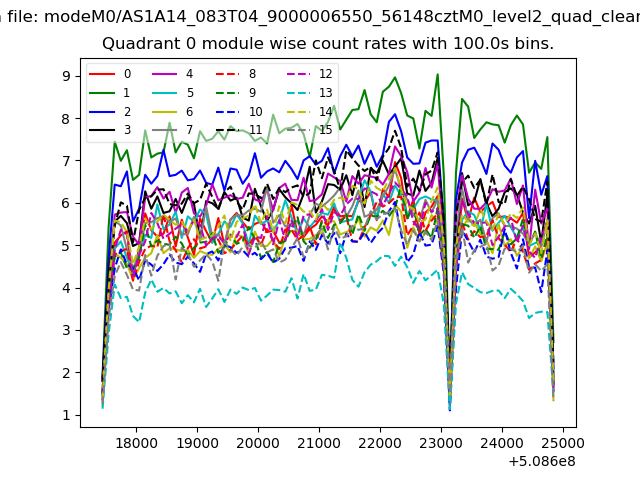 |
 |
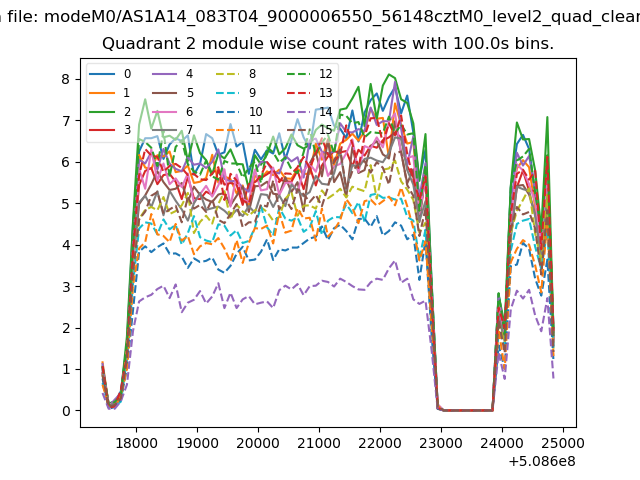
| Module-wise count rates for Quadrant B Data is divided into 100 sec bins |
 |
 |
| Module-wise count rates for Quadrant C Data is divided into 100 sec bins |
 |
 |
| Module-wise count rates for Quadrant D Data is divided into 100 sec bins |
 |
 |
| Parameter | Plot |
|---|---|
| CZT HV Monitor | 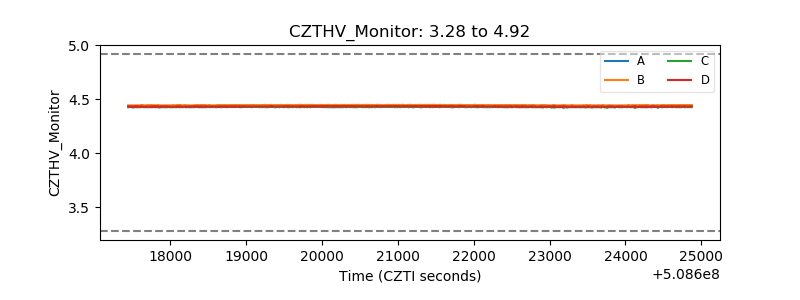 |
| D_VDD | 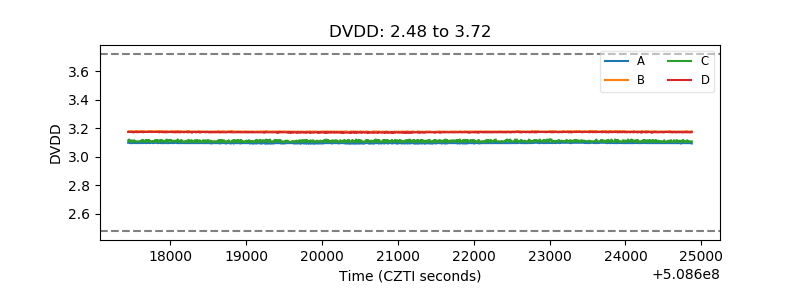 |
| Temperature 1 | 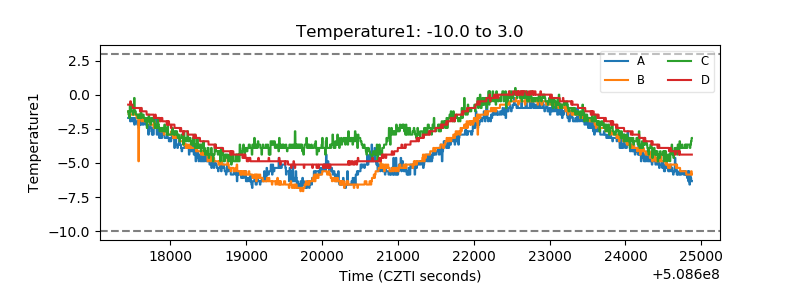 |
| Veto HV Monitor | 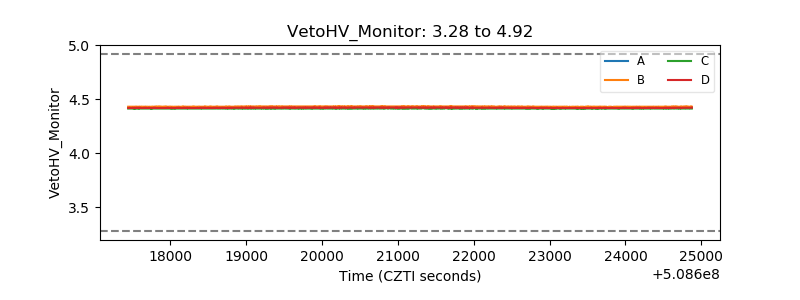 |
| Veto LLD | 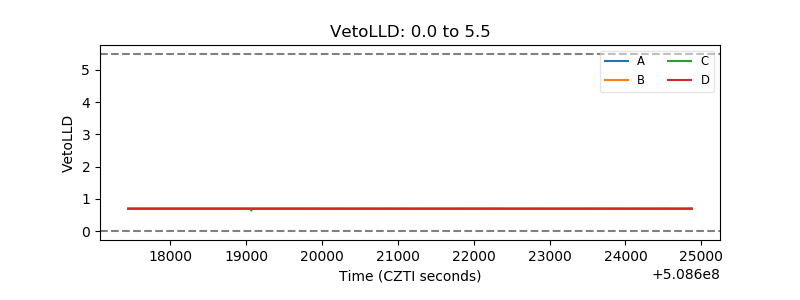 |
| Alpha Counter | 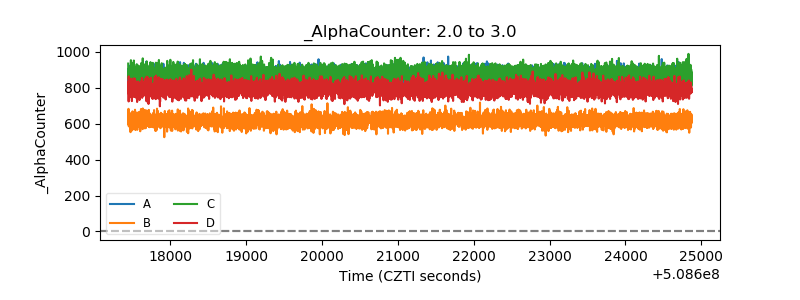 |
| _CPM_Rate | 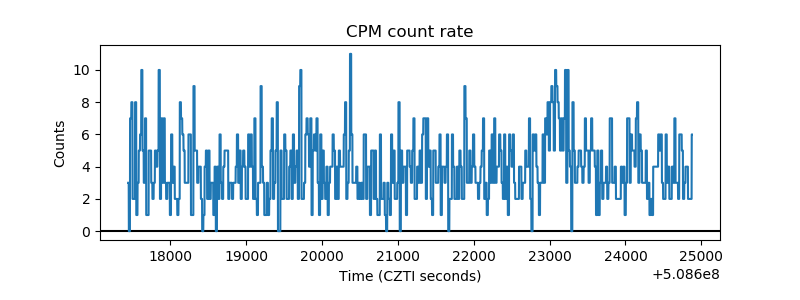 |
| CZT Counter | 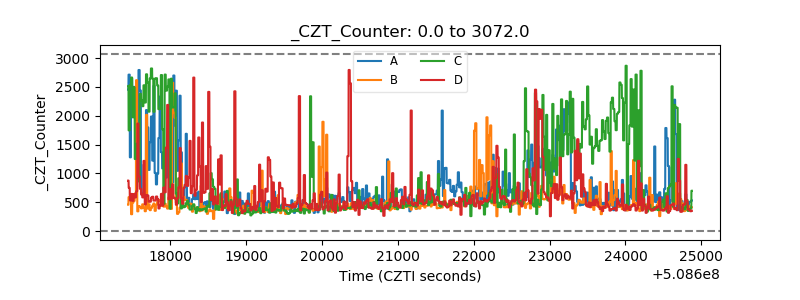 |
| +2.5 Volts monitor | 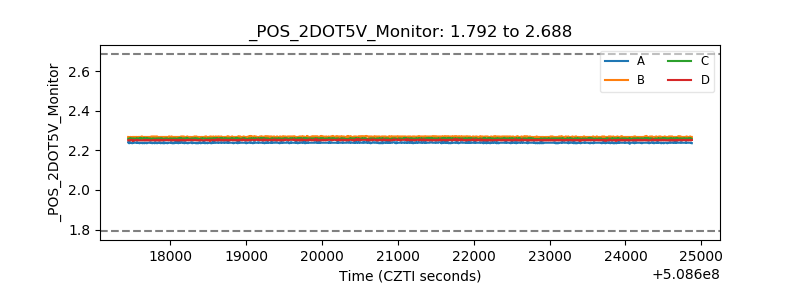 |
| +5 Volts monitor | 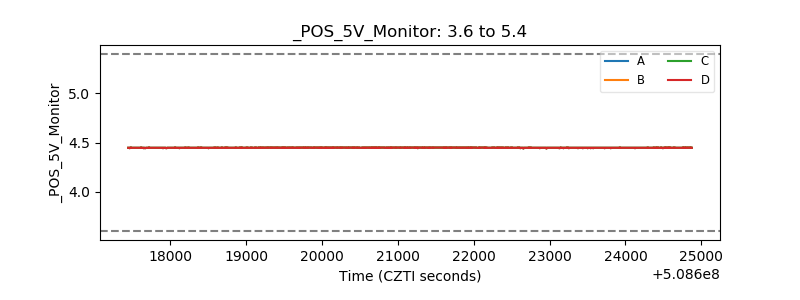 |
| _ROLL_ROT | 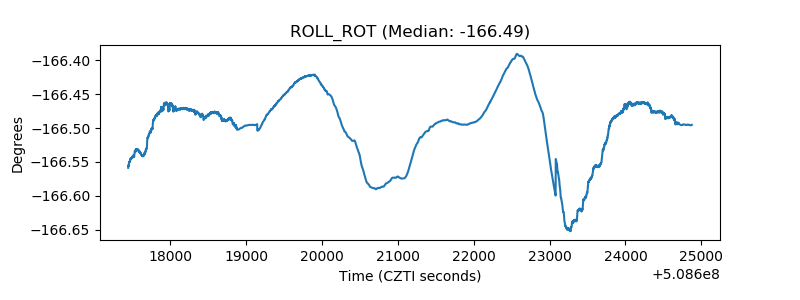 |
| _Roll_DEC | 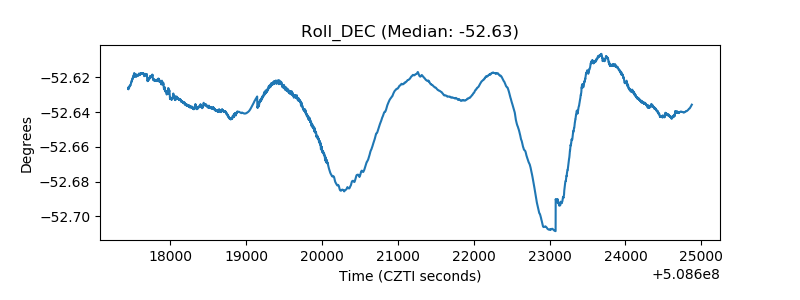 |
| _Roll_RA | 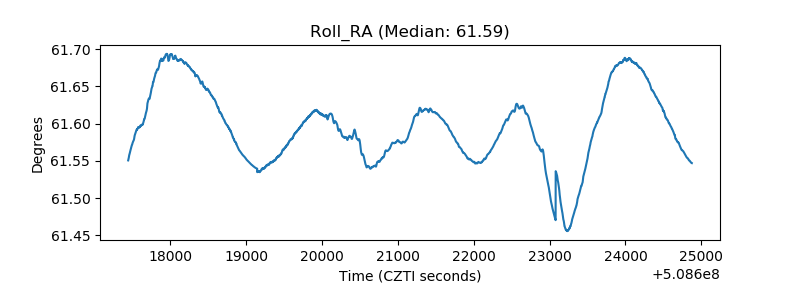 |
| Veto Counter | 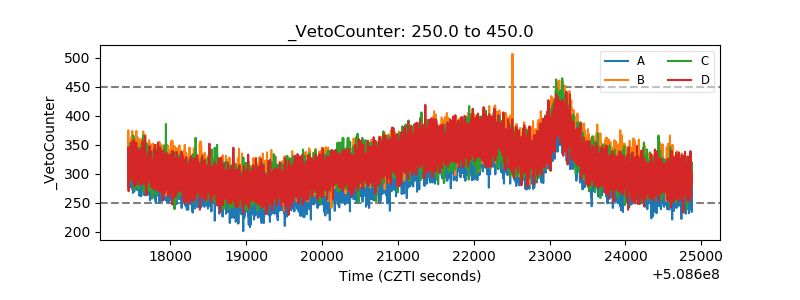 |