| Param | Original file | Final file |
|---|---|---|
| Filename | modeM0/AS1A14_083T04_9000006550_56152cztM0_level2.fits | modeM0/AS1A14_083T04_9000006550_56152cztM0_level2_quad_clean.evt |
| Size (bytes) | 1,695,432,960 | 178,058,880 |
| Size | 1.6 GB | 169.8 MB |
| Events in quadrant A | 27,063,403 | 891,643 |
| Events in quadrant B | 10,440,471 | 1,167,797 |
| Events in quadrant C | 11,573,180 | 1,003,588 |
| Events in quadrant D | 12,177,076 | 983,687 |
| Mode SS | |||
|---|---|---|---|
| Quadrant | BADHDUFLAG | Total packets | Discarded packets |
| A | 0 | 396 | 0 |
| B | 0 | 396 | 0 |
| C | 0 | 396 | 0 |
| D | 0 | 396 | 0 |
| Mode M9 | |||
|---|---|---|---|
| Quadrant | BADHDUFLAG | Total packets | Discarded packets |
| A | 0 | 11 | 0 |
| B | 0 | 11 | 0 |
| C | 0 | 11 | 0 |
| D | 0 | 11 | 0 |
| Mode M0 | |||
|---|---|---|---|
| Quadrant | BADHDUFLAG | Total packets | Discarded packets |
| A | 0 | 94189 | 4 |
| B | 0 | 45329 | 3 |
| C | 0 | 49136 | 3 |
| D | 0 | 50012 | 3 |
| Quadrant | Total seconds | Saturated seconds | Saturation percentage |
|---|---|---|---|
| A | 19471 | 6406 | 32.900211% |
| B | 19472 | 591 | 3.035127% |
| C | 19472 | 996 | 5.115037% |
| D | 19472 | 428 | 2.198028% |
Noise dominated data is calculated using 1-second bins in cleaned event files. If a bin has >2000 counts, and if more than 50% of those come from <1% of pixels, then it is considered to be noise-dominated and hence unusable.
| Quadrant | # 1 sec bins | Bins with >0 counts | Bins with >2000 counts | High rate bins dominated by noise | Noise dominated (total time) | Noise dominated (detector-on time) | Marked lightcurve |
|---|---|---|---|---|---|---|---|
| A | 21090 | 19711 | 5663 | 5663 | 26.85% | 28.73% | 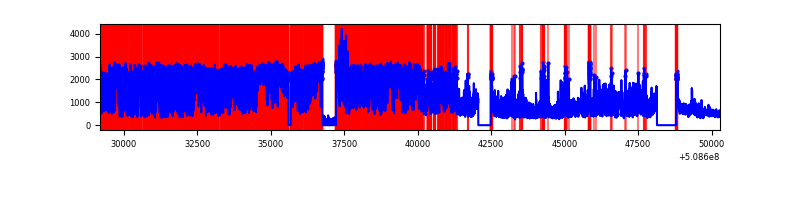 |
| B | 21091 | 19920 | 209 | 209 | 0.99% | 1.05% | 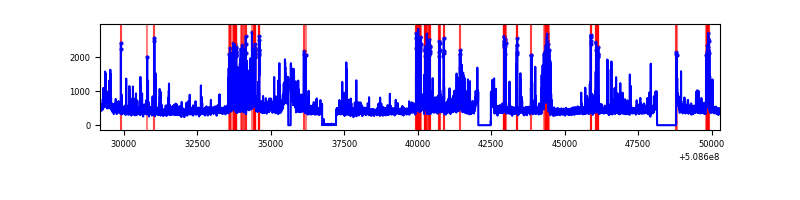 |
| C | 21091 | 19921 | 825 | 825 | 3.91% | 4.14% | 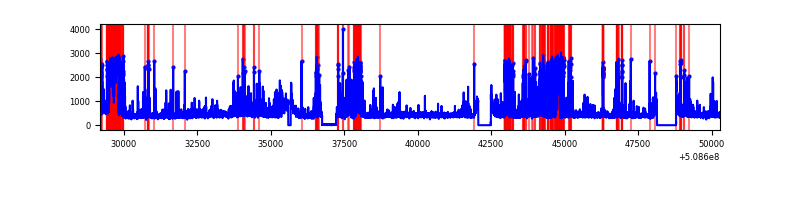 |
| D | 21091 | 19921 | 351 | 351 | 1.66% | 1.76% | 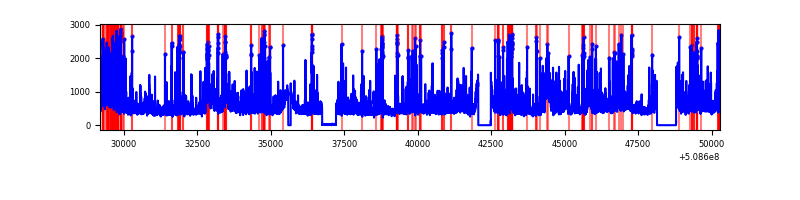 |
Top three noisy pixels from each quadrant. If the there are fewer than three noisy pixels in the level2.evt file, extra rows are filled as -1
| Pixel properties | Quadrant properties | ||||||
|---|---|---|---|---|---|---|---|
| Quadrant | DetID | PixID | Counts | Sigma | Mean | Median | Sigma |
| A | 9 | 250 | 14293430 | 32926.79 | 1778 | 1739 | 434.0 |
| A | 3 | 14 | 3734814 | 8600.67 | 1778 | 1739 | 434.0 |
| A | 15 | 32 | 898941 | 2067.07 | 1778 | 1739 | 434.0 |
| B | 5 | 185 | 930731 | 2126.63 | 2052 | 1977 | 436.7 |
| B | 0 | 153 | 234201 | 531.74 | 2052 | 1977 | 436.7 |
| B | 4 | 171 | 203702 | 461.9 | 2052 | 1977 | 436.7 |
| C | 12 | 254 | 2669166 | 4902.14 | 1986 | 1965 | 544.1 |
| C | 6 | 223 | 608145 | 1114.12 | 1986 | 1965 | 544.1 |
| C | 12 | 252 | 273378 | 498.84 | 1986 | 1965 | 544.1 |
| D | 8 | 240 | 1776854 | 3165.32 | 1999 | 1906 | 560.7 |
| D | 2 | 62 | 503860 | 895.15 | 1999 | 1906 | 560.7 |
| D | 2 | 120 | 436657 | 775.3 | 1999 | 1906 | 560.7 |
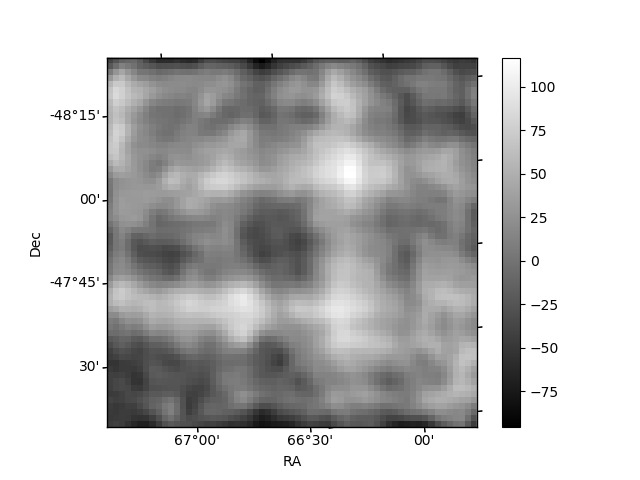
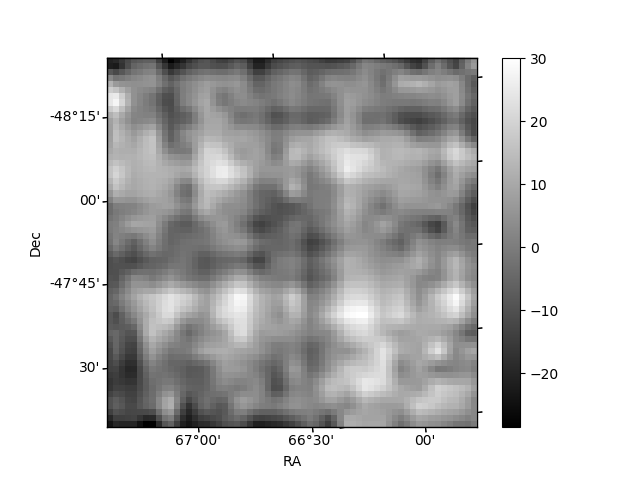
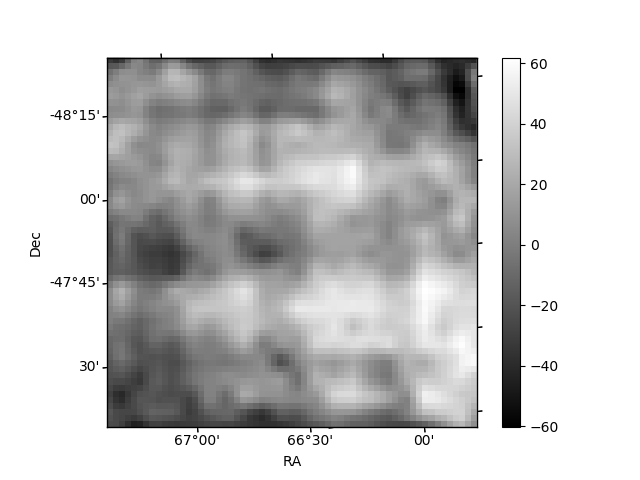
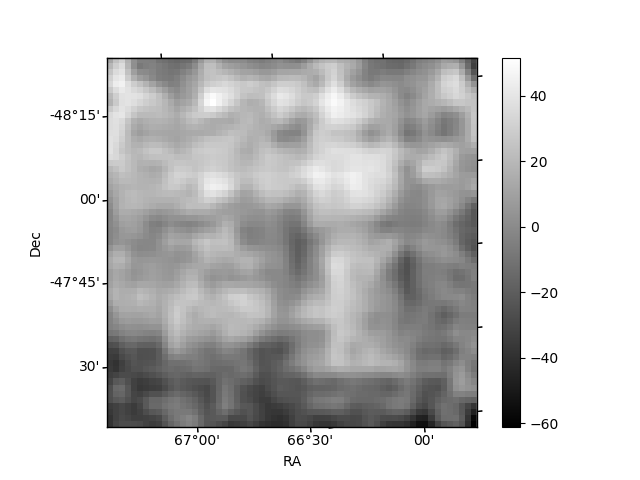
Histogram calculated using DETX and DETY for each event in the final _common_clean file
| Quadrant A | 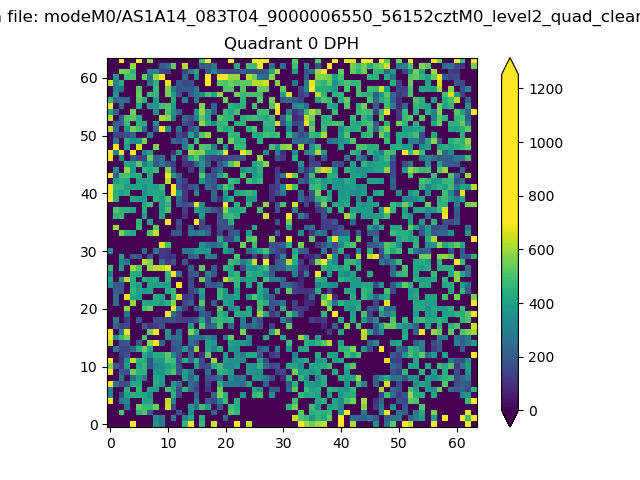 |
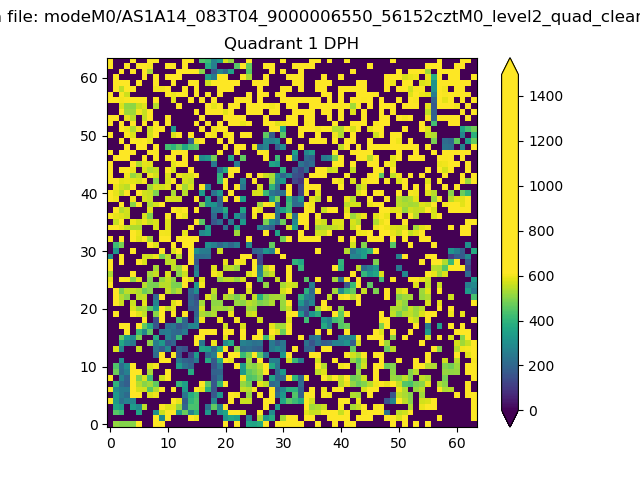 |
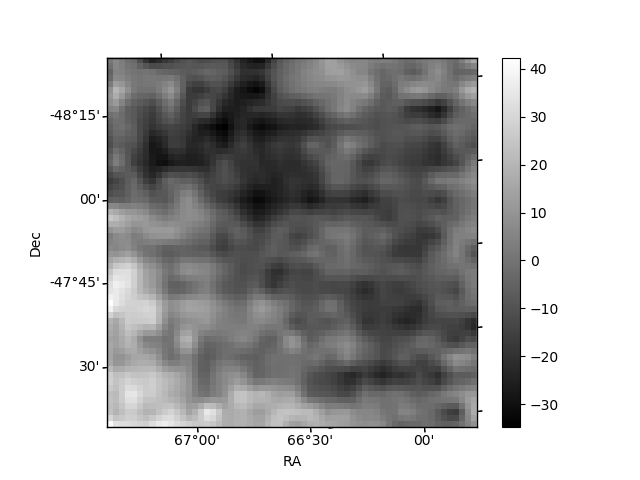
Quadrant B |
|---|---|---|---|
| Quadrant D | 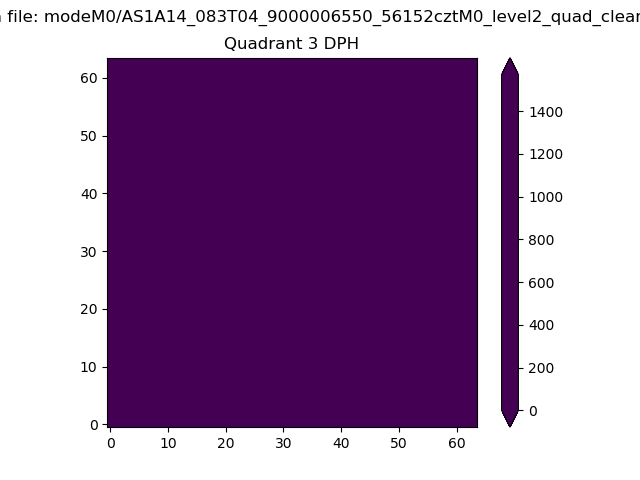 |
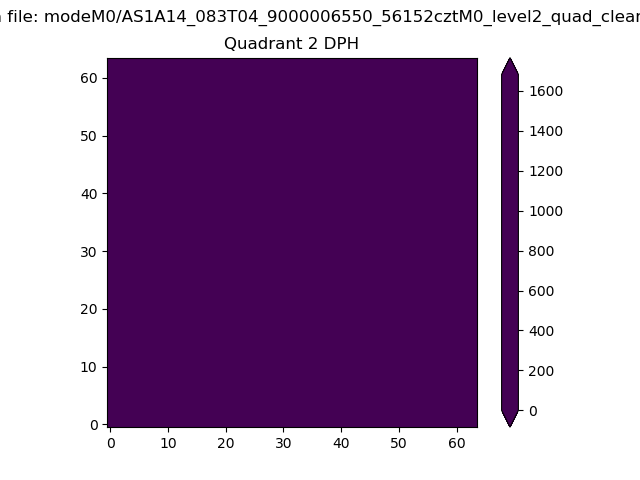 |
Quadrant C |
| Plot type | Count rate plots | Images |
|---|---|---|
| Comparison with Poisson distribution Blue bars denote a histogram of data divided into 1 sec bins. Red curve is a Poisson curve with rate = median count rate of data. |
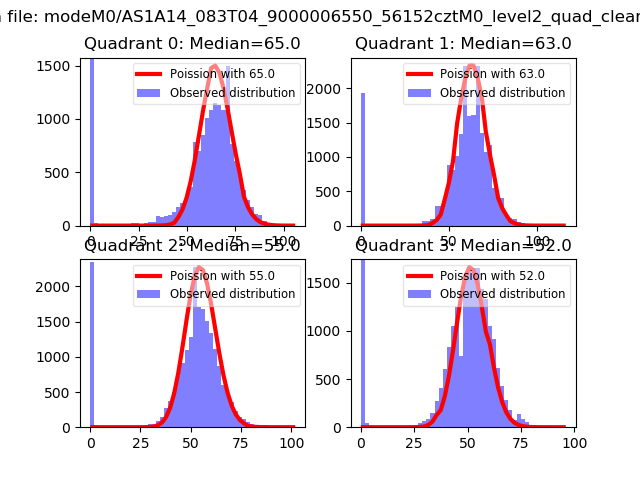 |
 |
| Quadrant-wise count rates Data is divided into 100 sec bins |
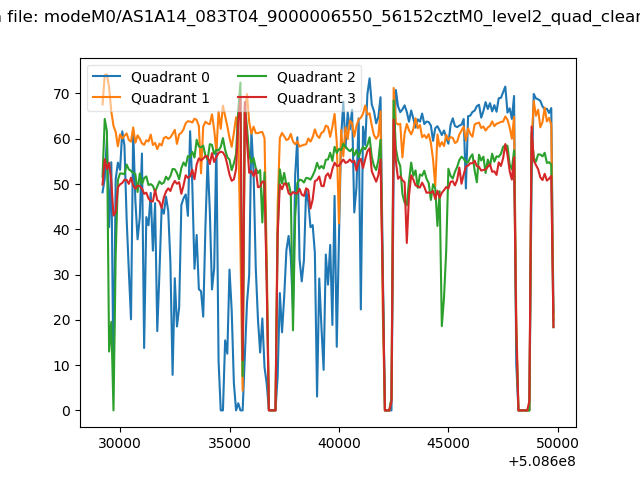 |
|
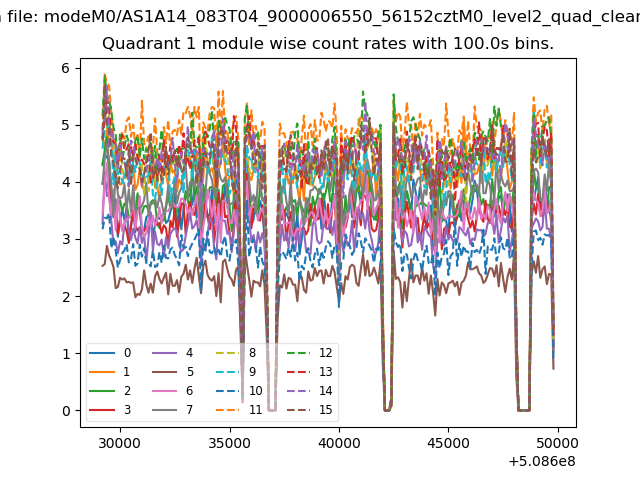
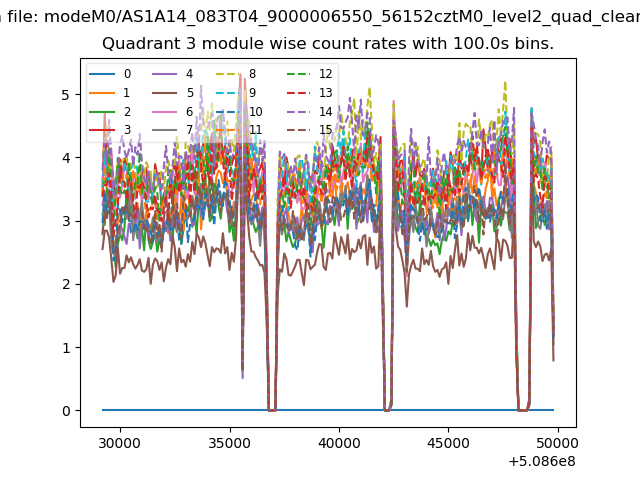
| Module-wise count rates for Quadrant A Data is divided into 100 sec bins |
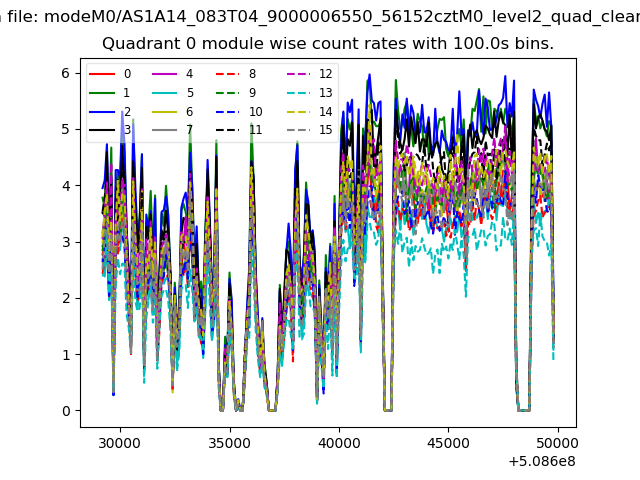 |
 |
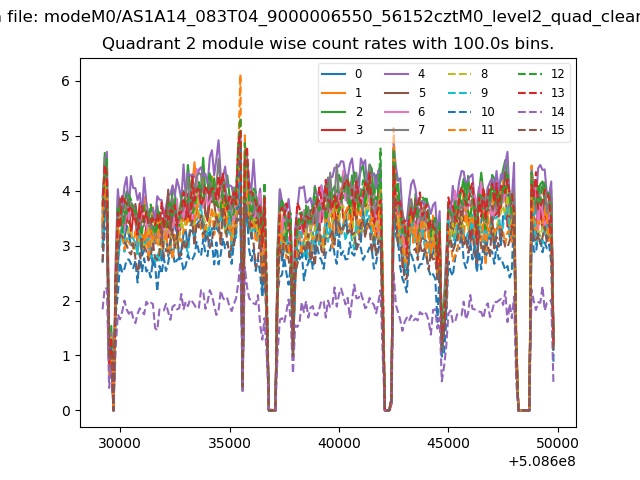
| Module-wise count rates for Quadrant B Data is divided into 100 sec bins |
 |
 |
| Module-wise count rates for Quadrant C Data is divided into 100 sec bins |
 |
 |
| Module-wise count rates for Quadrant D Data is divided into 100 sec bins |
 |
 |
| Parameter | Plot |
|---|---|
| CZT HV Monitor |  |
| D_VDD | 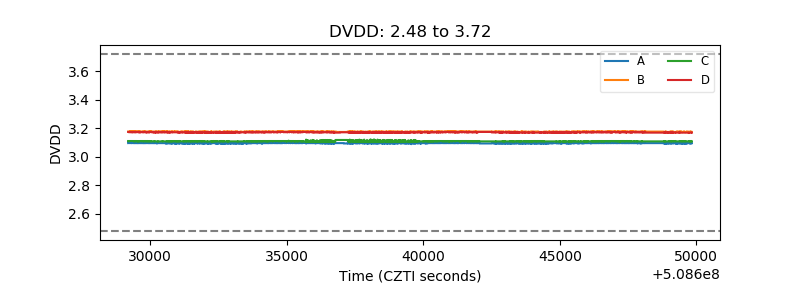 |
| Temperature 1 | 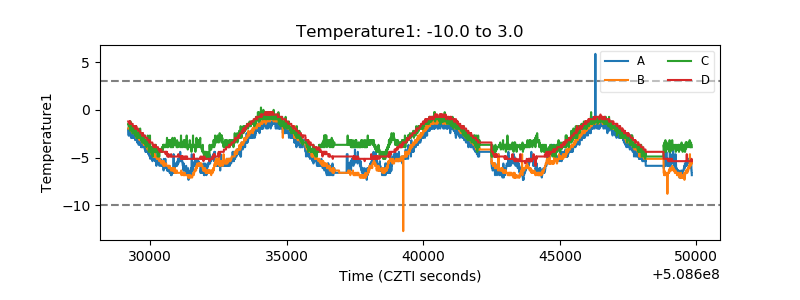 |
| Veto HV Monitor | 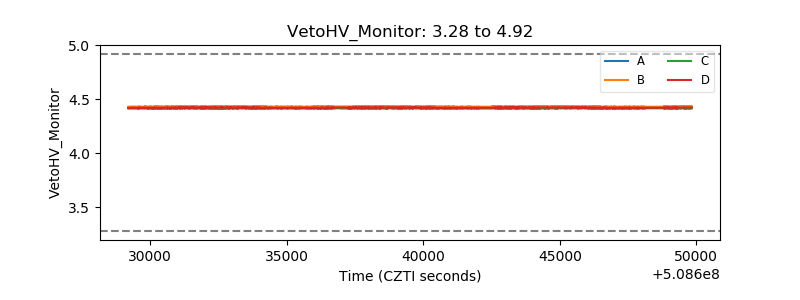 |
| Veto LLD | 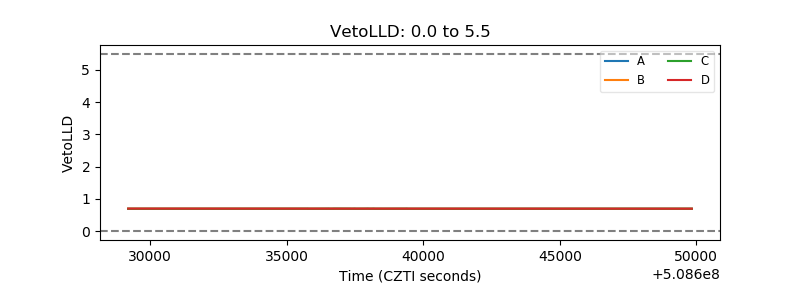 |
| Alpha Counter | 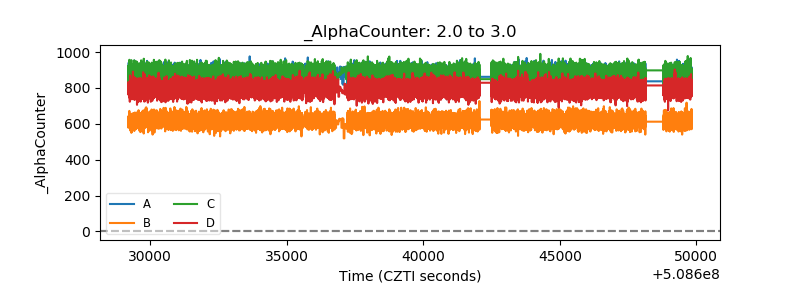 |
| _CPM_Rate | 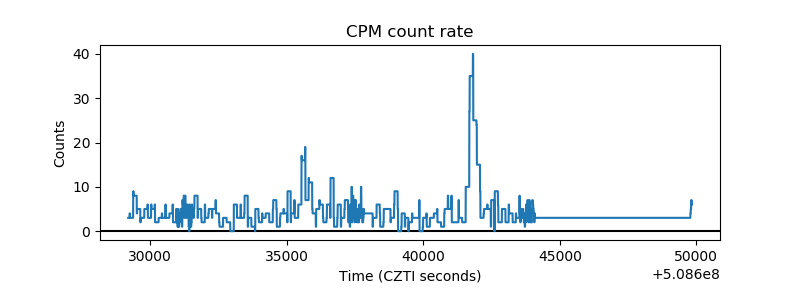 |
| CZT Counter | 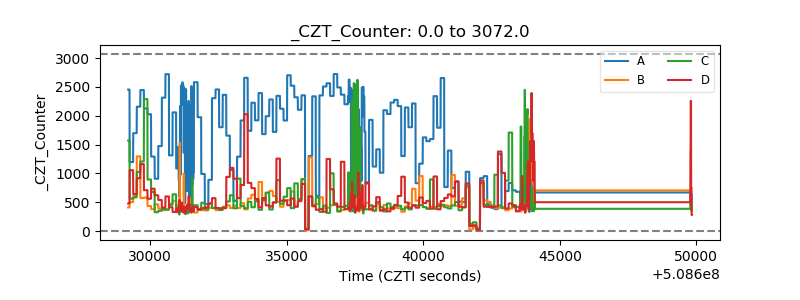 |
| +2.5 Volts monitor |  |
| +5 Volts monitor |  |
| _ROLL_ROT | 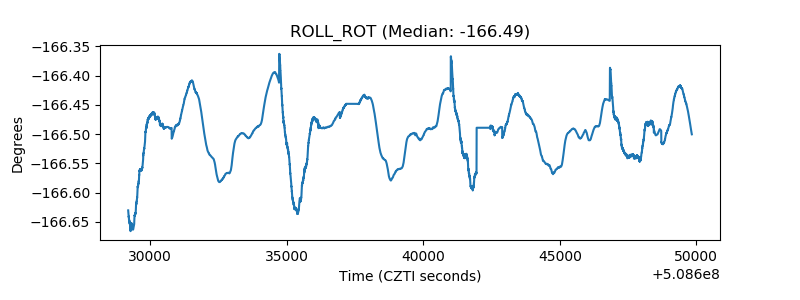 |
| _Roll_DEC | 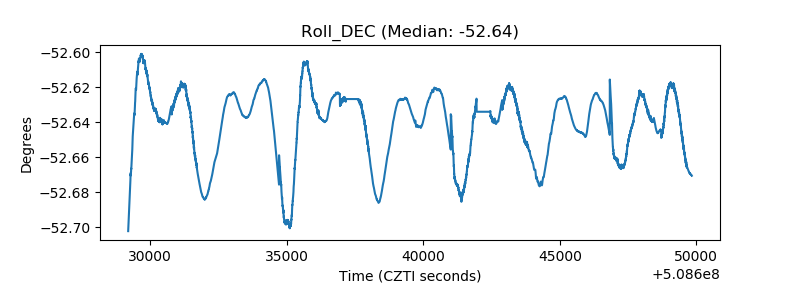 |
| _Roll_RA | 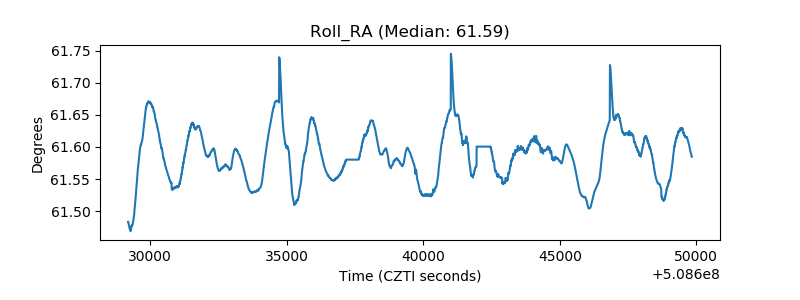 |
| Veto Counter | 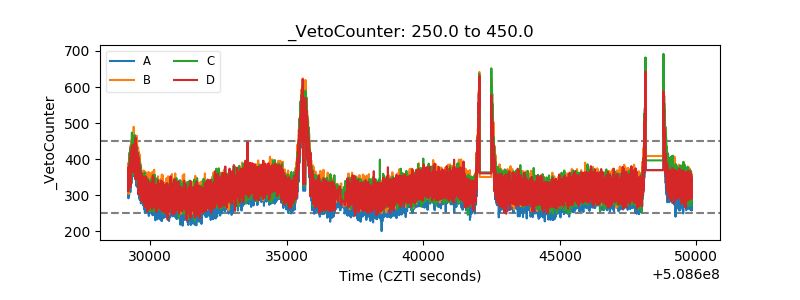 |