| Param | Original file | Final file |
|---|---|---|
| Filename | modeM0/AS1A14_083T04_9000006550_56153cztM0_level2.fits | modeM0/AS1A14_083T04_9000006550_56153cztM0_level2_quad_clean.evt |
| Size (bytes) | 2,469,994,560 | 388,509,120 |
| Size | 2.3 GB | 370.5 MB |
| Events in quadrant A | 34,806,050 | 2,171,384 |
| Events in quadrant B | 15,939,012 | 2,779,424 |
| Events in quadrant C | 18,305,389 | 2,412,078 |
| Events in quadrant D | 20,035,492 | 2,311,419 |
| Mode SS | |||
|---|---|---|---|
| Quadrant | BADHDUFLAG | Total packets | Discarded packets |
| A | 0 | 616 | 0 |
| B | 0 | 616 | 0 |
| C | 0 | 616 | 0 |
| D | 0 | 616 | 0 |
| Mode M9 | |||
|---|---|---|---|
| Quadrant | BADHDUFLAG | Total packets | Discarded packets |
| A | 0 | 19 | 0 |
| B | 0 | 19 | 0 |
| C | 0 | 19 | 0 |
| D | 0 | 19 | 0 |
| Mode M0 | |||
|---|---|---|---|
| Quadrant | BADHDUFLAG | Total packets | Discarded packets |
| A | 0 | 124632 | 9 |
| B | 0 | 69579 | 4 |
| C | 0 | 77267 | 4 |
| D | 0 | 80975 | 4 |
| Quadrant | Total seconds | Saturated seconds | Saturation percentage |
|---|---|---|---|
| A | 30358 | 7046 | 23.209698% |
| B | 30359 | 792 | 2.608782% |
| C | 30359 | 1651 | 5.438256% |
| D | 30359 | 933 | 3.073224% |
Noise dominated data is calculated using 1-second bins in cleaned event files. If a bin has >2000 counts, and if more than 50% of those come from <1% of pixels, then it is considered to be noise-dominated and hence unusable.
| Quadrant | # 1 sec bins | Bins with >0 counts | Bins with >2000 counts | High rate bins dominated by noise | Noise dominated (total time) | Noise dominated (detector-on time) | Marked lightcurve |
|---|---|---|---|---|---|---|---|
| A | 32793 | 30600 | 6149 | 6149 | 18.75% | 20.09% | 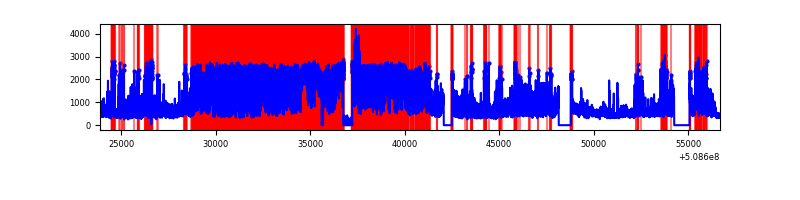 |
| B | 32793 | 30808 | 288 | 288 | 0.88% | 0.93% | 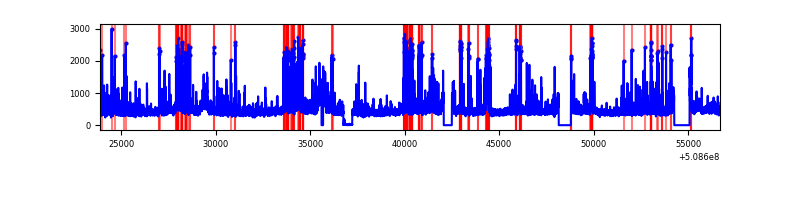 |
| C | 32793 | 30809 | 1371 | 1371 | 4.18% | 4.45% | 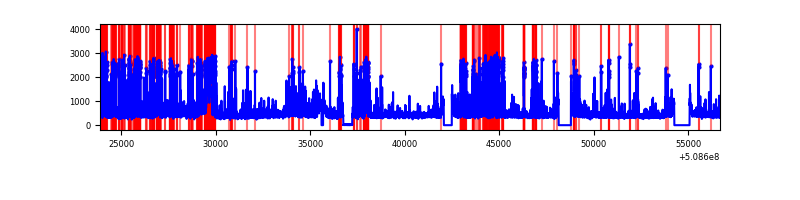 |
| D | 32793 | 30809 | 811 | 811 | 2.47% | 2.63% | 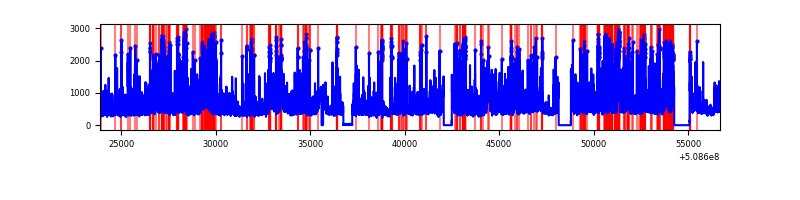 |
Top three noisy pixels from each quadrant. If the there are fewer than three noisy pixels in the level2.evt file, extra rows are filled as -1
| Pixel properties | Quadrant properties | ||||||
|---|---|---|---|---|---|---|---|
| Quadrant | DetID | PixID | Counts | Sigma | Mean | Median | Sigma |
| A | 9 | 250 | 15220994 | 21542.96 | 2890 | 2822 | 706.4 |
| A | 3 | 14 | 4450256 | 6295.82 | 2890 | 2822 | 706.4 |
| A | 0 | 8 | 1106167 | 1561.9 | 2890 | 2822 | 706.4 |
| B | 5 | 185 | 1283647 | 1901.2 | 3180 | 3059 | 673.6 |
| B | 0 | 153 | 305303 | 448.72 | 3180 | 3059 | 673.6 |
| B | 4 | 171 | 291665 | 428.47 | 3180 | 3059 | 673.6 |
| C | 12 | 254 | 4071259 | 4869.03 | 3068 | 3041 | 835.5 |
| C | 6 | 223 | 663494 | 790.46 | 3068 | 3041 | 835.5 |
| C | 12 | 252 | 587933 | 700.03 | 3068 | 3041 | 835.5 |
| D | 8 | 240 | 2577936 | 2967.75 | 3087 | 2947 | 867.7 |
| D | 2 | 62 | 1400297 | 1610.49 | 3087 | 2947 | 867.7 |
| D | 2 | 31 | 745987 | 856.38 | 3087 | 2947 | 867.7 |
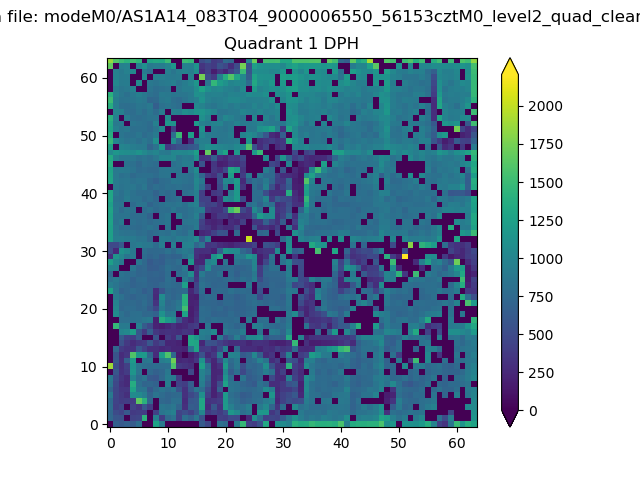
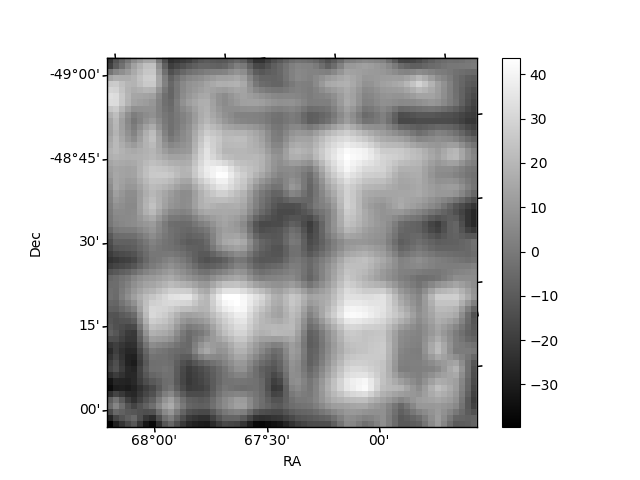
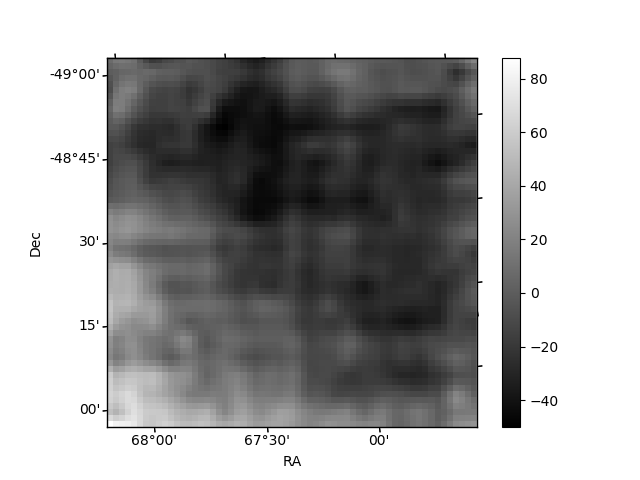
Histogram calculated using DETX and DETY for each event in the final _common_clean file
| Quadrant A |  |
 |
Quadrant B |
|---|---|---|---|
| Quadrant D |  |
 |
Quadrant C |
| Plot type | Count rate plots | Images |
|---|---|---|
| Comparison with Poisson distribution Blue bars denote a histogram of data divided into 1 sec bins. Red curve is a Poisson curve with rate = median count rate of data. |
 |
 |
| Quadrant-wise count rates Data is divided into 100 sec bins |
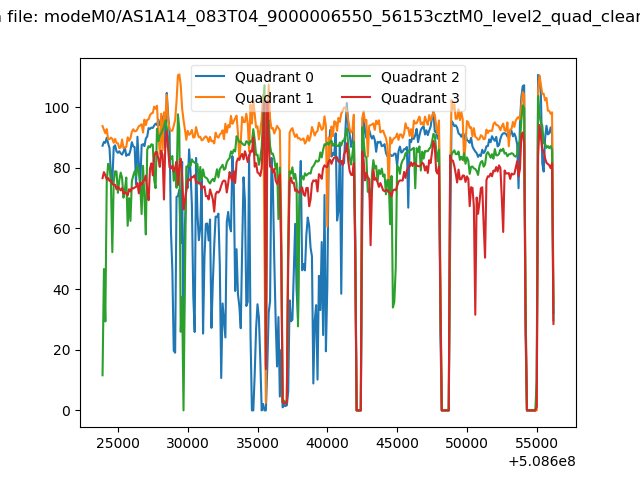 |
|
| Module-wise count rates for Quadrant A Data is divided into 100 sec bins |
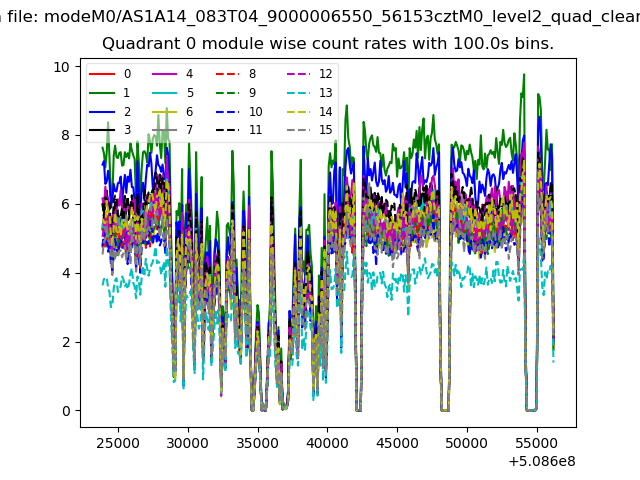 |
 |
| Module-wise count rates for Quadrant B Data is divided into 100 sec bins |
 |
 |
| Module-wise count rates for Quadrant C Data is divided into 100 sec bins |
 |
 |
| Module-wise count rates for Quadrant D Data is divided into 100 sec bins |
 |
 |
| Parameter | Plot |
|---|---|
| CZT HV Monitor | 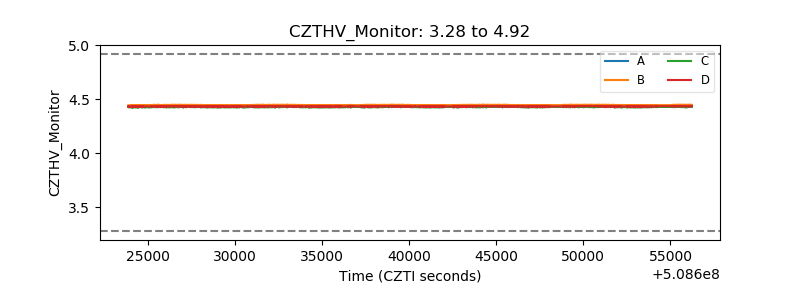 |
| D_VDD | 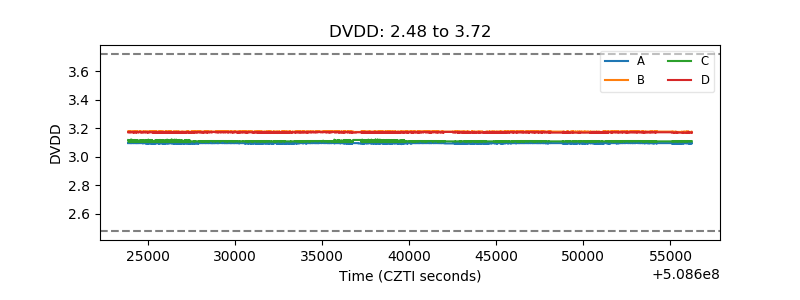 |
| Temperature 1 |  |
| Veto HV Monitor |  |
| Veto LLD | 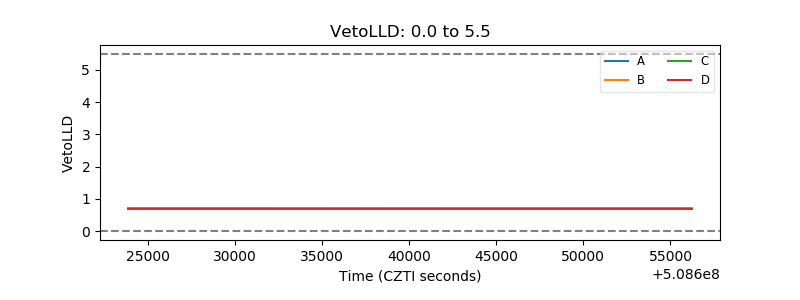 |
| Alpha Counter |  |
| _CPM_Rate | 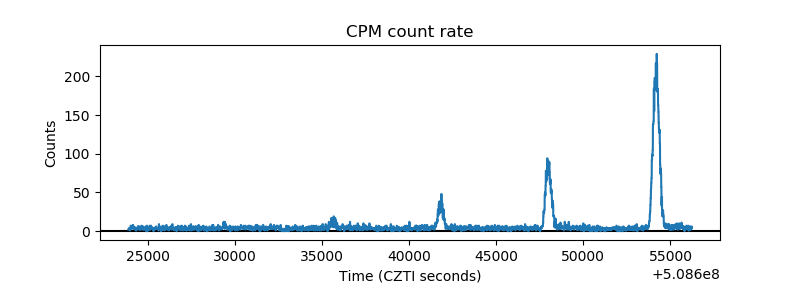 |
| CZT Counter |  |
| +2.5 Volts monitor | 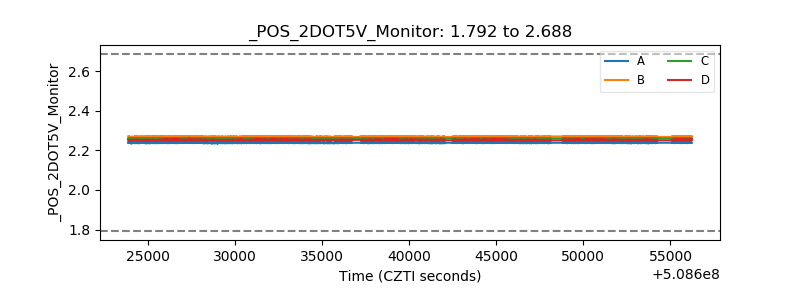 |
| +5 Volts monitor | 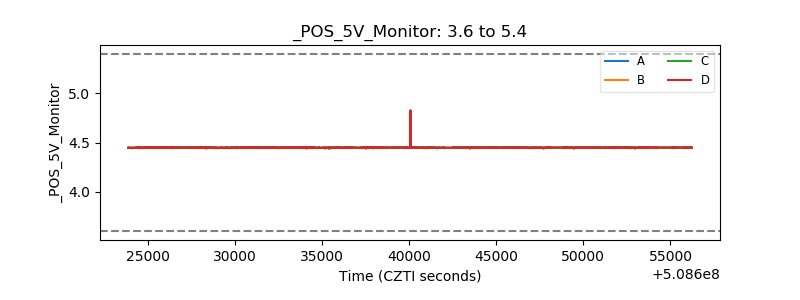 |
| _ROLL_ROT |  |
| _Roll_DEC |  |
| _Roll_RA | 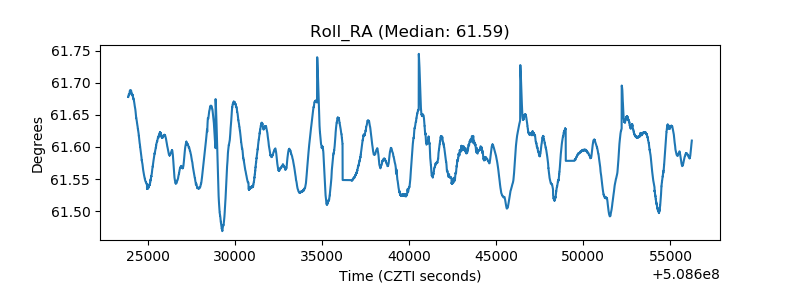 |
| Veto Counter |  |