| Param | Original file | Final file |
|---|---|---|
| Filename | modeM0/AS1A14_083T04_9000006550_56156cztM0_level2.fits | modeM0/AS1A14_083T04_9000006550_56156cztM0_level2_quad_clean.evt |
| Size (bytes) | 392,040,000 | 96,030,720 |
| Size | 373.9 MB | 91.6 MB |
| Events in quadrant A | 3,489,281 | 624,440 |
| Events in quadrant B | 3,168,499 | 679,192 |
| Events in quadrant C | 2,931,171 | 606,009 |
| Events in quadrant D | 4,426,632 | 552,991 |
| Mode SS | |||
|---|---|---|---|
| Quadrant | BADHDUFLAG | Total packets | Discarded packets |
| A | 0 | 130 | 0 |
| B | 0 | 130 | 0 |
| C | 0 | 130 | 0 |
| D | 0 | 130 | 0 |
| Mode M9 | |||
|---|---|---|---|
| Quadrant | BADHDUFLAG | Total packets | Discarded packets |
| A | 0 | 11 | 0 |
| B | 0 | 11 | 0 |
| C | 0 | 11 | 0 |
| D | 0 | 11 | 0 |
| Mode M0 | |||
|---|---|---|---|
| Quadrant | BADHDUFLAG | Total packets | Discarded packets |
| A | 0 | 14663 | 1 |
| B | 0 | 13830 | 1 |
| C | 0 | 13430 | 1 |
| D | 0 | 17663 | 1 |
| Quadrant | Total seconds | Saturated seconds | Saturation percentage |
|---|---|---|---|
| A | 6380 | 158 | 2.476489% |
| B | 6380 | 101 | 1.583072% |
| C | 6381 | 67 | 1.049992% |
| D | 6381 | 246 | 3.855195% |
Noise dominated data is calculated using 1-second bins in cleaned event files. If a bin has >2000 counts, and if more than 50% of those come from <1% of pixels, then it is considered to be noise-dominated and hence unusable.
| Quadrant | # 1 sec bins | Bins with >0 counts | Bins with >2000 counts | High rate bins dominated by noise | Noise dominated (total time) | Noise dominated (detector-on time) | Marked lightcurve |
|---|---|---|---|---|---|---|---|
| A | 7450 | 6381 | 79 | 79 | 1.06% | 1.24% |  |
| B | 7450 | 6381 | 14 | 14 | 0.19% | 0.22% |  |
| C | 7451 | 6382 | 11 | 11 | 0.15% | 0.17% |  |
| D | 7451 | 6382 | 152 | 152 | 2.04% | 2.38% |  |
Top three noisy pixels from each quadrant. If the there are fewer than three noisy pixels in the level2.evt file, extra rows are filled as -1
| Pixel properties | Quadrant properties | ||||||
|---|---|---|---|---|---|---|---|
| Quadrant | DetID | PixID | Counts | Sigma | Mean | Median | Sigma |
| A | 7 | 64 | 260382 | 1510.93 | 697 | 681 | 171.9 |
| A | 15 | 32 | 170389 | 987.35 | 697 | 681 | 171.9 |
| A | 3 | 14 | 94926 | 548.31 | 697 | 681 | 171.9 |
| B | 10 | 247 | 76347 | 509.33 | 694 | 669 | 148.6 |
| B | 1 | 255 | 71950 | 479.74 | 694 | 669 | 148.6 |
| B | 5 | 185 | 58301 | 387.87 | 694 | 669 | 148.6 |
| C | 12 | 252 | 68352 | 361.41 | 686 | 678 | 187.3 |
| C | 13 | 3 | 65357 | 345.41 | 686 | 678 | 187.3 |
| C | 12 | 249 | 37960 | 199.1 | 686 | 678 | 187.3 |
| D | 8 | 240 | 537376 | 2814.66 | 675 | 645 | 190.7 |
| D | 8 | 160 | 441210 | 2310.36 | 675 | 645 | 190.7 |
| D | 2 | 249 | 197133 | 1030.4 | 675 | 645 | 190.7 |
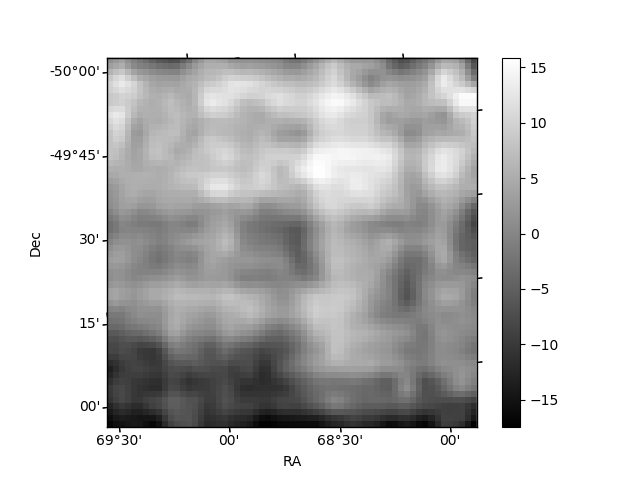
Histogram calculated using DETX and DETY for each event in the final _common_clean file
| Quadrant A | 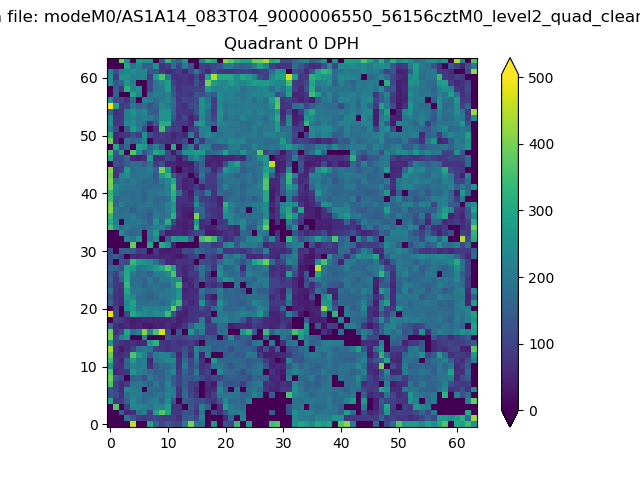 |
 |
Quadrant B |
|---|---|---|---|
| Quadrant D | 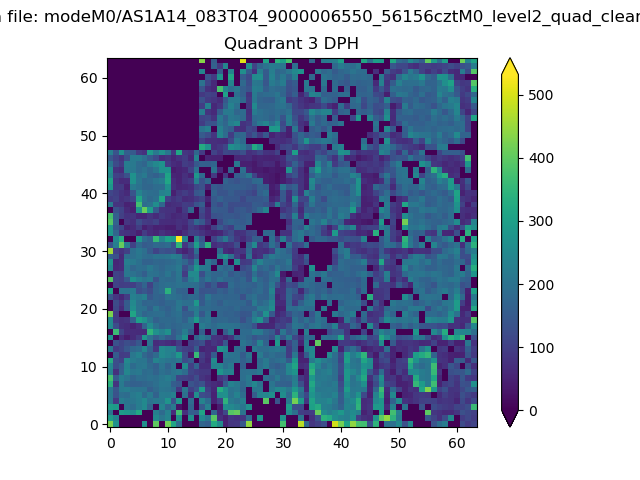 |
 |
Quadrant C |
| Plot type | Count rate plots | Images |
|---|---|---|
| Comparison with Poisson distribution Blue bars denote a histogram of data divided into 1 sec bins. Red curve is a Poisson curve with rate = median count rate of data. |
 |
 |
| Quadrant-wise count rates Data is divided into 100 sec bins |
 |
|
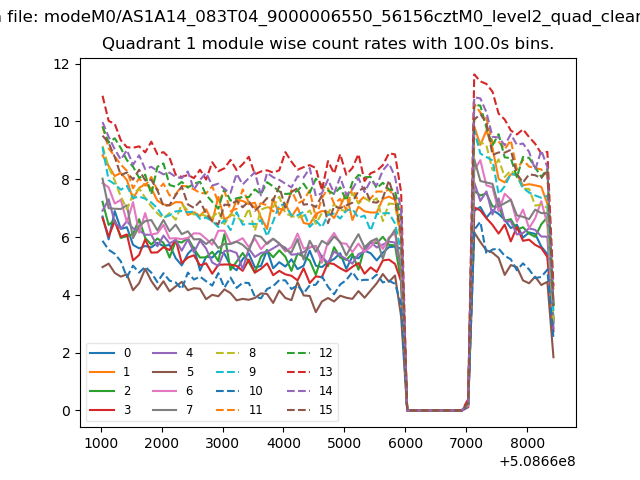
| Module-wise count rates for Quadrant A Data is divided into 100 sec bins |
 |
 |
| Module-wise count rates for Quadrant B Data is divided into 100 sec bins |
 |
 |
| Module-wise count rates for Quadrant C Data is divided into 100 sec bins |
 |
 |
| Module-wise count rates for Quadrant D Data is divided into 100 sec bins |
 |
 |
| Parameter | Plot |
|---|---|
| CZT HV Monitor | 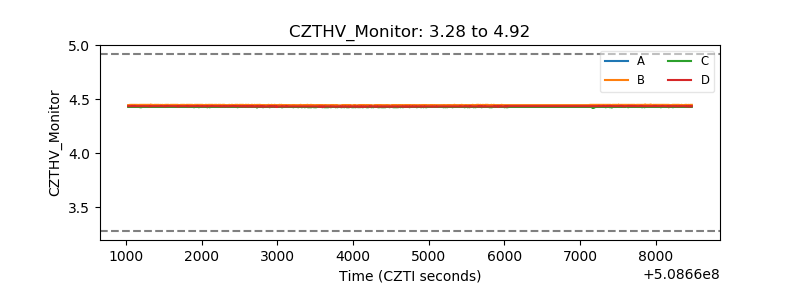 |
| D_VDD |  |
| Temperature 1 | 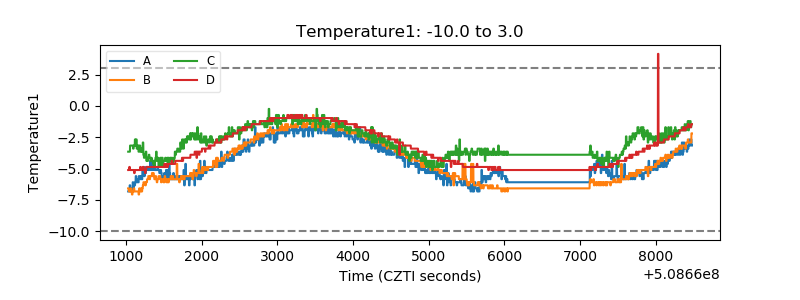 |
| Veto HV Monitor |  |
| Veto LLD |  |
| Alpha Counter | 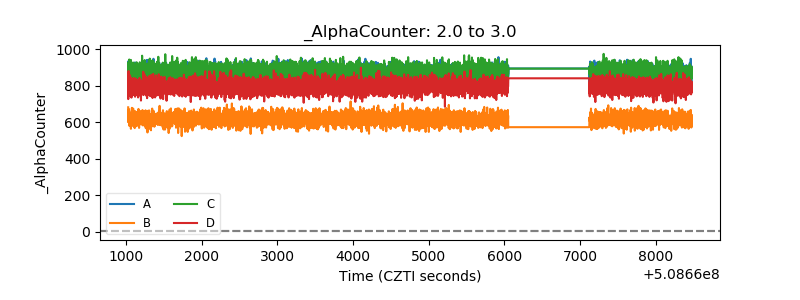 |
| _CPM_Rate | 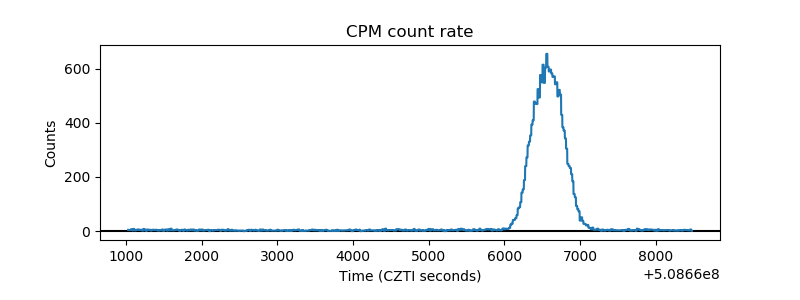 |
| CZT Counter | 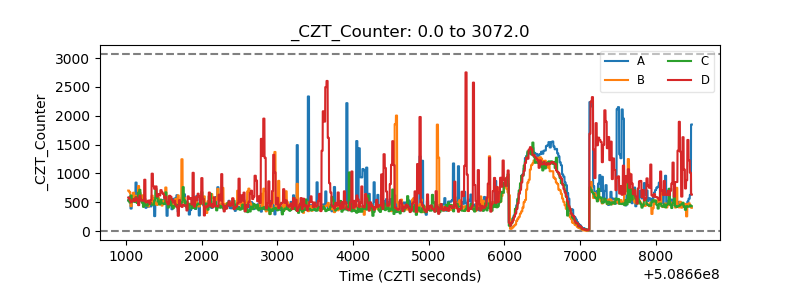 |
| +2.5 Volts monitor | 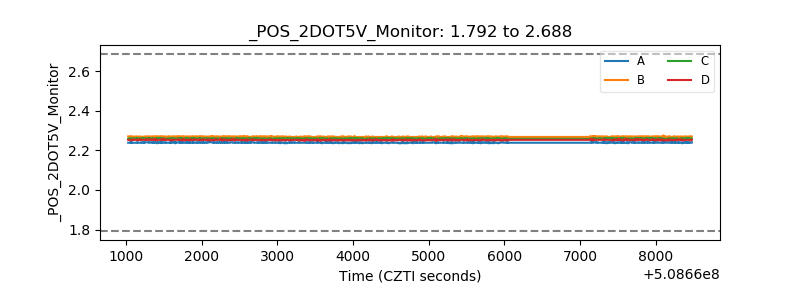 |
| +5 Volts monitor |  |
| _ROLL_ROT |  |
| _Roll_DEC |  |
| _Roll_RA |  |
| Veto Counter |  |