| Param | Original file | Final file |
|---|---|---|
| Filename | modeM0/AS1A14_083T04_9000006550_56158cztM0_level2.fits | modeM0/AS1A14_083T04_9000006550_56158cztM0_level2_quad_clean.evt |
| Size (bytes) | 601,470,720 | 97,387,200 |
| Size | 573.6 MB | 92.9 MB |
| Events in quadrant A | 5,965,295 | 625,165 |
| Events in quadrant B | 4,787,182 | 711,597 |
| Events in quadrant C | 3,041,006 | 655,288 |
| Events in quadrant D | 7,946,596 | 485,516 |
| Mode SS | |||
|---|---|---|---|
| Quadrant | BADHDUFLAG | Total packets | Discarded packets |
| A | 0 | 138 | 0 |
| B | 0 | 138 | 0 |
| C | 0 | 138 | 0 |
| D | 0 | 138 | 0 |
| Mode M9 | |||
|---|---|---|---|
| Quadrant | BADHDUFLAG | Total packets | Discarded packets |
| A | 0 | 11 | 0 |
| B | 0 | 11 | 0 |
| C | 0 | 11 | 0 |
| D | 0 | 11 | 0 |
| Mode M0 | |||
|---|---|---|---|
| Quadrant | BADHDUFLAG | Total packets | Discarded packets |
| A | 0 | 22210 | 4 |
| B | 0 | 18915 | 1 |
| C | 0 | 14043 | 1 |
| D | 0 | 28315 | 1 |
| Quadrant | Total seconds | Saturated seconds | Saturation percentage |
|---|---|---|---|
| A | 6760 | 783 | 11.582840% |
| B | 6760 | 400 | 5.917160% |
| C | 6760 | 92 | 1.360947% |
| D | 6761 | 1528 | 22.600207% |
Noise dominated data is calculated using 1-second bins in cleaned event files. If a bin has >2000 counts, and if more than 50% of those come from <1% of pixels, then it is considered to be noise-dominated and hence unusable.
| Quadrant | # 1 sec bins | Bins with >0 counts | Bins with >2000 counts | High rate bins dominated by noise | Noise dominated (total time) | Noise dominated (detector-on time) | Marked lightcurve |
|---|---|---|---|---|---|---|---|
| A | 7885 | 6761 | 695 | 695 | 8.81% | 10.28% |  |
| B | 7885 | 6761 | 136 | 136 | 1.72% | 2.01% | 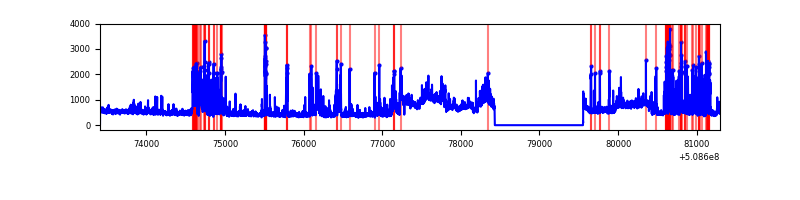 |
| C | 7885 | 6761 | 7 | 7 | 0.09% | 0.10% |  |
| D | 7886 | 6762 | 1344 | 1344 | 17.04% | 19.88% |  |
Top three noisy pixels from each quadrant. If the there are fewer than three noisy pixels in the level2.evt file, extra rows are filled as -1
| Pixel properties | Quadrant properties | ||||||
|---|---|---|---|---|---|---|---|
| Quadrant | DetID | PixID | Counts | Sigma | Mean | Median | Sigma |
| A | 15 | 32 | 1836435 | 10275.33 | 728 | 712 | 178.7 |
| A | 0 | 8 | 499886 | 2794.09 | 728 | 712 | 178.7 |
| A | 3 | 14 | 292678 | 1634.26 | 728 | 712 | 178.7 |
| B | 5 | 172 | 881558 | 5641.74 | 733 | 706 | 156.1 |
| B | 5 | 185 | 586137 | 3749.6 | 733 | 706 | 156.1 |
| B | 10 | 247 | 120538 | 767.51 | 733 | 706 | 156.1 |
| C | 12 | 252 | 92154 | 459.69 | 730 | 721 | 198.9 |
| C | 6 | 223 | 36881 | 181.8 | 730 | 721 | 198.9 |
| C | 15 | 230 | 28080 | 137.55 | 730 | 721 | 198.9 |
| D | 8 | 240 | 2569223 | 13794.96 | 657 | 627 | 186.2 |
| D | 2 | 62 | 1311116 | 7038.14 | 657 | 627 | 186.2 |
| D | 11 | 129 | 458657 | 2459.91 | 657 | 627 | 186.2 |
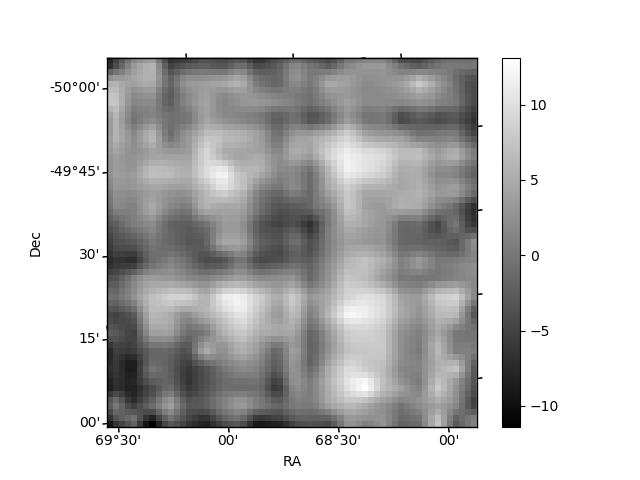
Histogram calculated using DETX and DETY for each event in the final _common_clean file
| Quadrant A | 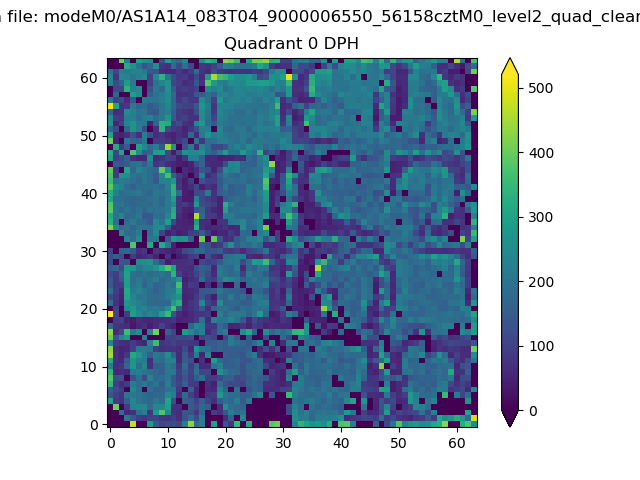 |
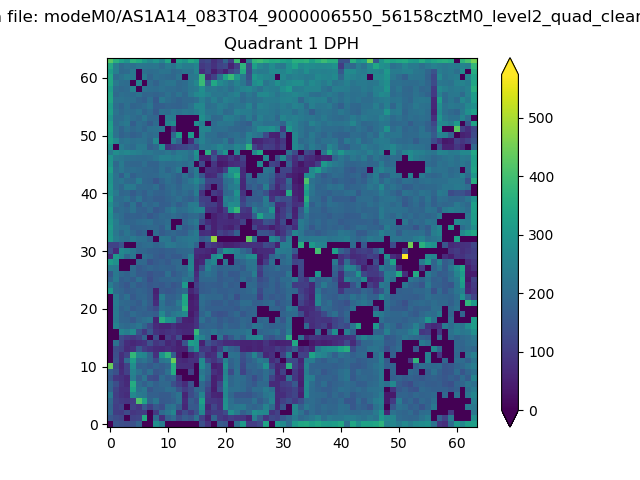 |
Quadrant B |
|---|---|---|---|
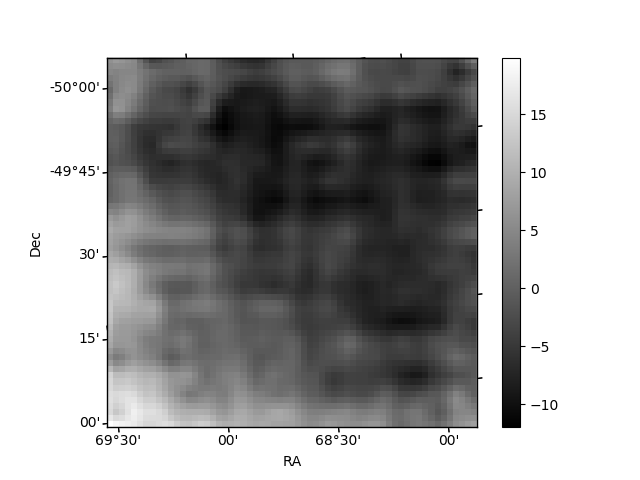
| Quadrant D |  |
 |
Quadrant C |
| Plot type | Count rate plots | Images |
|---|---|---|
| Comparison with Poisson distribution Blue bars denote a histogram of data divided into 1 sec bins. Red curve is a Poisson curve with rate = median count rate of data. |
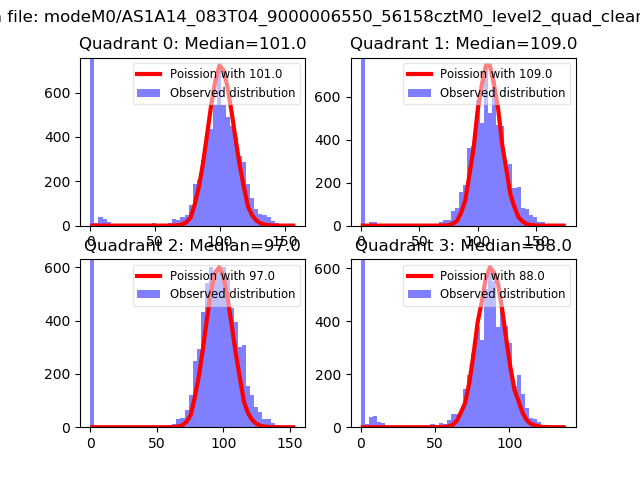 |
 |
| Quadrant-wise count rates Data is divided into 100 sec bins |
 |
|
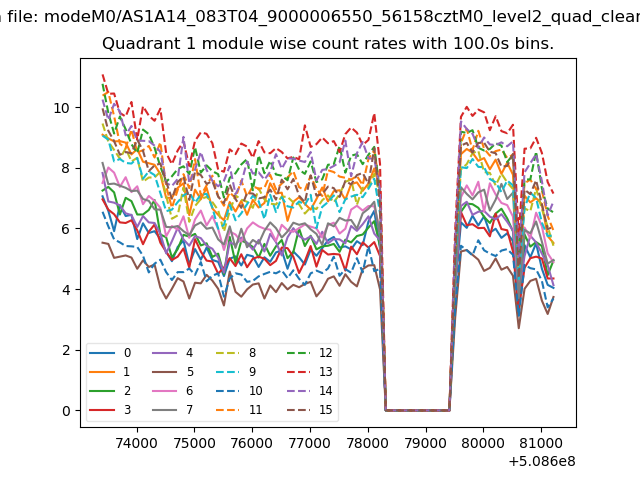
| Module-wise count rates for Quadrant A Data is divided into 100 sec bins |
 |
 |
| Module-wise count rates for Quadrant B Data is divided into 100 sec bins |
 |
 |
| Module-wise count rates for Quadrant C Data is divided into 100 sec bins |
 |
 |
| Module-wise count rates for Quadrant D Data is divided into 100 sec bins |
 |
 |
| Parameter | Plot |
|---|---|
| CZT HV Monitor | 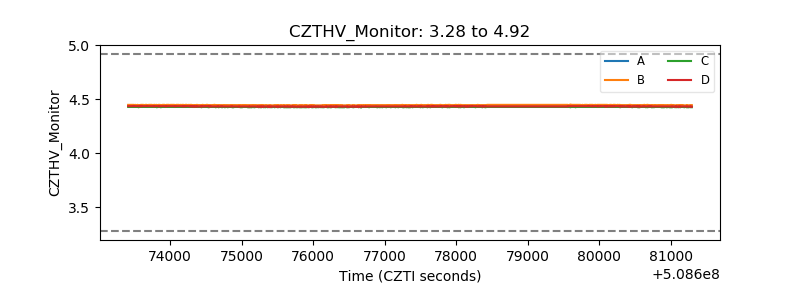 |
| D_VDD | 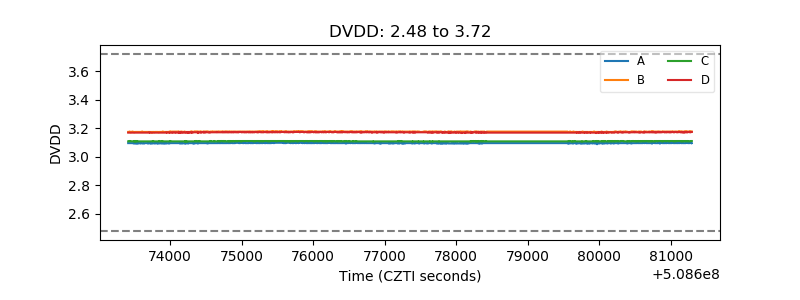 |
| Temperature 1 |  |
| Veto HV Monitor |  |
| Veto LLD |  |
| Alpha Counter |  |
| _CPM_Rate | 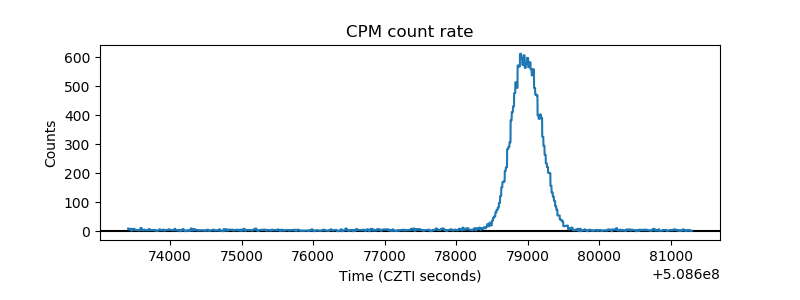 |
| CZT Counter |  |
| +2.5 Volts monitor |  |
| +5 Volts monitor | 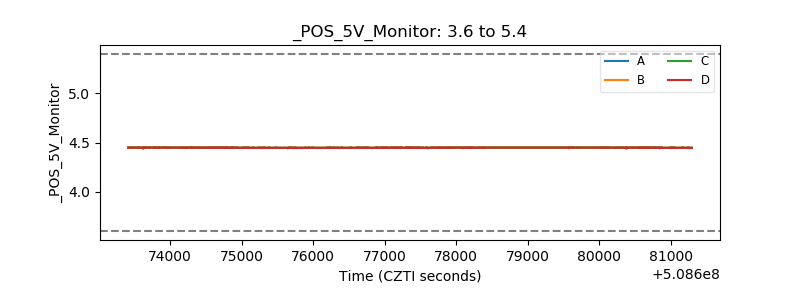 |
| _ROLL_ROT |  |
| _Roll_DEC | 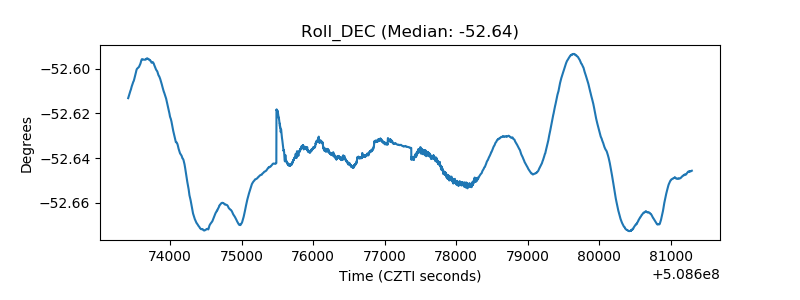 |
| _Roll_RA |  |
| Veto Counter |  |