| Param | Original file | Final file |
|---|---|---|
| Filename | modeM0/AS1A14_083T04_9000006550_56159cztM0_level2.fits | modeM0/AS1A14_083T04_9000006550_56159cztM0_level2_quad_clean.evt |
| Size (bytes) | 587,609,280 | 88,968,960 |
| Size | 560.4 MB | 84.8 MB |
| Events in quadrant A | 4,938,572 | 589,104 |
| Events in quadrant B | 3,845,244 | 667,769 |
| Events in quadrant C | 4,256,877 | 580,614 |
| Events in quadrant D | 8,212,300 | 408,232 |
| Mode SS | |||
|---|---|---|---|
| Quadrant | BADHDUFLAG | Total packets | Discarded packets |
| A | 0 | 132 | 0 |
| B | 0 | 132 | 0 |
| C | 0 | 132 | 0 |
| D | 0 | 132 | 0 |
| Mode M9 | |||
|---|---|---|---|
| Quadrant | BADHDUFLAG | Total packets | Discarded packets |
| A | 0 | 11 | 0 |
| B | 0 | 11 | 0 |
| C | 0 | 11 | 0 |
| D | 0 | 11 | 0 |
| Mode M0 | |||
|---|---|---|---|
| Quadrant | BADHDUFLAG | Total packets | Discarded packets |
| A | 0 | 19137 | 1 |
| B | 0 | 16010 | 1 |
| C | 0 | 17510 | 1 |
| D | 0 | 28941 | 1 |
| Quadrant | Total seconds | Saturated seconds | Saturation percentage |
|---|---|---|---|
| A | 6416 | 589 | 9.180175% |
| B | 6416 | 246 | 3.834165% |
| C | 6417 | 345 | 5.376344% |
| D | 6417 | 1917 | 29.873773% |
Noise dominated data is calculated using 1-second bins in cleaned event files. If a bin has >2000 counts, and if more than 50% of those come from <1% of pixels, then it is considered to be noise-dominated and hence unusable.
| Quadrant | # 1 sec bins | Bins with >0 counts | Bins with >2000 counts | High rate bins dominated by noise | Noise dominated (total time) | Noise dominated (detector-on time) | Marked lightcurve |
|---|---|---|---|---|---|---|---|
| A | 7526 | 6417 | 539 | 539 | 7.16% | 8.40% | 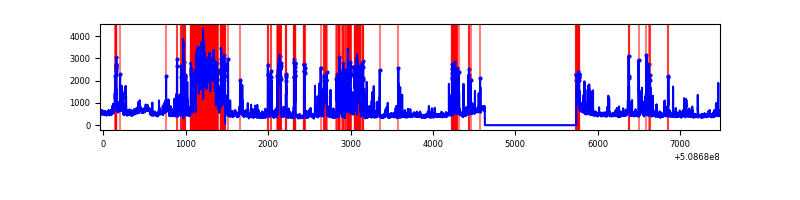 |
| B | 7526 | 6417 | 108 | 108 | 1.44% | 1.68% | 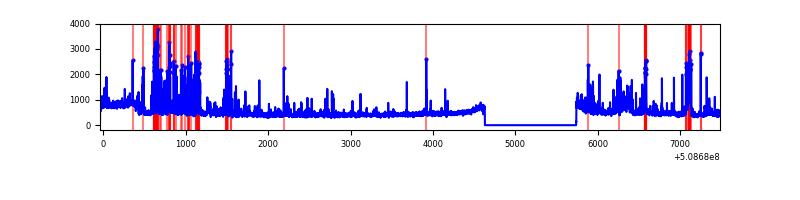 |
| C | 7527 | 6418 | 338 | 338 | 4.49% | 5.27% | 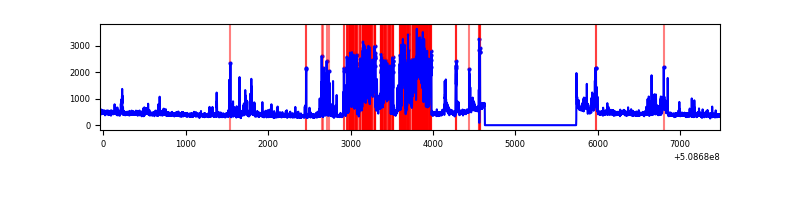 |
| D | 7527 | 6418 | 1564 | 1564 | 20.78% | 24.37% | 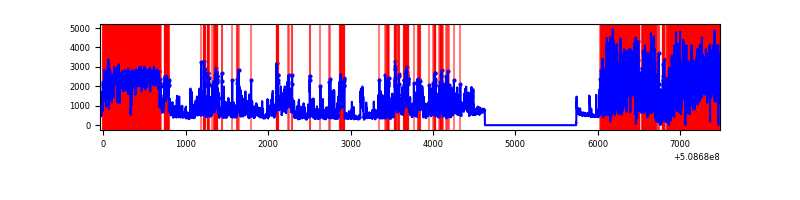 |
Top three noisy pixels from each quadrant. If the there are fewer than three noisy pixels in the level2.evt file, extra rows are filled as -1
| Pixel properties | Quadrant properties | ||||||
|---|---|---|---|---|---|---|---|
| Quadrant | DetID | PixID | Counts | Sigma | Mean | Median | Sigma |
| A | 15 | 32 | 1253514 | 7496.21 | 668 | 653 | 167.1 |
| A | 0 | 8 | 420664 | 2513.04 | 668 | 653 | 167.1 |
| A | 12 | 115 | 172624 | 1028.95 | 668 | 653 | 167.1 |
| B | 5 | 185 | 388764 | 2663.23 | 682 | 660 | 145.7 |
| B | 5 | 172 | 232129 | 1588.38 | 682 | 660 | 145.7 |
| B | 10 | 247 | 120709 | 823.8 | 682 | 660 | 145.7 |
| C | 12 | 252 | 1564639 | 8705.06 | 655 | 649 | 179.7 |
| C | 6 | 9 | 47144 | 258.79 | 655 | 649 | 179.7 |
| C | 6 | 223 | 38803 | 212.36 | 655 | 649 | 179.7 |
| D | 8 | 129 | 2395612 | 15374.95 | 545 | 521 | 155.8 |
| D | 8 | 240 | 1823428 | 11701.89 | 545 | 521 | 155.8 |
| D | 2 | 62 | 901311 | 5782.49 | 545 | 521 | 155.8 |
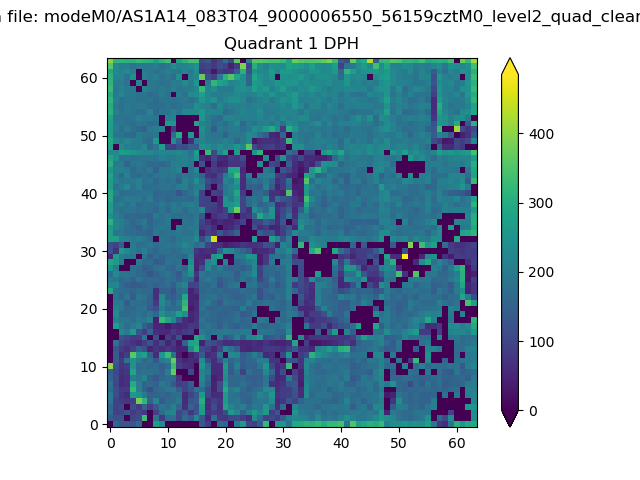
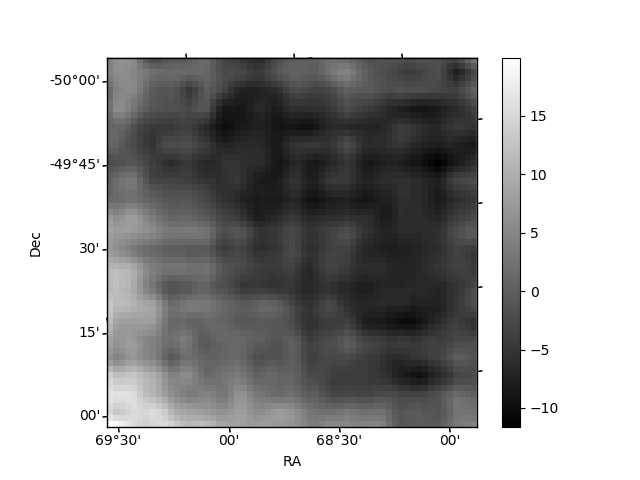
Histogram calculated using DETX and DETY for each event in the final _common_clean file
| Quadrant A |  |
 |
Quadrant B |
|---|---|---|---|
| Quadrant D |  |
 |
Quadrant C |
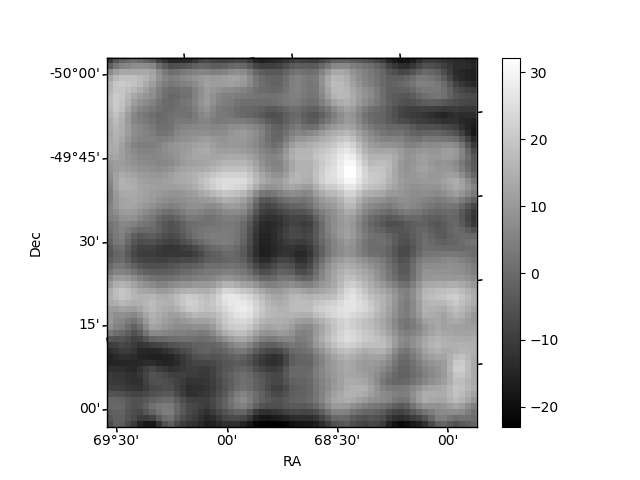
| Plot type | Count rate plots | Images |
|---|---|---|
| Comparison with Poisson distribution Blue bars denote a histogram of data divided into 1 sec bins. Red curve is a Poisson curve with rate = median count rate of data. |
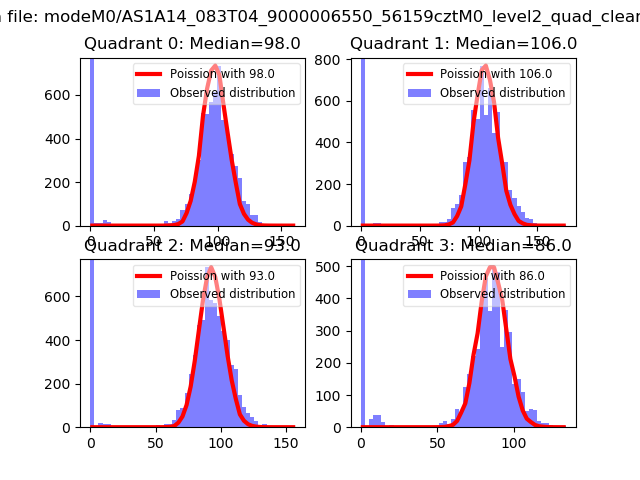 |
 |
| Quadrant-wise count rates Data is divided into 100 sec bins |
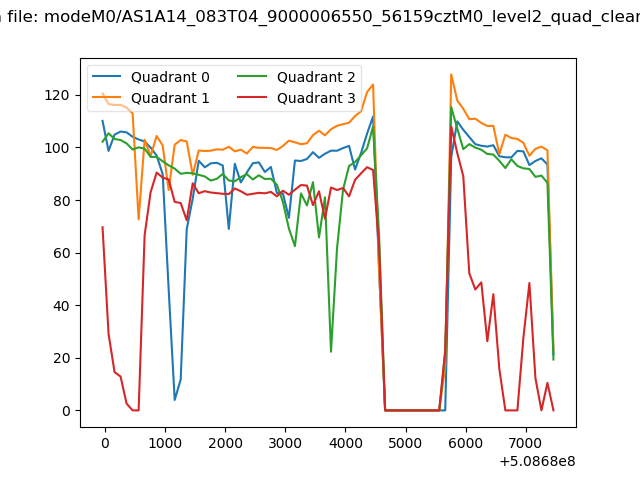 |
|
| Module-wise count rates for Quadrant A Data is divided into 100 sec bins |
 |
 |
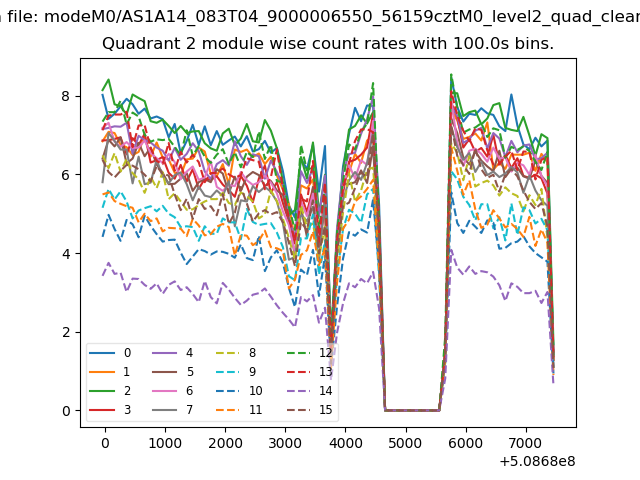
| Module-wise count rates for Quadrant B Data is divided into 100 sec bins |
 |
 |
| Module-wise count rates for Quadrant C Data is divided into 100 sec bins |
 |
 |
| Module-wise count rates for Quadrant D Data is divided into 100 sec bins |
 |
 |
| Parameter | Plot |
|---|---|
| CZT HV Monitor | 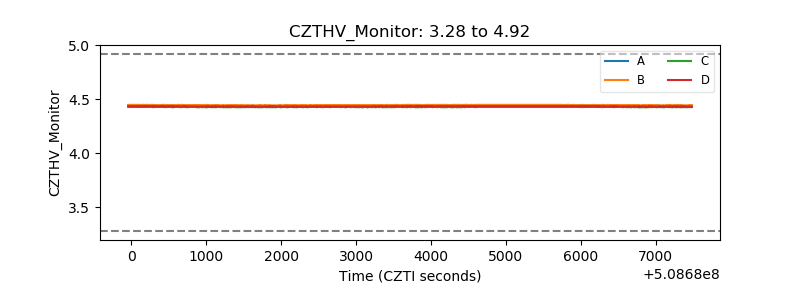 |
| D_VDD | 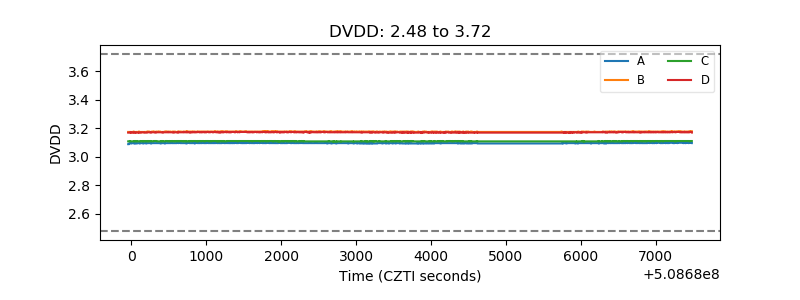 |
| Temperature 1 | 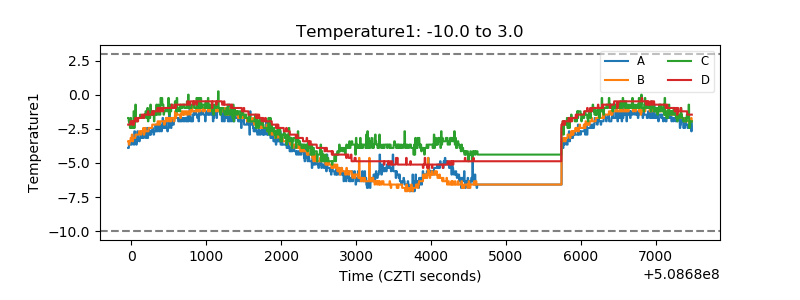 |
| Veto HV Monitor | 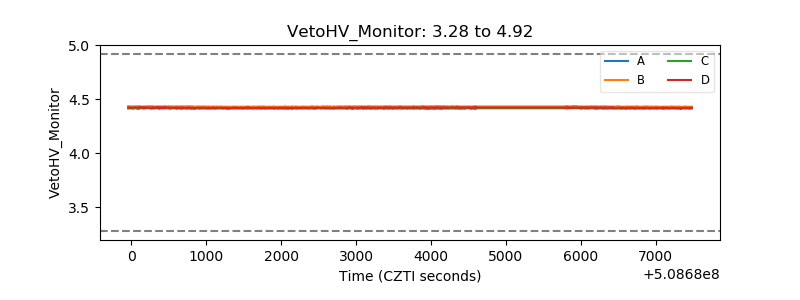 |
| Veto LLD | 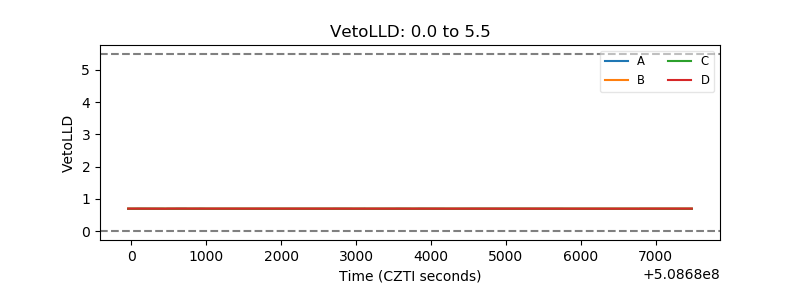 |
| Alpha Counter |  |
| _CPM_Rate |  |
| CZT Counter | 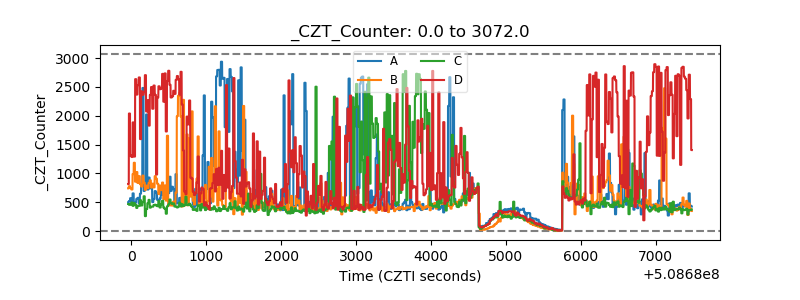 |
| +2.5 Volts monitor |  |
| +5 Volts monitor |  |
| _ROLL_ROT | 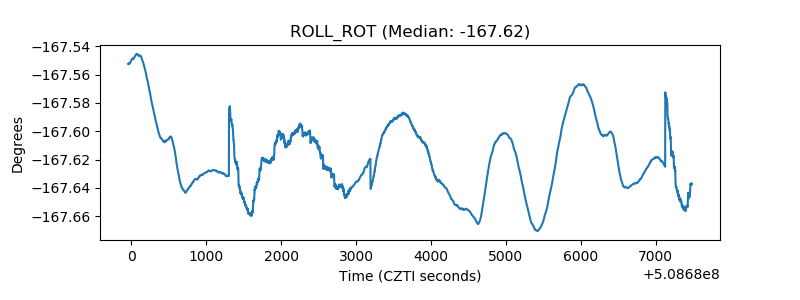 |
| _Roll_DEC | 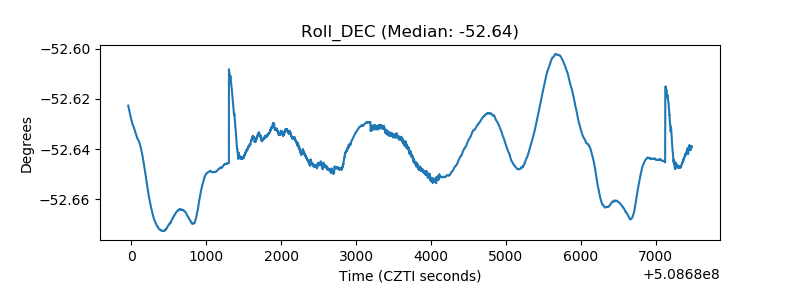 |
| _Roll_RA | 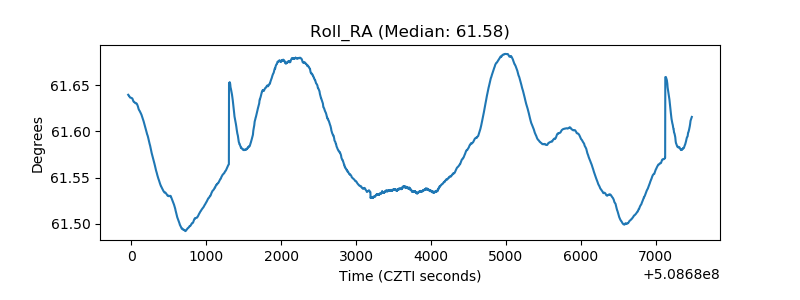 |
| Veto Counter | 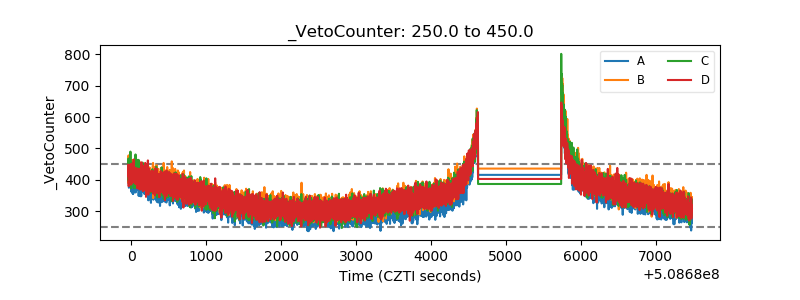 |