| Param | Original file | Final file |
|---|---|---|
| Filename | modeM0/AS1A14_083T04_9000006550_56160cztM0_level2.fits | modeM0/AS1A14_083T04_9000006550_56160cztM0_level2_quad_clean.evt |
| Size (bytes) | 643,348,800 | 79,009,920 |
| Size | 613.5 MB | 75.3 MB |
| Events in quadrant A | 5,381,219 | 474,565 |
| Events in quadrant B | 3,388,286 | 631,915 |
| Events in quadrant C | 3,159,588 | 563,879 |
| Events in quadrant D | 11,401,100 | 286,450 |
| Mode SS | |||
|---|---|---|---|
| Quadrant | BADHDUFLAG | Total packets | Discarded packets |
| A | 0 | 128 | 0 |
| B | 0 | 128 | 0 |
| C | 0 | 128 | 0 |
| D | 0 | 128 | 0 |
| Mode M9 | |||
|---|---|---|---|
| Quadrant | BADHDUFLAG | Total packets | Discarded packets |
| A | 0 | 9 | 0 |
| B | 0 | 9 | 0 |
| C | 0 | 9 | 0 |
| D | 0 | 9 | 0 |
| Mode M0 | |||
|---|---|---|---|
| Quadrant | BADHDUFLAG | Total packets | Discarded packets |
| A | 0 | 20451 | 1 |
| B | 0 | 14530 | 1 |
| C | 0 | 14375 | 1 |
| D | 0 | 38190 | 1 |
| Quadrant | Total seconds | Saturated seconds | Saturation percentage |
|---|---|---|---|
| A | 6229 | 1409 | 22.620003% |
| B | 6230 | 159 | 2.552167% |
| C | 6230 | 103 | 1.653291% |
| D | 6230 | 3205 | 51.444623% |
Noise dominated data is calculated using 1-second bins in cleaned event files. If a bin has >2000 counts, and if more than 50% of those come from <1% of pixels, then it is considered to be noise-dominated and hence unusable.
| Quadrant | # 1 sec bins | Bins with >0 counts | Bins with >2000 counts | High rate bins dominated by noise | Noise dominated (total time) | Noise dominated (detector-on time) | Marked lightcurve |
|---|---|---|---|---|---|---|---|
| A | 7188 | 6228 | 572 | 572 | 7.96% | 9.18% |  |
| B | 7190 | 6231 | 51 | 51 | 0.71% | 0.82% | 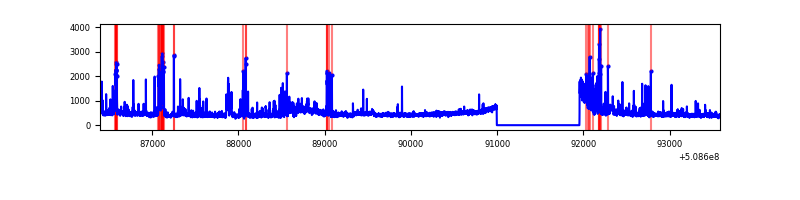 |
| C | 7190 | 6231 | 98 | 98 | 1.36% | 1.57% |  |
| D | 7190 | 6231 | 2699 | 2699 | 37.54% | 43.32% |  |
Top three noisy pixels from each quadrant. If the there are fewer than three noisy pixels in the level2.evt file, extra rows are filled as -1
| Pixel properties | Quadrant properties | ||||||
|---|---|---|---|---|---|---|---|
| Quadrant | DetID | PixID | Counts | Sigma | Mean | Median | Sigma |
| A | 9 | 250 | 2312897 | 16777.27 | 553 | 540 | 137.8 |
| A | 15 | 32 | 437812 | 3172.62 | 553 | 540 | 137.8 |
| A | 0 | 8 | 116033 | 837.96 | 553 | 540 | 137.8 |
| B | 5 | 185 | 196657 | 1410.52 | 651 | 627 | 139.0 |
| B | 5 | 172 | 120833 | 864.93 | 651 | 627 | 139.0 |
| B | 0 | 157 | 79173 | 565.17 | 651 | 627 | 139.0 |
| C | 12 | 252 | 651524 | 3780.01 | 629 | 620 | 172.2 |
| C | 6 | 223 | 18210 | 102.15 | 629 | 620 | 172.2 |
| C | 15 | 230 | 12273 | 67.67 | 629 | 620 | 172.2 |
| D | 8 | 129 | 8278791 | 64572.62 | 447 | 426 | 128.2 |
| D | 8 | 240 | 963562 | 7512.62 | 447 | 426 | 128.2 |
| D | 2 | 62 | 150626 | 1171.58 | 447 | 426 | 128.2 |
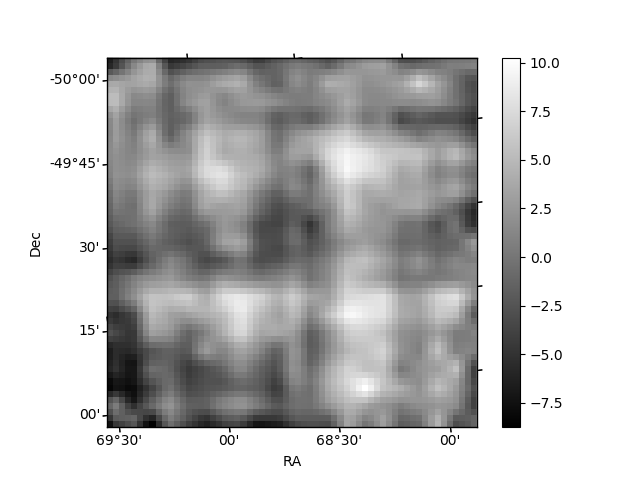
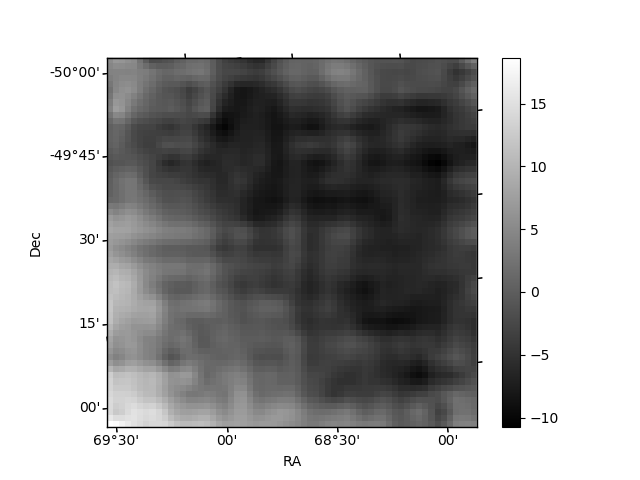
Histogram calculated using DETX and DETY for each event in the final _common_clean file
| Quadrant A | 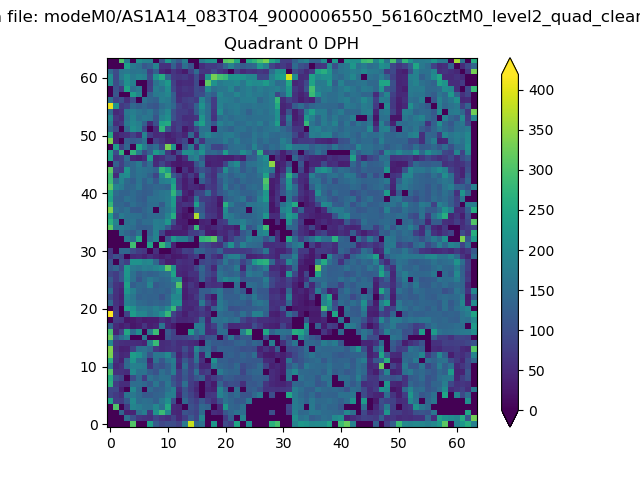 |
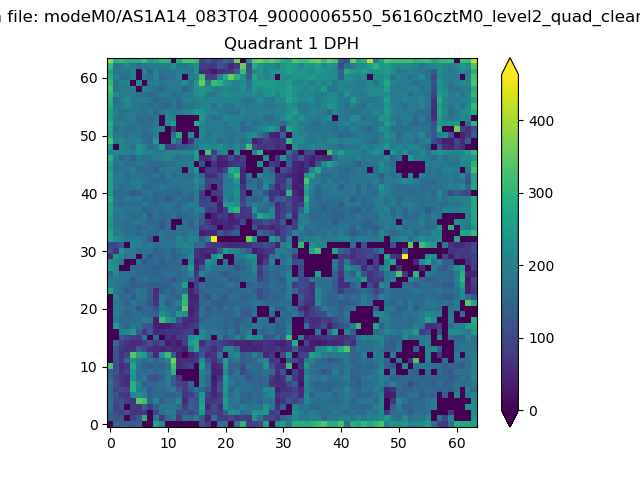 |
Quadrant B |
|---|---|---|---|
| Quadrant D |  |
 |
Quadrant C |
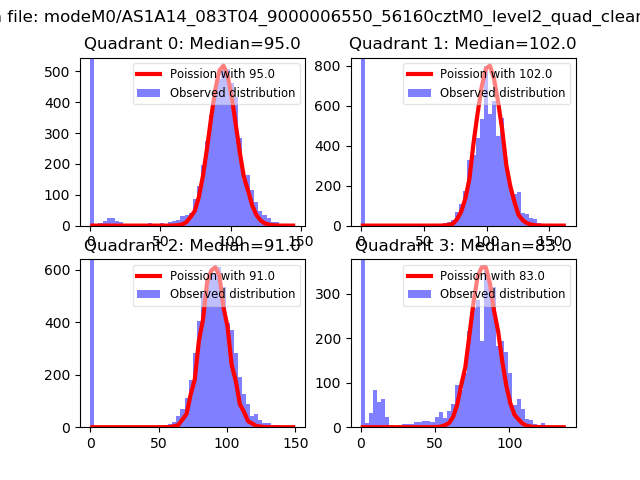
| Plot type | Count rate plots | Images |
|---|---|---|
| Comparison with Poisson distribution Blue bars denote a histogram of data divided into 1 sec bins. Red curve is a Poisson curve with rate = median count rate of data. |
 |
 |
| Quadrant-wise count rates Data is divided into 100 sec bins |
 |
|
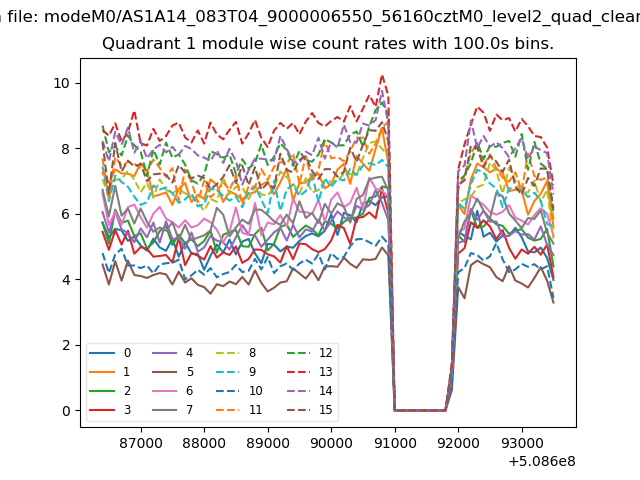
| Module-wise count rates for Quadrant A Data is divided into 100 sec bins |
 |
 |
| Module-wise count rates for Quadrant B Data is divided into 100 sec bins |
 |
 |
| Module-wise count rates for Quadrant C Data is divided into 100 sec bins |
 |
 |
| Module-wise count rates for Quadrant D Data is divided into 100 sec bins |
 |
 |
| Parameter | Plot |
|---|---|
| CZT HV Monitor | 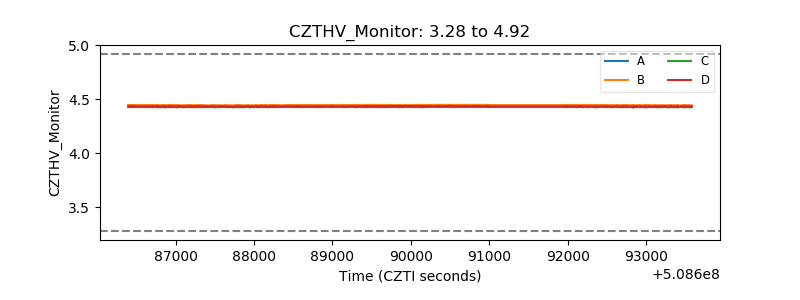 |
| D_VDD | 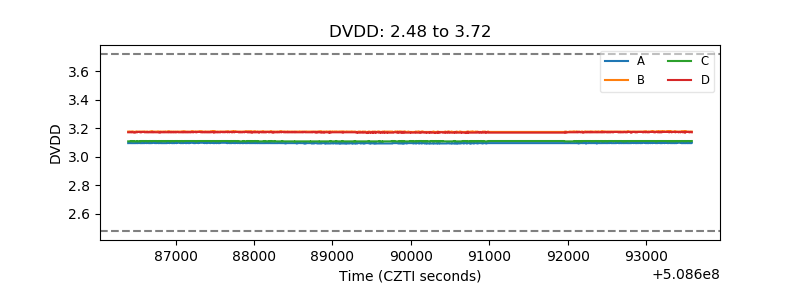 |
| Temperature 1 |  |
| Veto HV Monitor |  |
| Veto LLD |  |
| Alpha Counter |  |
| _CPM_Rate | 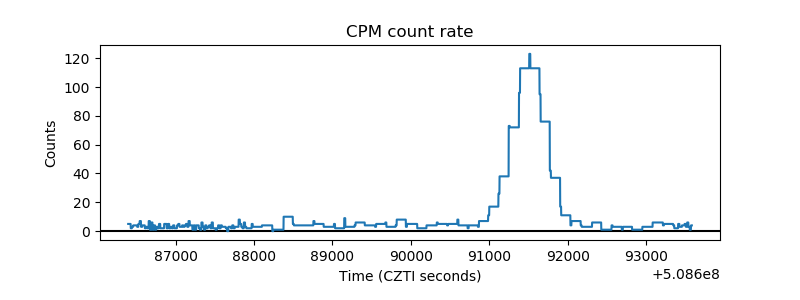 |
| CZT Counter |  |
| +2.5 Volts monitor |  |
| +5 Volts monitor | 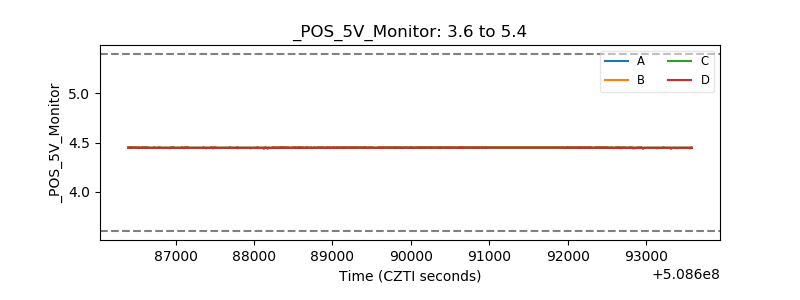 |
| _ROLL_ROT |  |
| _Roll_DEC |  |
| _Roll_RA | 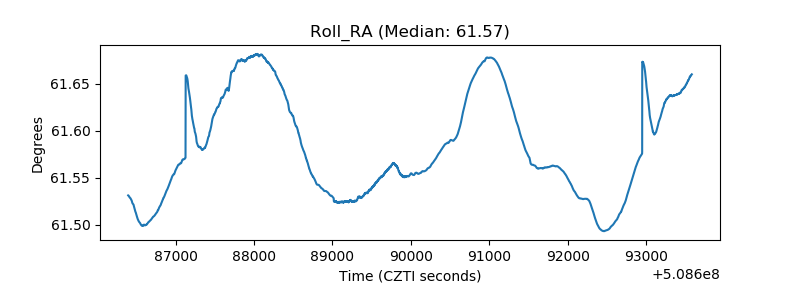 |
| Veto Counter |  |