| Param | Original file | Final file |
|---|---|---|
| Filename | modeM0/AS1A14_083T04_9000006550_56161cztM0_level2.fits | modeM0/AS1A14_083T04_9000006550_56161cztM0_level2_quad_clean.evt |
| Size (bytes) | 780,935,040 | 74,128,320 |
| Size | 744.8 MB | 70.7 MB |
| Events in quadrant A | 11,478,806 | 145,978 |
| Events in quadrant B | 3,626,529 | 657,963 |
| Events in quadrant C | 3,499,345 | 583,515 |
| Events in quadrant D | 9,792,330 | 398,949 |
| Mode SS | |||
|---|---|---|---|
| Quadrant | BADHDUFLAG | Total packets | Discarded packets |
| A | 0 | 132 | 0 |
| B | 0 | 132 | 0 |
| C | 0 | 132 | 0 |
| D | 0 | 132 | 0 |
| Mode M9 | |||
|---|---|---|---|
| Quadrant | BADHDUFLAG | Total packets | Discarded packets |
| A | 0 | 6 | 0 |
| B | 0 | 6 | 0 |
| C | 0 | 6 | 0 |
| D | 0 | 6 | 0 |
| Mode M0 | |||
|---|---|---|---|
| Quadrant | BADHDUFLAG | Total packets | Discarded packets |
| A | 0 | 38624 | 1 |
| B | 0 | 15552 | 5 |
| C | 0 | 15638 | 1 |
| D | 0 | 33668 | 1 |
| Quadrant | Total seconds | Saturated seconds | Saturation percentage |
|---|---|---|---|
| A | 6566 | 5235 | 79.728906% |
| B | 6565 | 161 | 2.452399% |
| C | 6566 | 169 | 2.573865% |
| D | 6566 | 2147 | 32.698751% |
Noise dominated data is calculated using 1-second bins in cleaned event files. If a bin has >2000 counts, and if more than 50% of those come from <1% of pixels, then it is considered to be noise-dominated and hence unusable.
| Quadrant | # 1 sec bins | Bins with >0 counts | Bins with >2000 counts | High rate bins dominated by noise | Noise dominated (total time) | Noise dominated (detector-on time) | Marked lightcurve |
|---|---|---|---|---|---|---|---|
| A | 7086 | 6563 | 2416 | 2416 | 34.10% | 36.81% |  |
| B | 7085 | 6566 | 55 | 55 | 0.78% | 0.84% |  |
| C | 7086 | 6567 | 141 | 141 | 1.99% | 2.15% |  |
| D | 7086 | 6567 | 2017 | 2017 | 28.46% | 30.71% |  |
Top three noisy pixels from each quadrant. If the there are fewer than three noisy pixels in the level2.evt file, extra rows are filled as -1
| Pixel properties | Quadrant properties | ||||||
|---|---|---|---|---|---|---|---|
| Quadrant | DetID | PixID | Counts | Sigma | Mean | Median | Sigma |
| A | 9 | 250 | 9168312 | 122015.13 | 299 | 291 | 75.1 |
| A | 15 | 32 | 554438 | 7375.02 | 299 | 291 | 75.1 |
| A | 12 | 115 | 311865 | 4146.67 | 299 | 291 | 75.1 |
| B | 5 | 185 | 304700 | 2075.94 | 688 | 664 | 146.5 |
| B | 4 | 171 | 87975 | 596.16 | 688 | 664 | 146.5 |
| B | 1 | 255 | 82970 | 561.98 | 688 | 664 | 146.5 |
| C | 12 | 252 | 747503 | 4080.99 | 664 | 657 | 183.0 |
| C | 12 | 241 | 99529 | 540.27 | 664 | 657 | 183.0 |
| C | 6 | 223 | 47903 | 258.17 | 664 | 657 | 183.0 |
| D | 8 | 129 | 5697432 | 36019.54 | 556 | 531 | 158.2 |
| D | 8 | 240 | 1174859 | 7424.87 | 556 | 531 | 158.2 |
| D | 2 | 249 | 227388 | 1434.34 | 556 | 531 | 158.2 |
Histogram calculated using DETX and DETY for each event in the final _common_clean file
| Quadrant A | 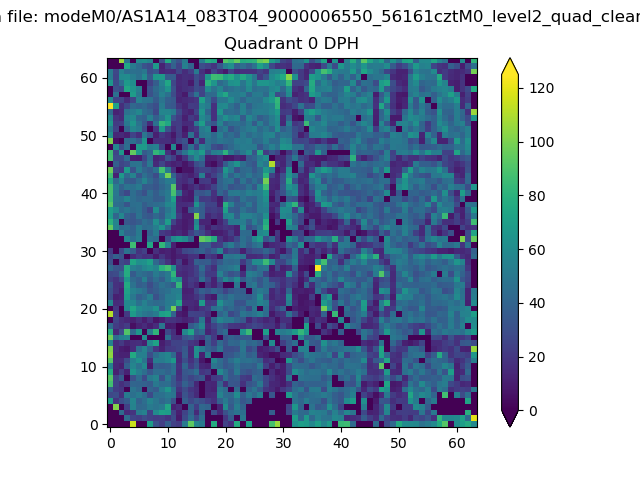 |
 |
Quadrant B |
|---|---|---|---|
| Quadrant D | 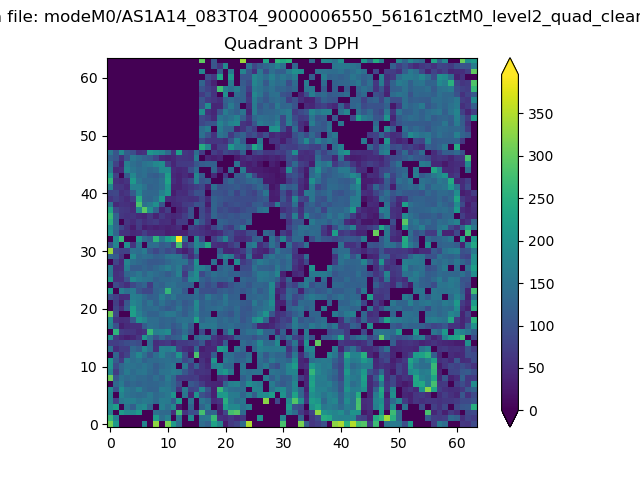 |
 |
Quadrant C |
| Plot type | Count rate plots | Images |
|---|---|---|
| Comparison with Poisson distribution Blue bars denote a histogram of data divided into 1 sec bins. Red curve is a Poisson curve with rate = median count rate of data. |
 |
 |
| Quadrant-wise count rates Data is divided into 100 sec bins |
 |
|
| Module-wise count rates for Quadrant A Data is divided into 100 sec bins |
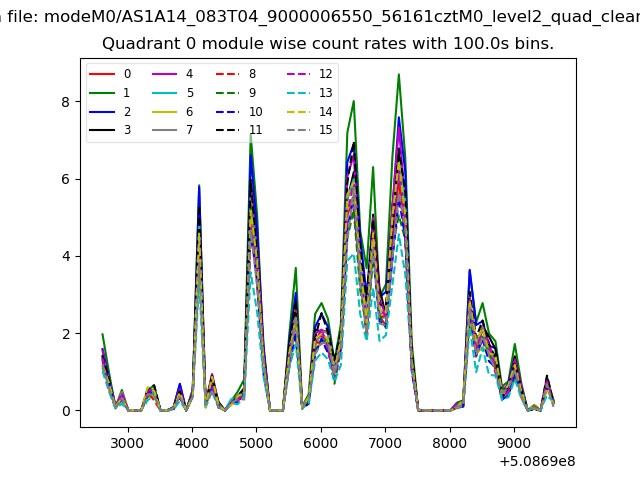 |
 |
| Module-wise count rates for Quadrant B Data is divided into 100 sec bins |
 |
 |
| Module-wise count rates for Quadrant C Data is divided into 100 sec bins |
 |
 |
| Module-wise count rates for Quadrant D Data is divided into 100 sec bins |
 |
 |
| Parameter | Plot |
|---|---|
| CZT HV Monitor | 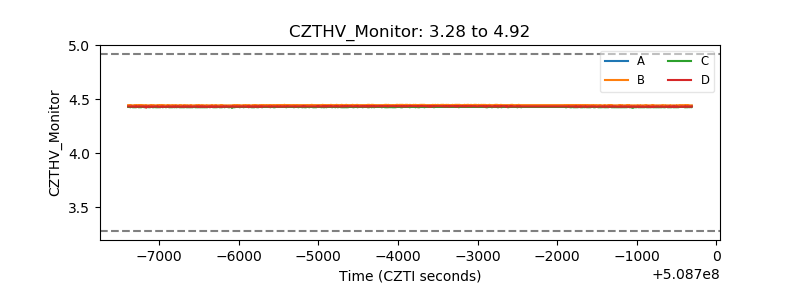 |
| D_VDD |  |
| Temperature 1 | 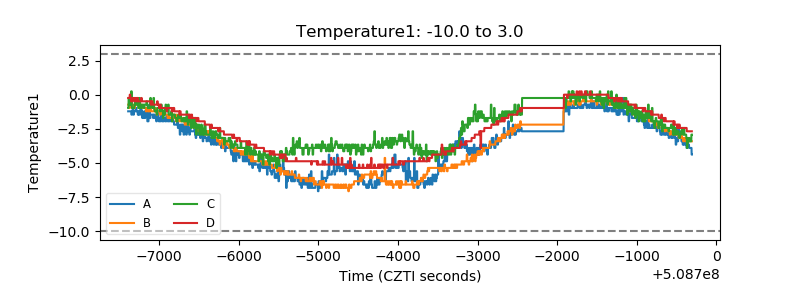 |
| Veto HV Monitor |  |
| Veto LLD |  |
| Alpha Counter | 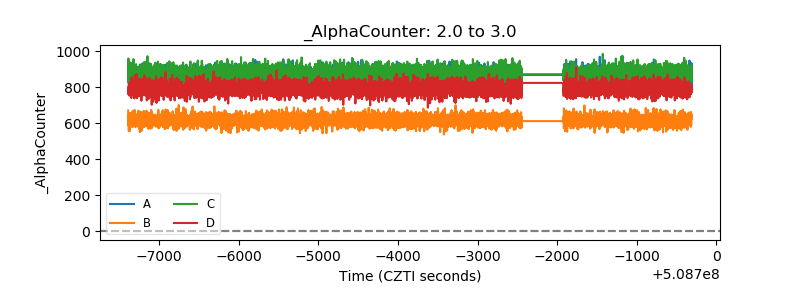 |
| _CPM_Rate | 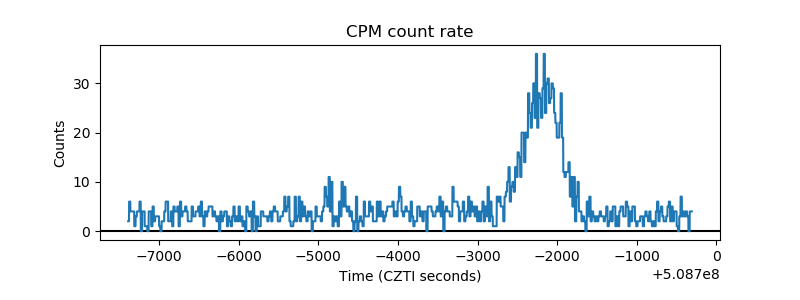 |
| CZT Counter | 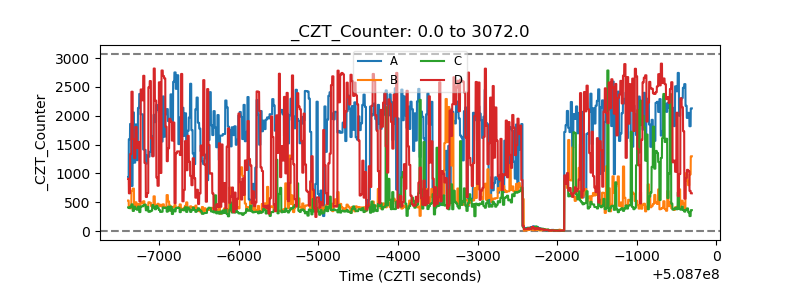 |
| +2.5 Volts monitor | 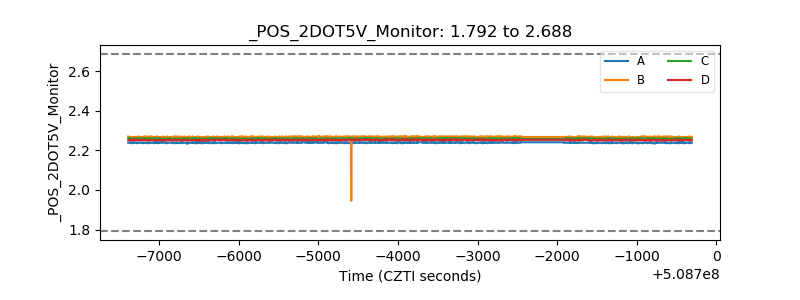 |
| +5 Volts monitor |  |
| _ROLL_ROT |  |
| _Roll_DEC |  |
| _Roll_RA |  |
| Veto Counter |  |