| Param | Original file | Final file |
|---|---|---|
| Filename | modeM0/AS1A14_083T04_9000006550_56162cztM0_level2.fits | modeM0/AS1A14_083T04_9000006550_56162cztM0_level2_quad_clean.evt |
| Size (bytes) | 913,498,560 | 87,914,880 |
| Size | 871.2 MB | 83.8 MB |
| Events in quadrant A | 12,996,760 | 332,771 |
| Events in quadrant B | 4,855,236 | 724,330 |
| Events in quadrant C | 3,703,587 | 660,147 |
| Events in quadrant D | 11,682,678 | 425,912 |
| Mode SS | |||
|---|---|---|---|
| Quadrant | BADHDUFLAG | Total packets | Discarded packets |
| A | 0 | 148 | 0 |
| B | 0 | 148 | 0 |
| C | 0 | 148 | 0 |
| D | 0 | 148 | 0 |
| Mode M0 | |||
|---|---|---|---|
| Quadrant | BADHDUFLAG | Total packets | Discarded packets |
| A | 0 | 43693 | 0 |
| B | 0 | 19628 | 0 |
| C | 0 | 16846 | 0 |
| D | 0 | 39892 | 0 |
| Quadrant | Total seconds | Saturated seconds | Saturation percentage |
|---|---|---|---|
| A | 7447 | 4204 | 56.452263% |
| B | 7448 | 371 | 4.981203% |
| C | 7448 | 104 | 1.396348% |
| D | 7448 | 2588 | 34.747583% |
Noise dominated data is calculated using 1-second bins in cleaned event files. If a bin has >2000 counts, and if more than 50% of those come from <1% of pixels, then it is considered to be noise-dominated and hence unusable.
| Quadrant | # 1 sec bins | Bins with >0 counts | Bins with >2000 counts | High rate bins dominated by noise | Noise dominated (total time) | Noise dominated (detector-on time) | Marked lightcurve |
|---|---|---|---|---|---|---|---|
| A | 7447 | 7447 | 3152 | 3152 | 42.33% | 42.33% | 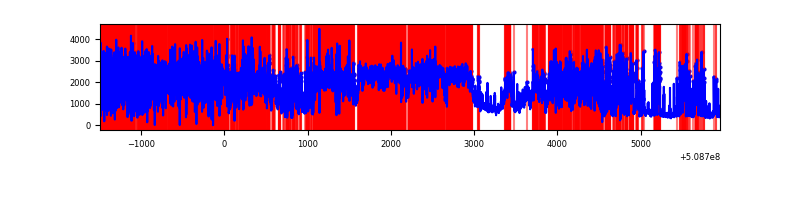 |
| B | 7448 | 7448 | 290 | 290 | 3.89% | 3.89% | 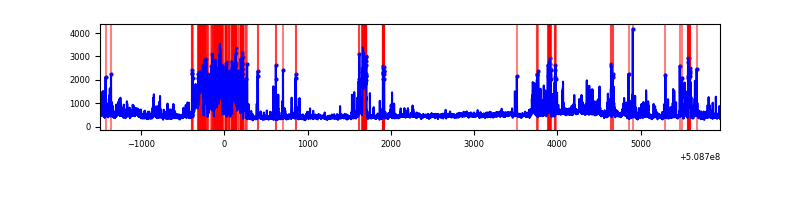 |
| C | 7448 | 7448 | 107 | 107 | 1.44% | 1.44% | 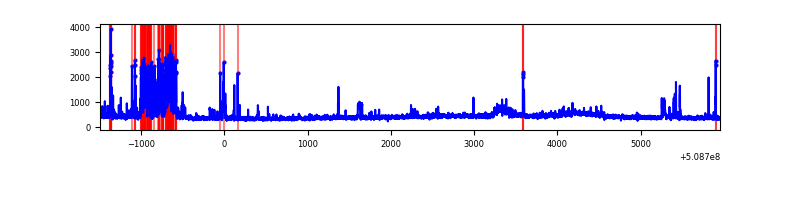 |
| D | 7448 | 7448 | 2638 | 2638 | 35.42% | 35.42% | 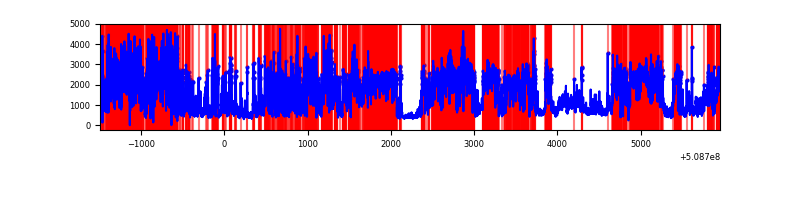 |
Top three noisy pixels from each quadrant. If the there are fewer than three noisy pixels in the level2.evt file, extra rows are filled as -1
| Pixel properties | Quadrant properties | ||||||
|---|---|---|---|---|---|---|---|
| Quadrant | DetID | PixID | Counts | Sigma | Mean | Median | Sigma |
| A | 12 | 115 | 5292908 | 37912.4 | 559 | 545 | 139.6 |
| A | 9 | 250 | 4347069 | 31136.78 | 559 | 545 | 139.6 |
| A | 15 | 32 | 744644 | 5330.43 | 559 | 545 | 139.6 |
| B | 5 | 185 | 700663 | 4319.81 | 764 | 739 | 162.0 |
| B | 4 | 171 | 276655 | 1702.91 | 764 | 739 | 162.0 |
| B | 10 | 247 | 253917 | 1562.57 | 764 | 739 | 162.0 |
| C | 12 | 252 | 618446 | 3016.73 | 750 | 742 | 204.8 |
| C | 12 | 241 | 99482 | 482.22 | 750 | 742 | 204.8 |
| C | 6 | 223 | 17814 | 83.38 | 750 | 742 | 204.8 |
| D | 8 | 240 | 4636707 | 25777.36 | 627 | 597 | 179.9 |
| D | 8 | 129 | 4033989 | 22426.17 | 627 | 597 | 179.9 |
| D | 2 | 249 | 242355 | 1344.21 | 627 | 597 | 179.9 |
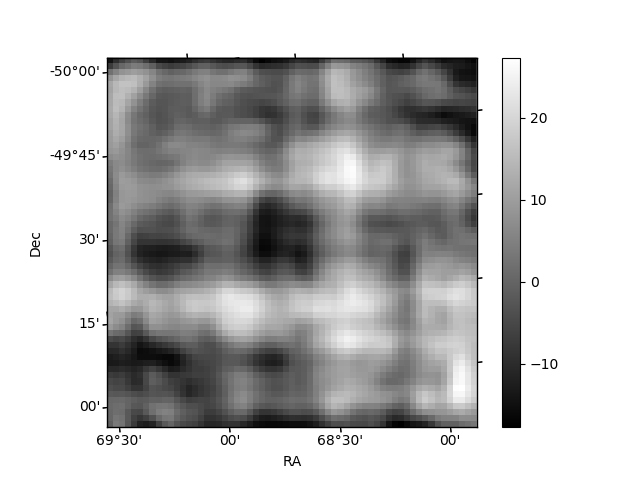
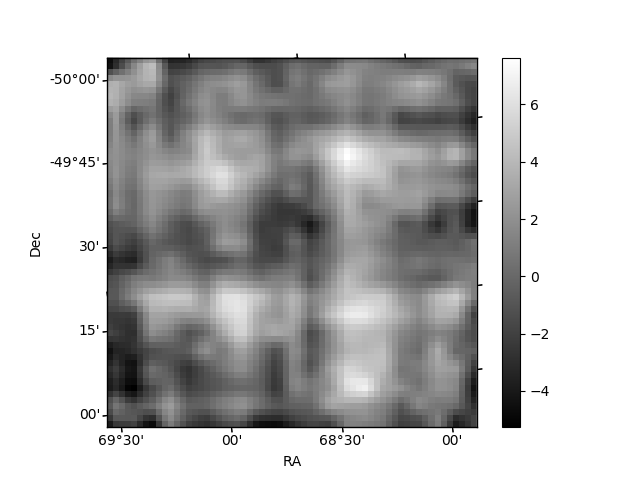
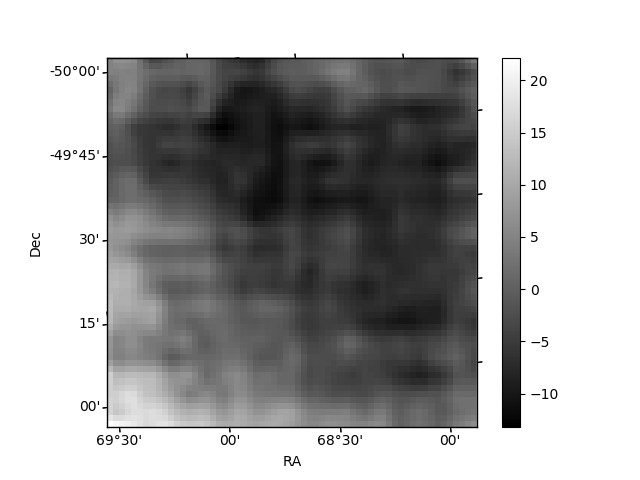
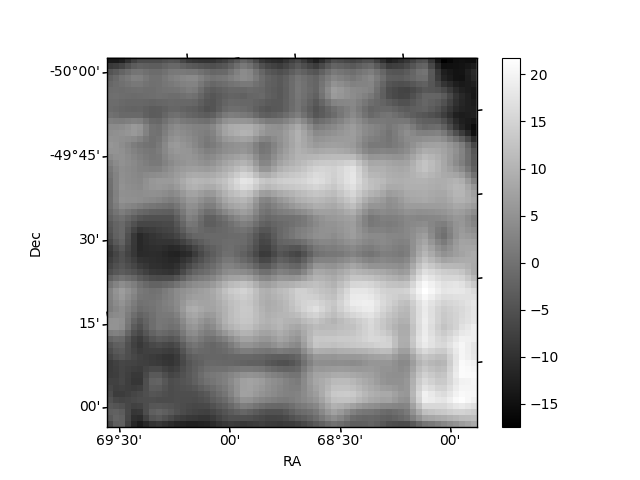
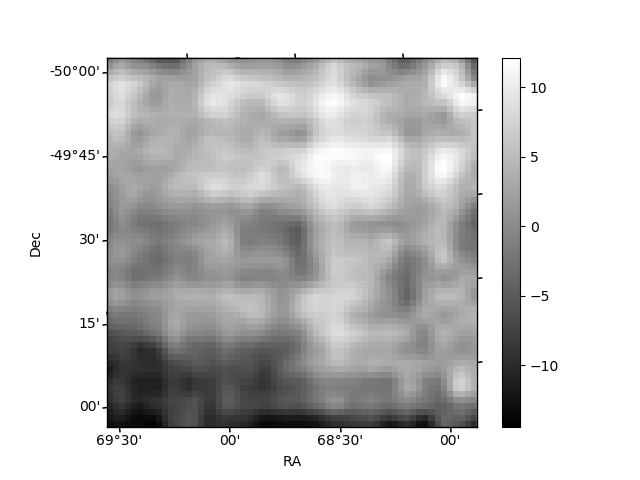
Histogram calculated using DETX and DETY for each event in the final _common_clean file
| Quadrant A | 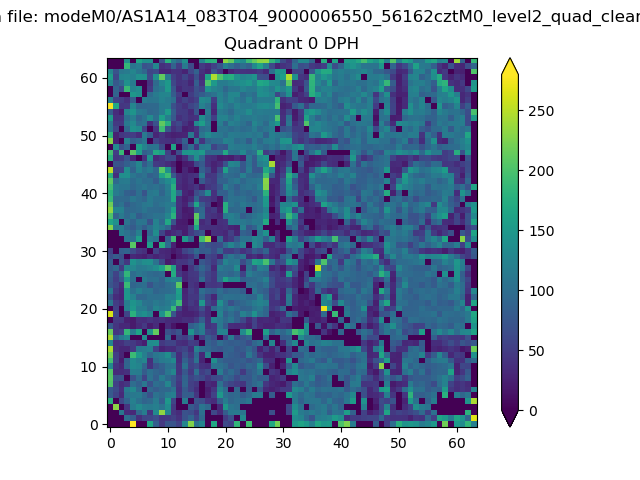 |
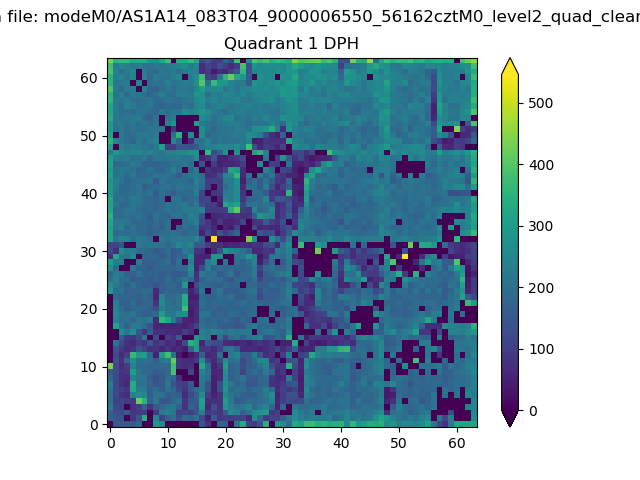 |
Quadrant B |
|---|---|---|---|
| Quadrant D | 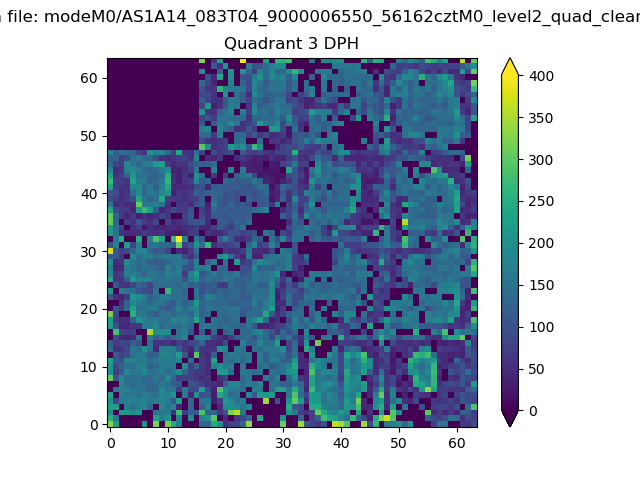 |
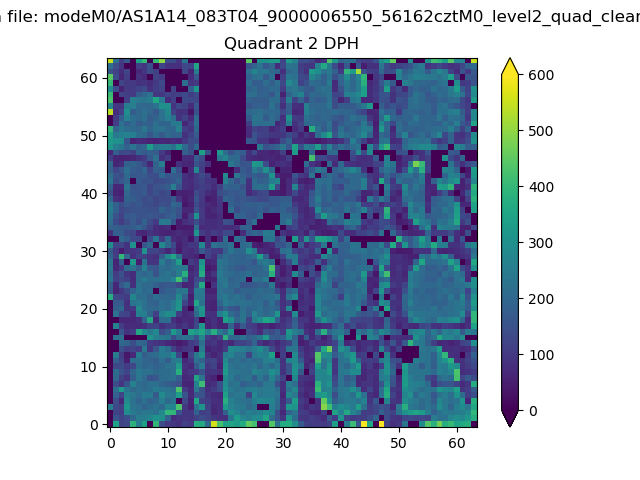 |
Quadrant C |
| Plot type | Count rate plots | Images |
|---|---|---|
| Comparison with Poisson distribution Blue bars denote a histogram of data divided into 1 sec bins. Red curve is a Poisson curve with rate = median count rate of data. |
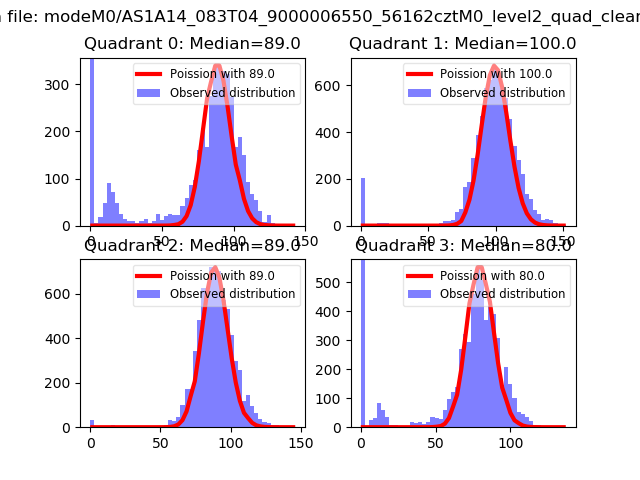 |
 |
| Quadrant-wise count rates Data is divided into 100 sec bins |
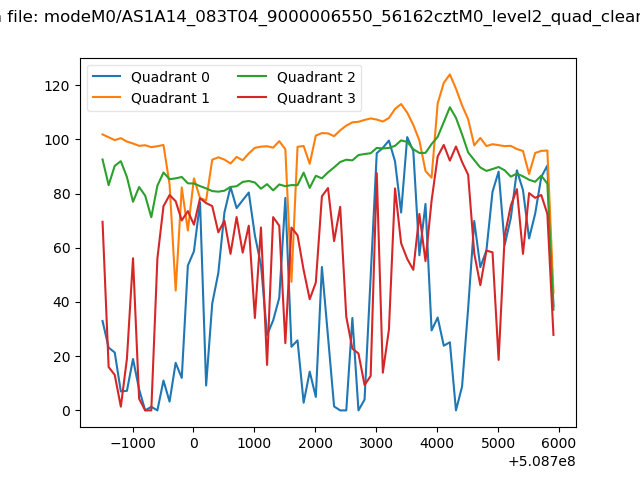 |
|
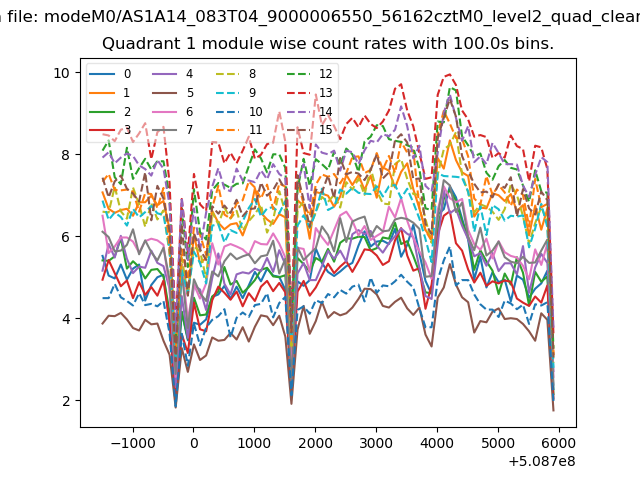
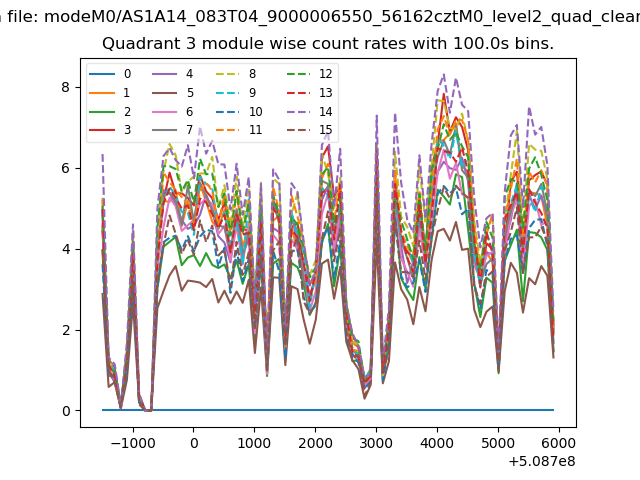
| Module-wise count rates for Quadrant A Data is divided into 100 sec bins |
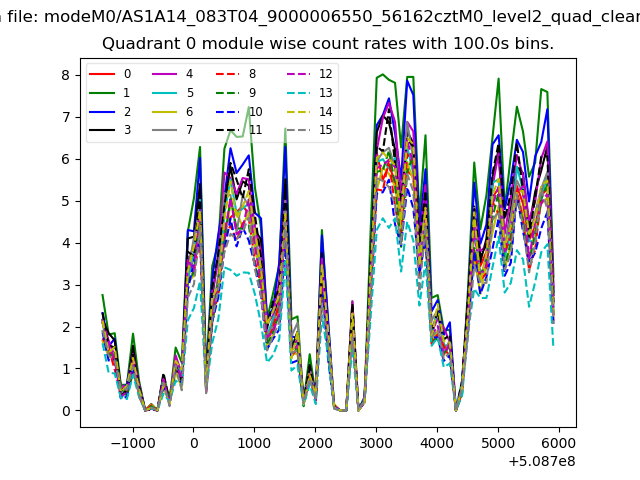 |
 |
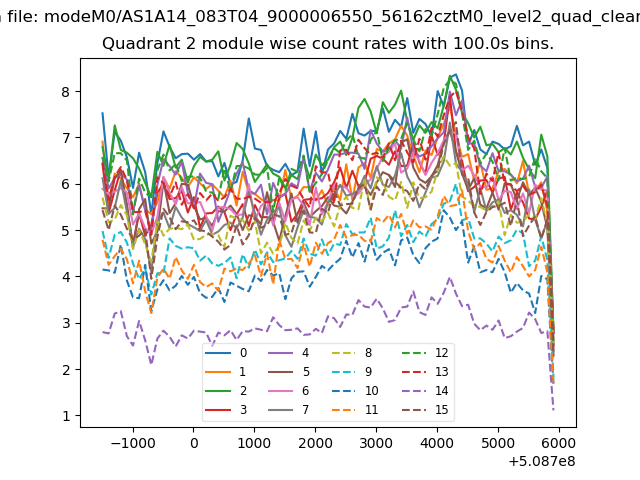
| Module-wise count rates for Quadrant B Data is divided into 100 sec bins |
 |
 |
| Module-wise count rates for Quadrant C Data is divided into 100 sec bins |
 |
 |
| Module-wise count rates for Quadrant D Data is divided into 100 sec bins |
 |
 |
| Parameter | Plot |
|---|---|
| CZT HV Monitor | 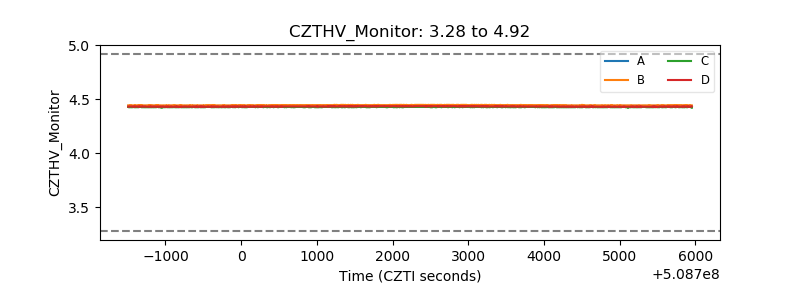 |
| D_VDD | 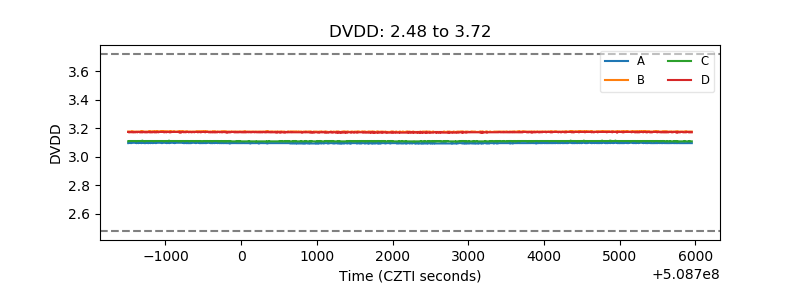 |
| Temperature 1 | 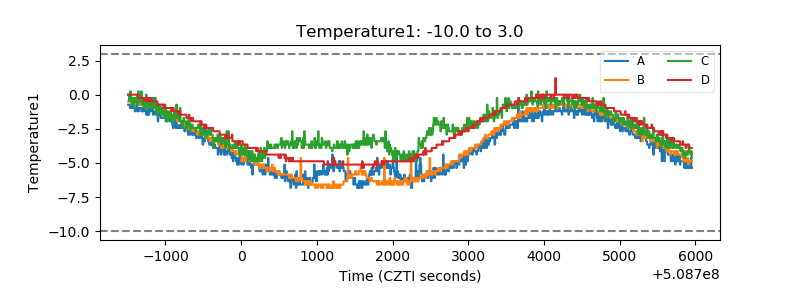 |
| Veto HV Monitor | 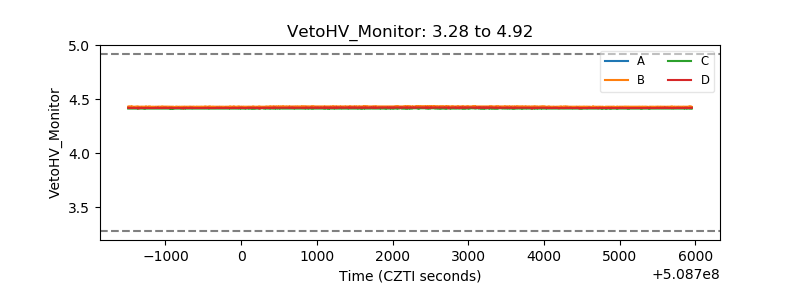 |
| Veto LLD | 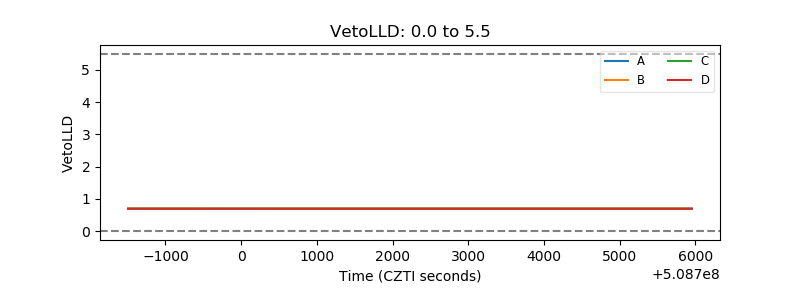 |
| Alpha Counter | 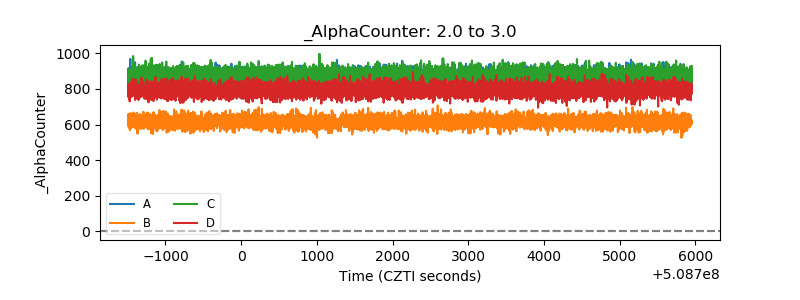 |
| _CPM_Rate | 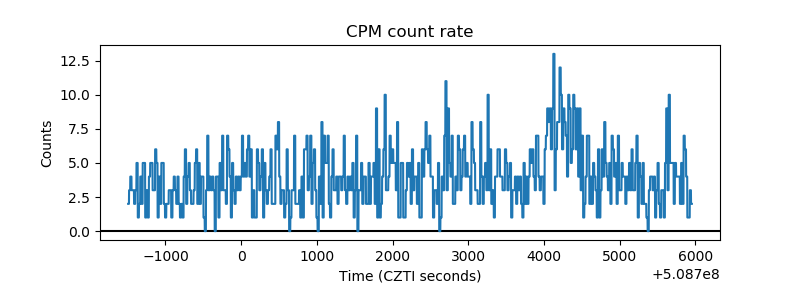 |
| CZT Counter | 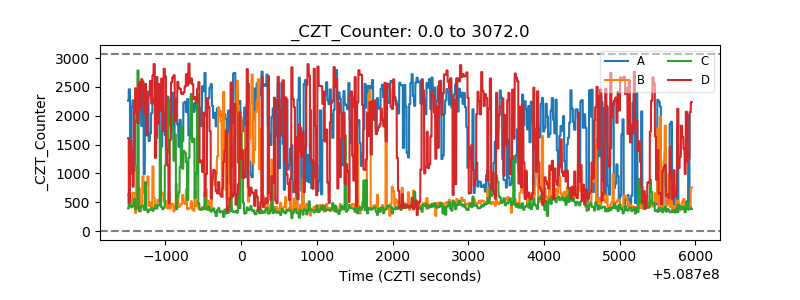 |
| +2.5 Volts monitor | 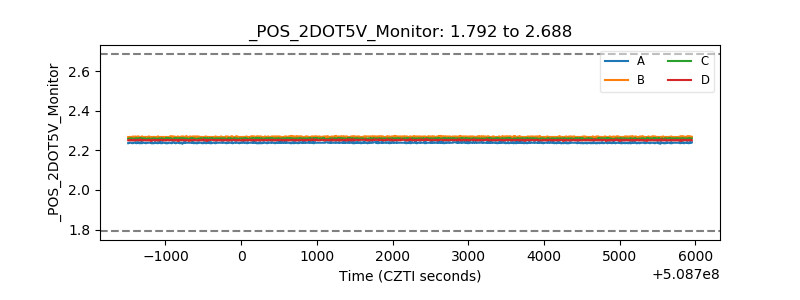 |
| +5 Volts monitor |  |
| _ROLL_ROT | 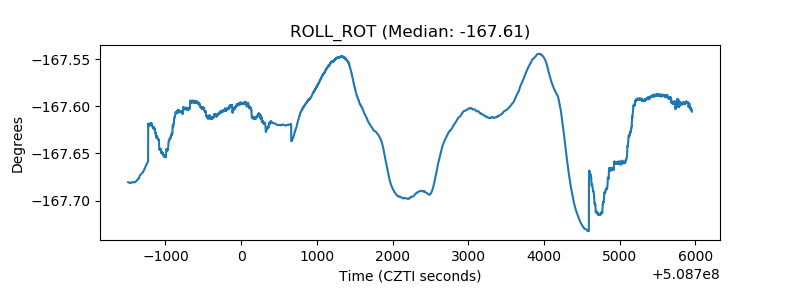 |
| _Roll_DEC | 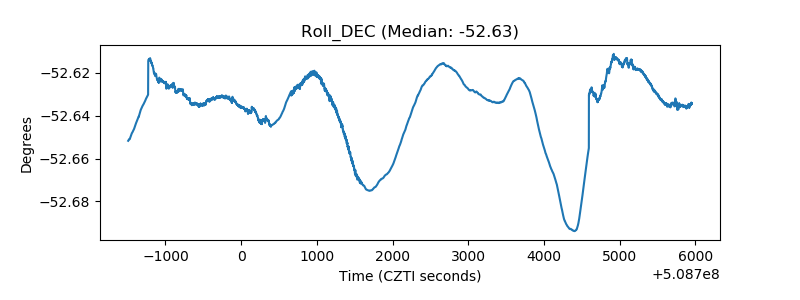 |
| _Roll_RA | 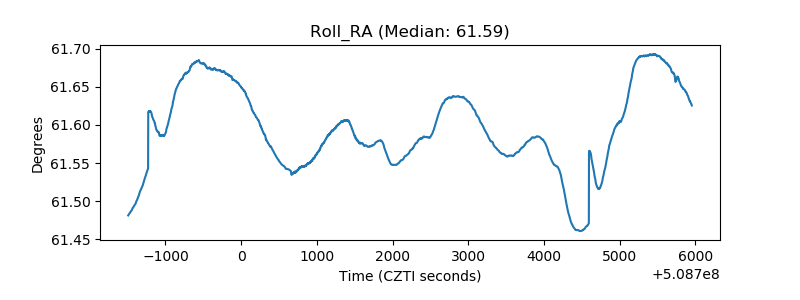 |
| Veto Counter | 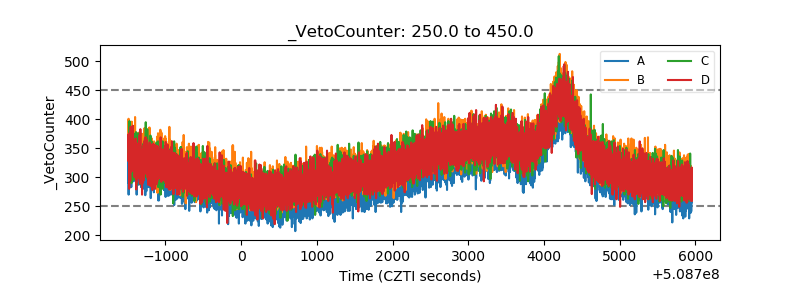 |