| Param | Original file | Final file |
|---|---|---|
| Filename | modeM0/AS1A14_083T04_9000006550_56163cztM0_level2.fits | modeM0/AS1A14_083T04_9000006550_56163cztM0_level2_quad_clean.evt |
| Size (bytes) | 717,327,360 | 98,481,600 |
| Size | 684.1 MB | 93.9 MB |
| Events in quadrant A | 6,599,615 | 618,412 |
| Events in quadrant B | 3,760,673 | 754,192 |
| Events in quadrant C | 3,356,838 | 668,702 |
| Events in quadrant D | 12,248,566 | 413,535 |
| Mode SS | |||
|---|---|---|---|
| Quadrant | BADHDUFLAG | Total packets | Discarded packets |
| A | 0 | 150 | 0 |
| B | 0 | 150 | 0 |
| C | 0 | 150 | 0 |
| D | 0 | 150 | 0 |
| Mode M0 | |||
|---|---|---|---|
| Quadrant | BADHDUFLAG | Total packets | Discarded packets |
| A | 0 | 24975 | 1 |
| B | 0 | 16649 | 0 |
| C | 0 | 16009 | 0 |
| D | 0 | 41665 | 0 |
| Quadrant | Total seconds | Saturated seconds | Saturation percentage |
|---|---|---|---|
| A | 7575 | 1004 | 13.254125% |
| B | 7576 | 51 | 0.673178% |
| C | 7576 | 15 | 0.197994% |
| D | 7576 | 2788 | 36.800422% |
Noise dominated data is calculated using 1-second bins in cleaned event files. If a bin has >2000 counts, and if more than 50% of those come from <1% of pixels, then it is considered to be noise-dominated and hence unusable.
| Quadrant | # 1 sec bins | Bins with >0 counts | Bins with >2000 counts | High rate bins dominated by noise | Noise dominated (total time) | Noise dominated (detector-on time) | Marked lightcurve |
|---|---|---|---|---|---|---|---|
| A | 7575 | 7575 | 725 | 725 | 9.57% | 9.57% |  |
| B | 7576 | 7576 | 30 | 30 | 0.40% | 0.40% |  |
| C | 7576 | 7576 | 13 | 13 | 0.17% | 0.17% |  |
| D | 7576 | 7576 | 2950 | 2950 | 38.94% | 38.94% | 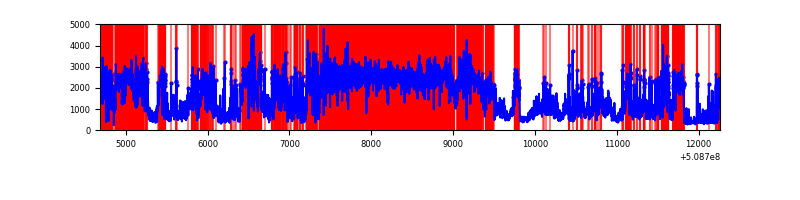 |
Top three noisy pixels from each quadrant. If the there are fewer than three noisy pixels in the level2.evt file, extra rows are filled as -1
| Pixel properties | Quadrant properties | ||||||
|---|---|---|---|---|---|---|---|
| Quadrant | DetID | PixID | Counts | Sigma | Mean | Median | Sigma |
| A | 9 | 250 | 1475040 | 7900.77 | 741 | 721 | 186.6 |
| A | 7 | 64 | 814227 | 4359.52 | 741 | 721 | 186.6 |
| A | 15 | 32 | 530150 | 2837.17 | 741 | 721 | 186.6 |
| B | 10 | 247 | 199101 | 1178.64 | 782 | 755 | 168.3 |
| B | 0 | 213 | 126979 | 750.07 | 782 | 755 | 168.3 |
| B | 8 | 128 | 93922 | 553.63 | 782 | 755 | 168.3 |
| C | 12 | 252 | 298235 | 1410.73 | 760 | 751 | 210.9 |
| C | 15 | 230 | 22260 | 102.0 | 760 | 751 | 210.9 |
| C | 6 | 9 | 15179 | 68.42 | 760 | 751 | 210.9 |
| D | 8 | 240 | 8021437 | 44285.35 | 623 | 593 | 181.1 |
| D | 8 | 129 | 751130 | 4143.93 | 623 | 593 | 181.1 |
| D | 2 | 249 | 430590 | 2374.14 | 623 | 593 | 181.1 |
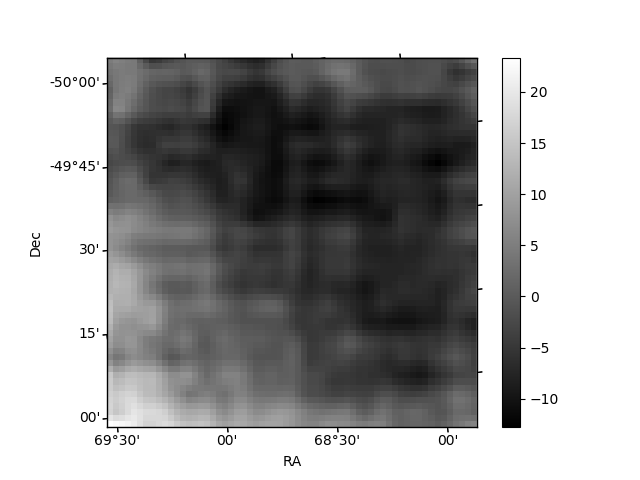
Histogram calculated using DETX and DETY for each event in the final _common_clean file
| Quadrant A | 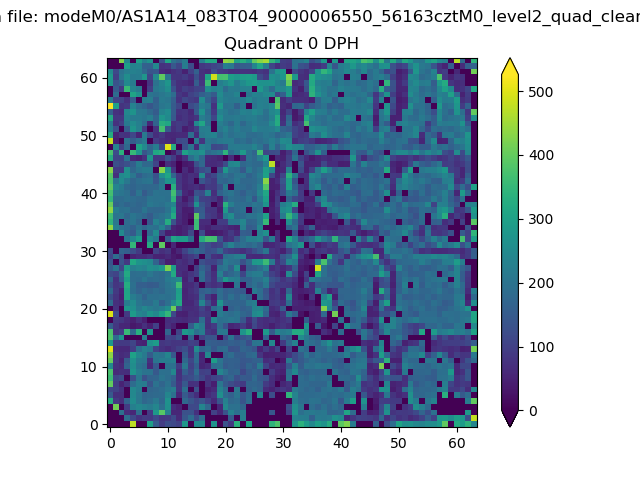 |
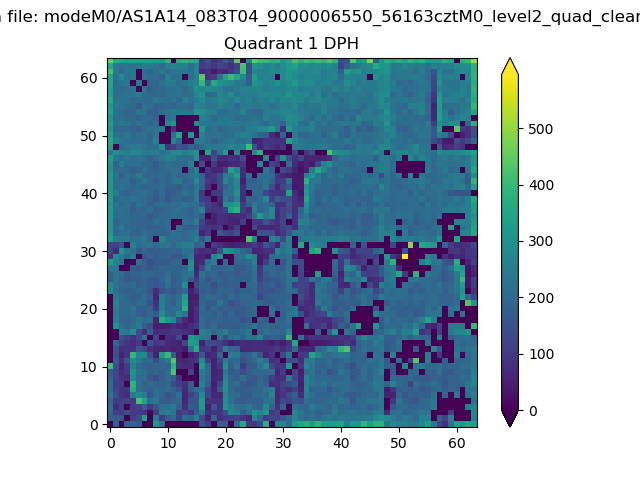 |
Quadrant B |
|---|---|---|---|
| Quadrant D | 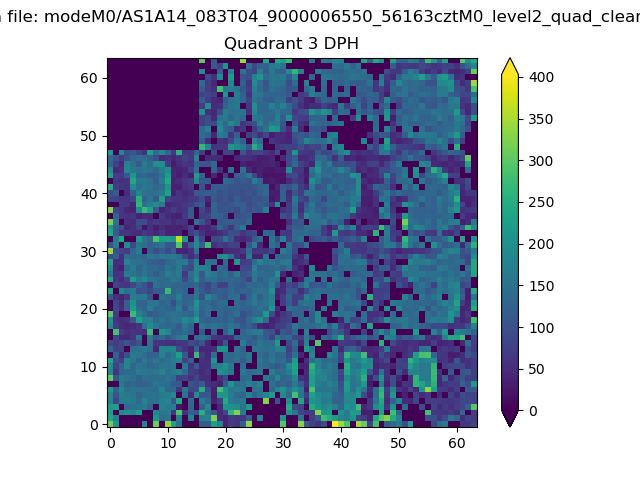 |
 |
Quadrant C |
| Plot type | Count rate plots | Images |
|---|---|---|
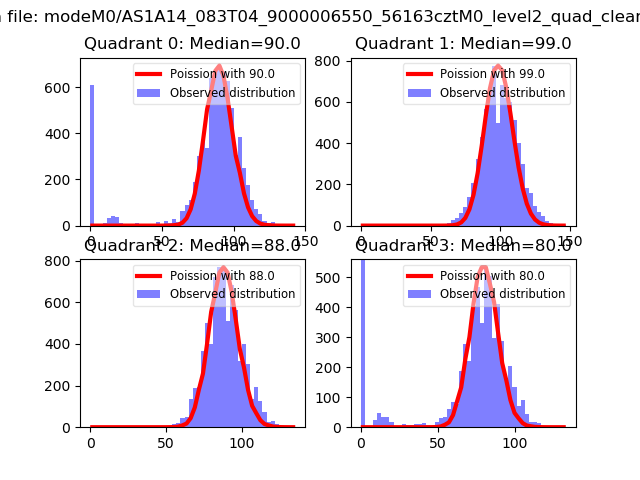
| Comparison with Poisson distribution Blue bars denote a histogram of data divided into 1 sec bins. Red curve is a Poisson curve with rate = median count rate of data. |
 |
 |
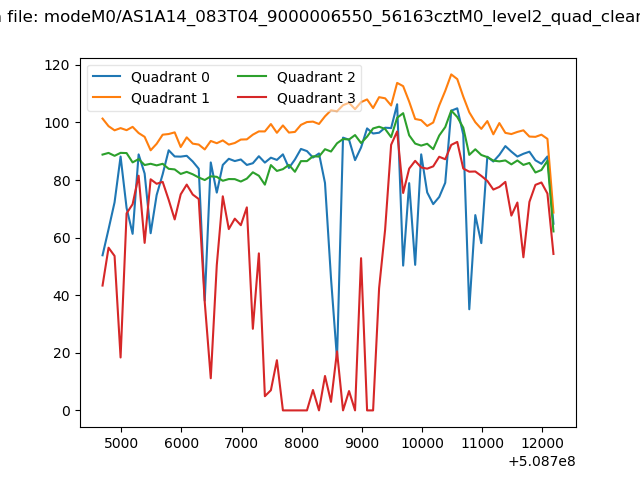
| Quadrant-wise count rates Data is divided into 100 sec bins |
 |
|
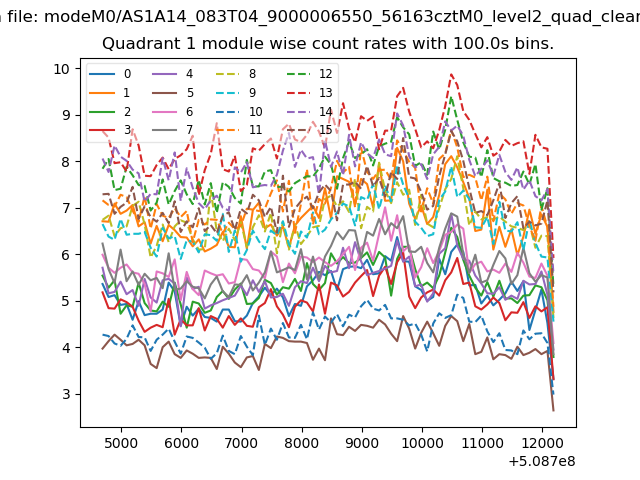
| Module-wise count rates for Quadrant A Data is divided into 100 sec bins |
 |
 |
| Module-wise count rates for Quadrant B Data is divided into 100 sec bins |
 |
 |
| Module-wise count rates for Quadrant C Data is divided into 100 sec bins |
 |
 |
| Module-wise count rates for Quadrant D Data is divided into 100 sec bins |
 |
 |
| Parameter | Plot |
|---|---|
| CZT HV Monitor | 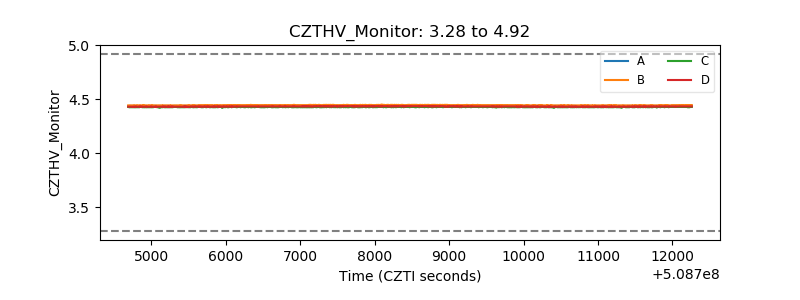 |
| D_VDD | 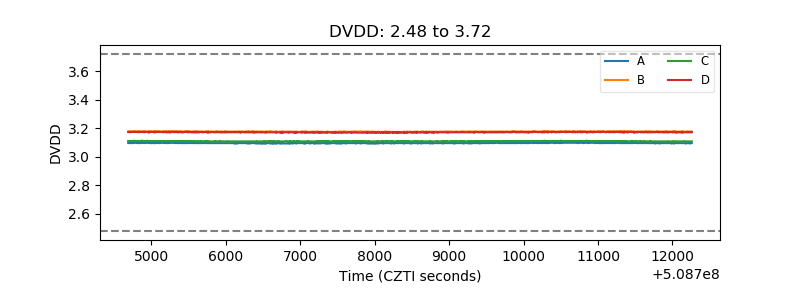 |
| Temperature 1 |  |
| Veto HV Monitor |  |
| Veto LLD |  |
| Alpha Counter |  |
| _CPM_Rate | 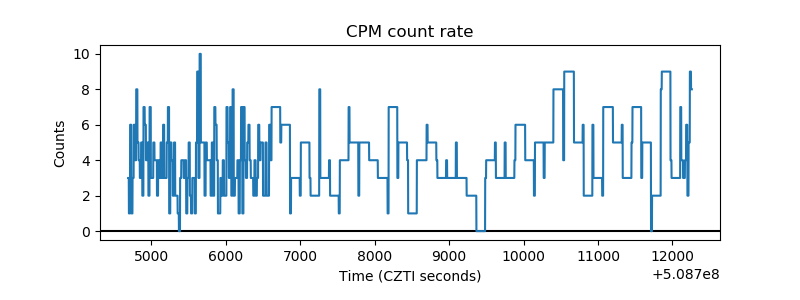 |
| CZT Counter |  |
| +2.5 Volts monitor | 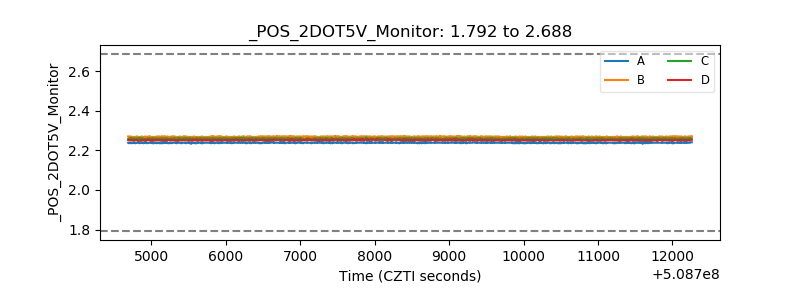 |
| +5 Volts monitor | 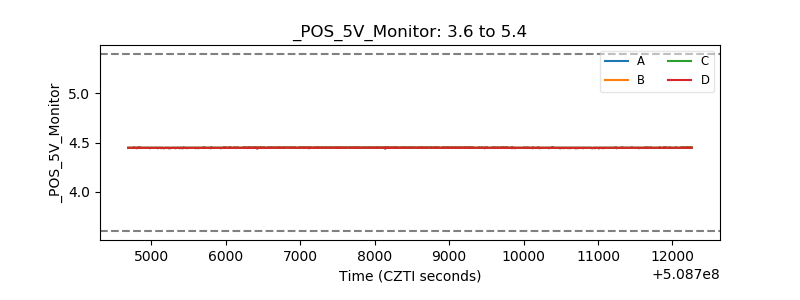 |
| _ROLL_ROT |  |
| _Roll_DEC |  |
| _Roll_RA |  |
| Veto Counter |  |