| Param | Original file | Final file |
|---|---|---|
| Filename | modeM0/AS1A14_083T04_9000006550_56164cztM0_level2.fits | modeM0/AS1A14_083T04_9000006550_56164cztM0_level2_quad_clean.evt |
| Size (bytes) | 652,959,360 | 109,535,040 |
| Size | 622.7 MB | 104.5 MB |
| Events in quadrant A | 8,717,531 | 612,566 |
| Events in quadrant B | 4,176,717 | 801,603 |
| Events in quadrant C | 3,716,906 | 714,103 |
| Events in quadrant D | 6,933,660 | 627,573 |
| Mode SS | |||
|---|---|---|---|
| Quadrant | BADHDUFLAG | Total packets | Discarded packets |
| A | 0 | 160 | 0 |
| B | 0 | 160 | 0 |
| C | 0 | 160 | 0 |
| D | 0 | 160 | 0 |
| Mode M0 | |||
|---|---|---|---|
| Quadrant | BADHDUFLAG | Total packets | Discarded packets |
| A | 0 | 31610 | 0 |
| B | 0 | 18339 | 0 |
| C | 0 | 17430 | 0 |
| D | 0 | 26318 | 0 |
| Quadrant | Total seconds | Saturated seconds | Saturation percentage |
|---|---|---|---|
| A | 8068 | 1575 | 19.521567% |
| B | 8068 | 107 | 1.326227% |
| C | 8068 | 21 | 0.260288% |
| D | 8068 | 637 | 7.895389% |
Noise dominated data is calculated using 1-second bins in cleaned event files. If a bin has >2000 counts, and if more than 50% of those come from <1% of pixels, then it is considered to be noise-dominated and hence unusable.
| Quadrant | # 1 sec bins | Bins with >0 counts | Bins with >2000 counts | High rate bins dominated by noise | Noise dominated (total time) | Noise dominated (detector-on time) | Marked lightcurve |
|---|---|---|---|---|---|---|---|
| A | 8068 | 8068 | 1111 | 1111 | 13.77% | 13.77% | 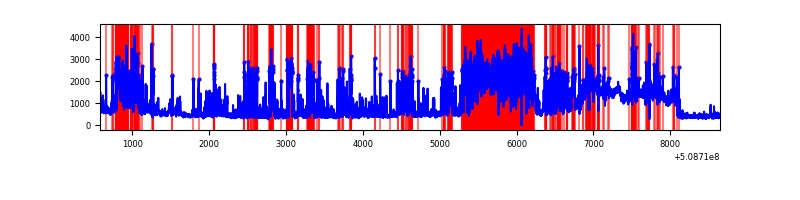 |
| B | 8068 | 8068 | 38 | 38 | 0.47% | 0.47% | 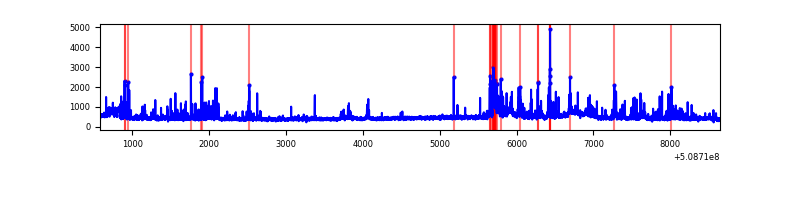 |
| C | 8068 | 8068 | 14 | 14 | 0.17% | 0.17% | 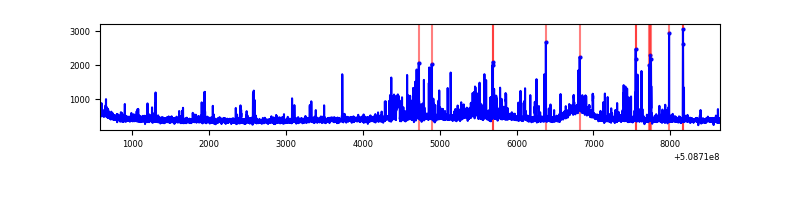 |
| D | 8068 | 8068 | 700 | 700 | 8.68% | 8.68% | 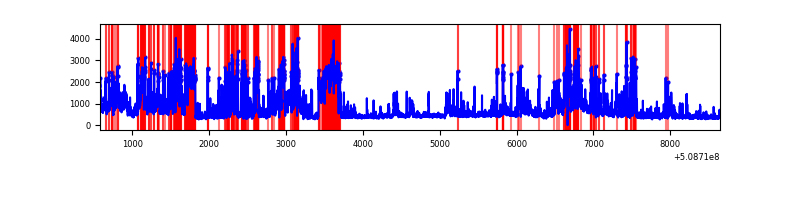 |
Top three noisy pixels from each quadrant. If the there are fewer than three noisy pixels in the level2.evt file, extra rows are filled as -1
| Pixel properties | Quadrant properties | ||||||
|---|---|---|---|---|---|---|---|
| Quadrant | DetID | PixID | Counts | Sigma | Mean | Median | Sigma |
| A | 9 | 250 | 1804052 | 9303.21 | 774 | 755 | 193.8 |
| A | 0 | 250 | 1383850 | 7135.39 | 774 | 755 | 193.8 |
| A | 7 | 64 | 1079482 | 5565.15 | 774 | 755 | 193.8 |
| B | 10 | 247 | 173644 | 948.85 | 846 | 814 | 182.1 |
| B | 5 | 185 | 129381 | 705.85 | 846 | 814 | 182.1 |
| B | 7 | 0 | 122253 | 666.71 | 846 | 814 | 182.1 |
| C | 12 | 252 | 338860 | 1479.61 | 825 | 816 | 228.5 |
| C | 8 | 7 | 33023 | 140.97 | 825 | 816 | 228.5 |
| C | 13 | 3 | 29344 | 124.87 | 825 | 816 | 228.5 |
| D | 8 | 240 | 1788338 | 7992.53 | 791 | 758 | 223.7 |
| D | 8 | 129 | 726824 | 3246.35 | 791 | 758 | 223.7 |
| D | 11 | 129 | 557673 | 2490.05 | 791 | 758 | 223.7 |
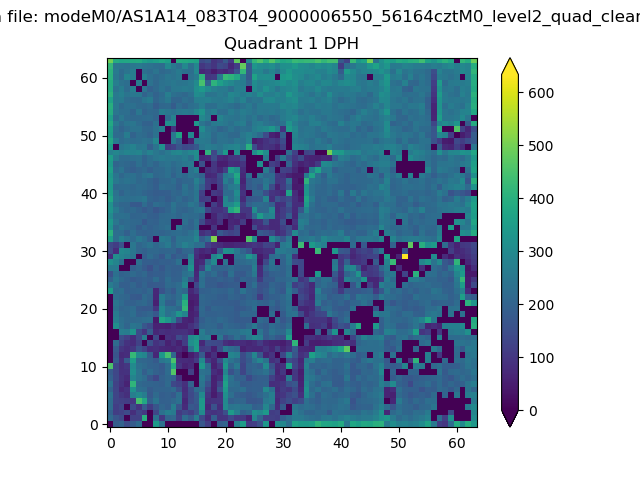
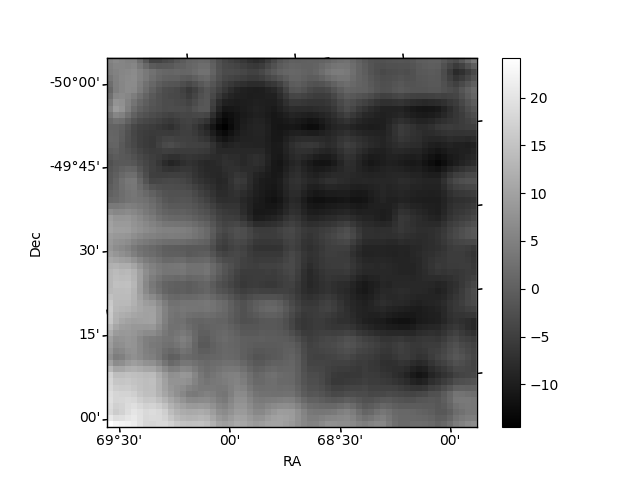
Histogram calculated using DETX and DETY for each event in the final _common_clean file
| Quadrant A |  |
 |
Quadrant B |
|---|---|---|---|
| Quadrant D |  |
 |
Quadrant C |
| Plot type | Count rate plots | Images |
|---|---|---|
| Comparison with Poisson distribution Blue bars denote a histogram of data divided into 1 sec bins. Red curve is a Poisson curve with rate = median count rate of data. |
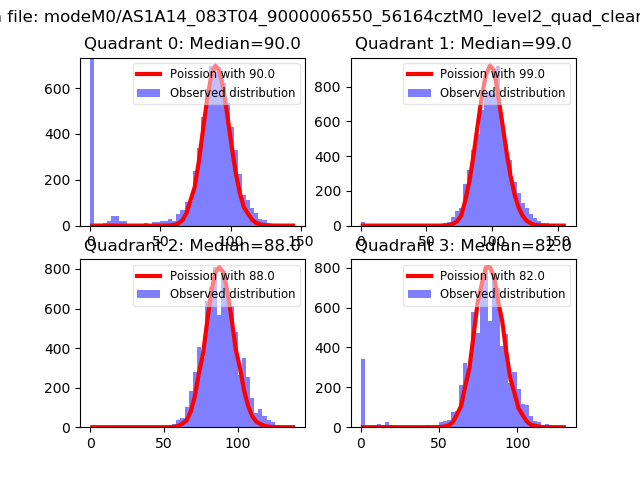 |
 |
| Quadrant-wise count rates Data is divided into 100 sec bins |
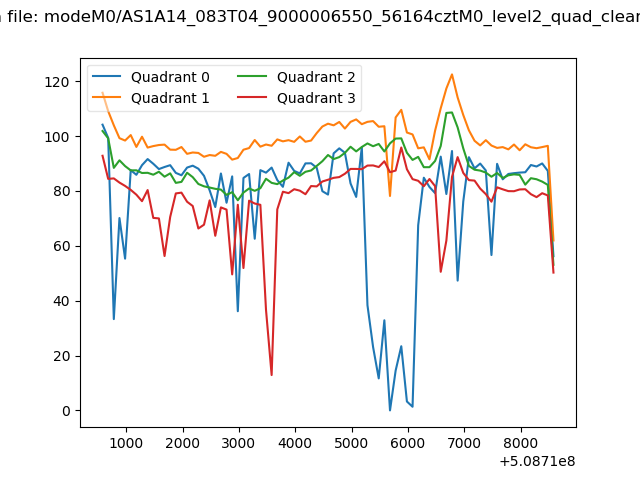 |
|
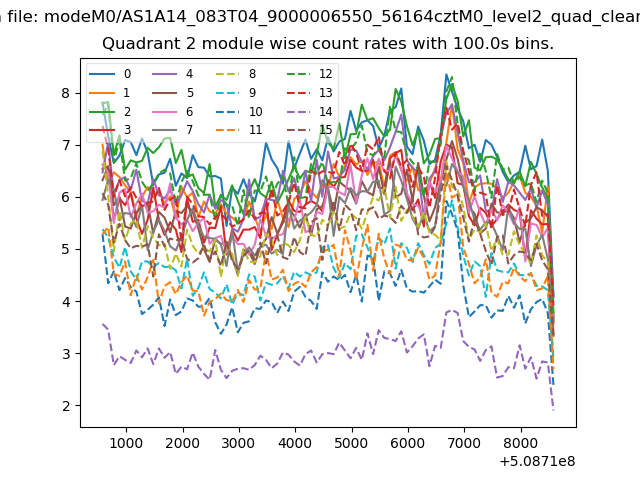
| Module-wise count rates for Quadrant A Data is divided into 100 sec bins |
 |
 |
| Module-wise count rates for Quadrant B Data is divided into 100 sec bins |
 |
 |
| Module-wise count rates for Quadrant C Data is divided into 100 sec bins |
 |
 |
| Module-wise count rates for Quadrant D Data is divided into 100 sec bins |
 |
 |
| Parameter | Plot |
|---|---|
| CZT HV Monitor | 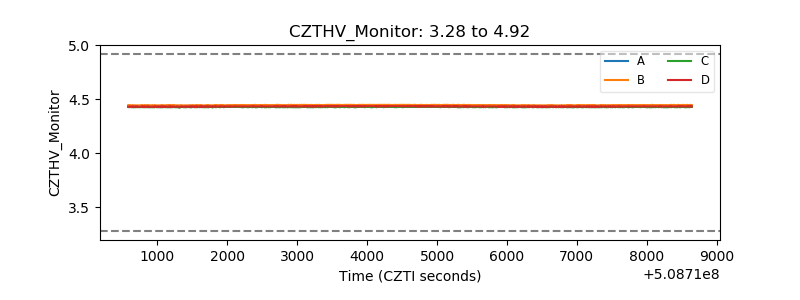 |
| D_VDD | 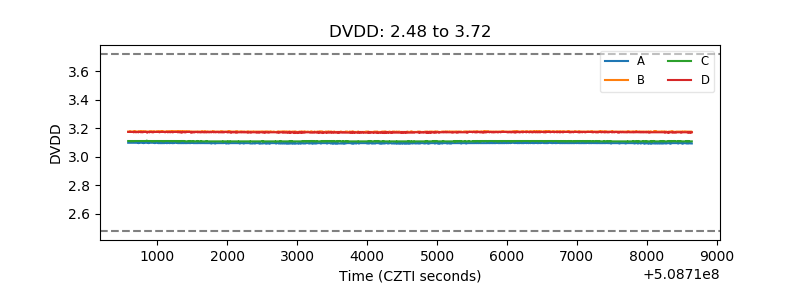 |
| Temperature 1 | 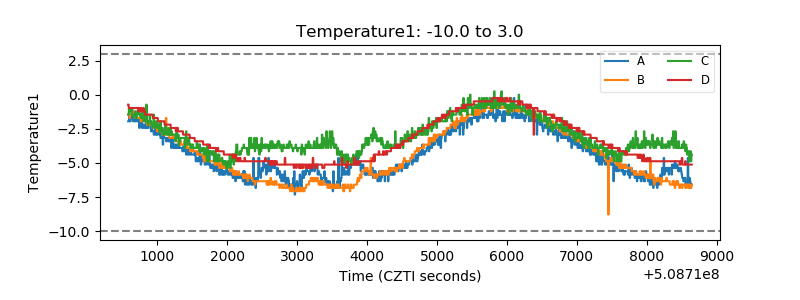 |
| Veto HV Monitor | 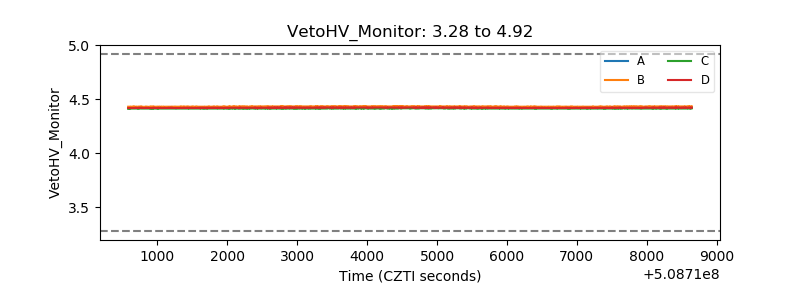 |
| Veto LLD | 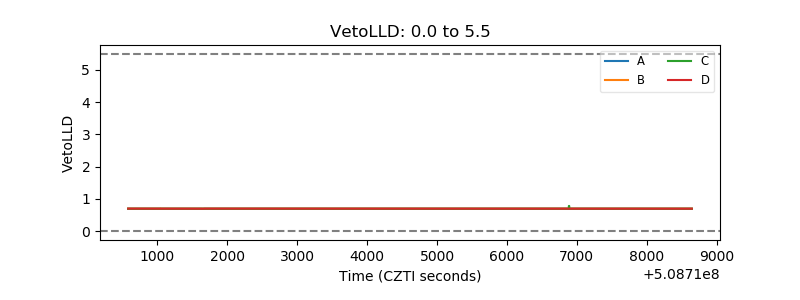 |
| Alpha Counter |  |
| _CPM_Rate |  |
| CZT Counter | 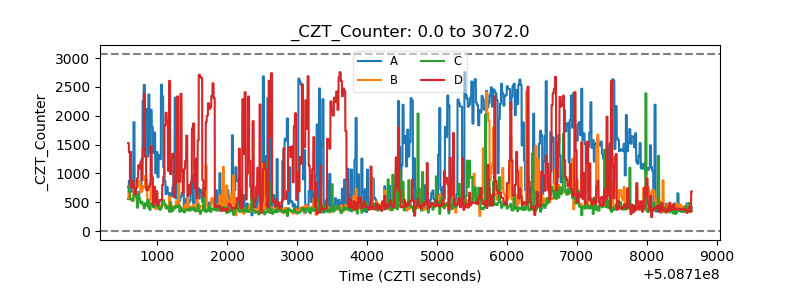 |
| +2.5 Volts monitor |  |
| +5 Volts monitor |  |
| _ROLL_ROT | 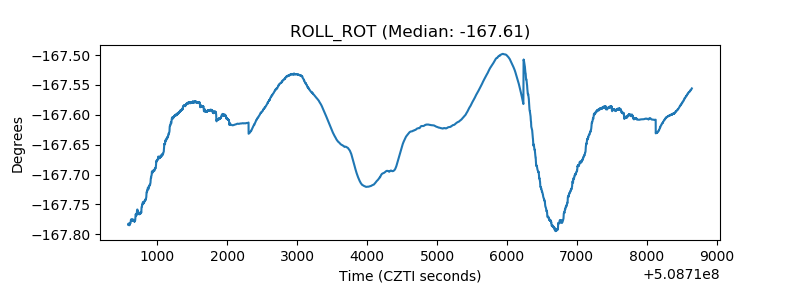 |
| _Roll_DEC | 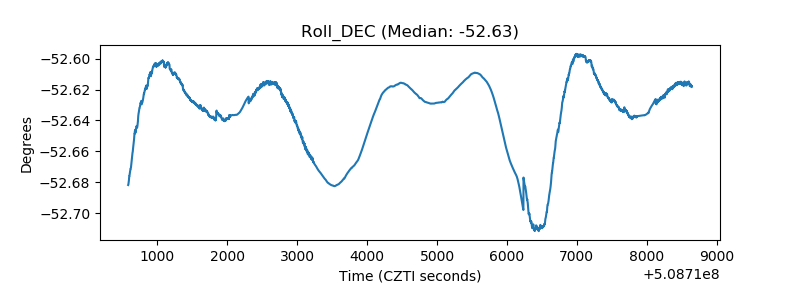 |
| _Roll_RA | 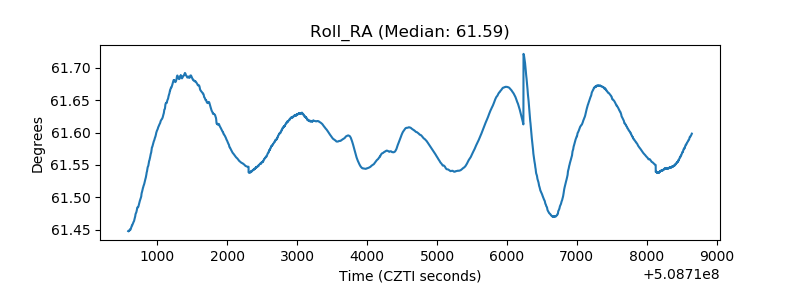 |
| Veto Counter | 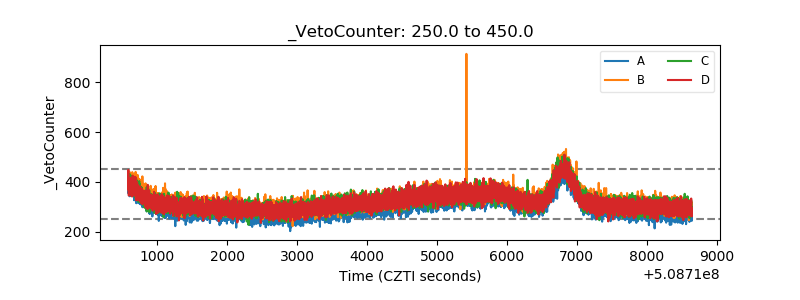 |