| Param | Original file | Final file |
|---|---|---|
| Filename | modeM0/AS1A14_083T04_9000006550_56167cztM0_level2.fits | modeM0/AS1A14_083T04_9000006550_56167cztM0_level2_quad_clean.evt |
| Size (bytes) | 1,304,046,720 | 260,856,000 |
| Size | 1.2 GB | 248.8 MB |
| Events in quadrant A | 15,705,399 | 1,594,770 |
| Events in quadrant B | 10,605,406 | 1,831,372 |
| Events in quadrant C | 9,270,813 | 1,642,838 |
| Events in quadrant D | 11,222,847 | 1,521,856 |
| Mode SS | |||
|---|---|---|---|
| Quadrant | BADHDUFLAG | Total packets | Discarded packets |
| A | 0 | 386 | 0 |
| B | 0 | 386 | 0 |
| C | 0 | 386 | 0 |
| D | 0 | 386 | 0 |
| Mode M9 | |||
|---|---|---|---|
| Quadrant | BADHDUFLAG | Total packets | Discarded packets |
| A | 0 | 14 | 0 |
| B | 0 | 14 | 0 |
| C | 0 | 14 | 0 |
| D | 0 | 14 | 0 |
| Mode M0 | |||
|---|---|---|---|
| Quadrant | BADHDUFLAG | Total packets | Discarded packets |
| A | 0 | 60190 | 4 |
| B | 0 | 44854 | 3 |
| C | 0 | 42047 | 3 |
| D | 0 | 47098 | 3 |
| Quadrant | Total seconds | Saturated seconds | Saturation percentage |
|---|---|---|---|
| A | 18961 | 1746 | 9.208375% |
| B | 18962 | 600 | 3.164223% |
| C | 18962 | 226 | 1.191857% |
| D | 18962 | 432 | 2.278241% |
Noise dominated data is calculated using 1-second bins in cleaned event files. If a bin has >2000 counts, and if more than 50% of those come from <1% of pixels, then it is considered to be noise-dominated and hence unusable.
| Quadrant | # 1 sec bins | Bins with >0 counts | Bins with >2000 counts | High rate bins dominated by noise | Noise dominated (total time) | Noise dominated (detector-on time) | Marked lightcurve |
|---|---|---|---|---|---|---|---|
| A | 20477 | 18963 | 1256 | 1256 | 6.13% | 6.62% |  |
| B | 20477 | 18963 | 200 | 200 | 0.98% | 1.05% |  |
| C | 20477 | 18963 | 85 | 85 | 0.42% | 0.45% |  |
| D | 20477 | 18963 | 318 | 318 | 1.55% | 1.68% |  |
Top three noisy pixels from each quadrant. If the there are fewer than three noisy pixels in the level2.evt file, extra rows are filled as -1
| Pixel properties | Quadrant properties | ||||||
|---|---|---|---|---|---|---|---|
| Quadrant | DetID | PixID | Counts | Sigma | Mean | Median | Sigma |
| A | 15 | 32 | 2969649 | 6248.89 | 1928 | 1885 | 474.9 |
| A | 7 | 64 | 1251577 | 2631.34 | 1928 | 1885 | 474.9 |
| A | 0 | 250 | 1110951 | 2335.24 | 1928 | 1885 | 474.9 |
| B | 5 | 185 | 895158 | 2105.96 | 1990 | 1913 | 424.2 |
| B | 5 | 172 | 675221 | 1587.43 | 1990 | 1913 | 424.2 |
| B | 7 | 0 | 353047 | 827.85 | 1990 | 1913 | 424.2 |
| C | 12 | 252 | 1046521 | 1937.23 | 1970 | 1952 | 539.2 |
| C | 6 | 223 | 161105 | 295.16 | 1970 | 1952 | 539.2 |
| C | 8 | 7 | 138691 | 253.59 | 1970 | 1952 | 539.2 |
| D | 2 | 249 | 861565 | 1577.03 | 1938 | 1853 | 545.1 |
| D | 11 | 129 | 724490 | 1325.59 | 1938 | 1853 | 545.1 |
| D | 8 | 240 | 711599 | 1301.94 | 1938 | 1853 | 545.1 |
Histogram calculated using DETX and DETY for each event in the final _common_clean file
| Quadrant A | 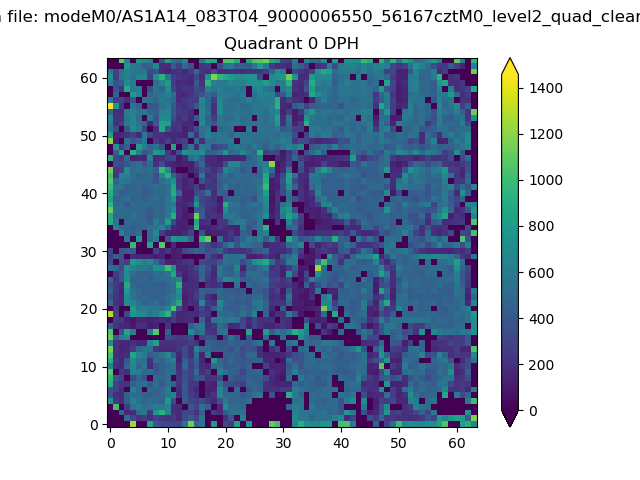 |
 |
Quadrant B |
|---|---|---|---|
| Quadrant D | 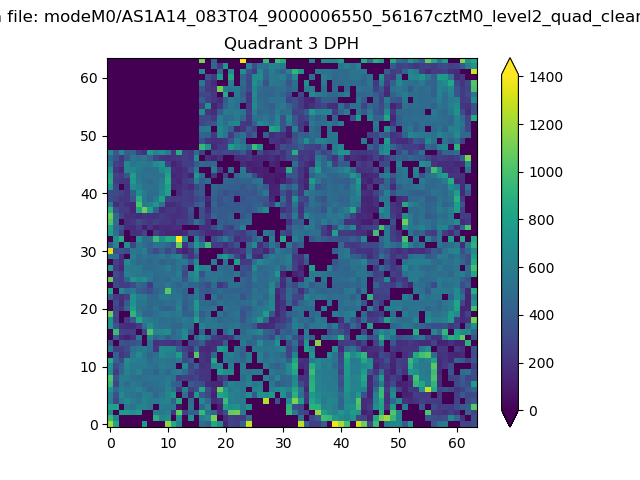 |
 |
Quadrant C |
| Plot type | Count rate plots | Images |
|---|---|---|
| Comparison with Poisson distribution Blue bars denote a histogram of data divided into 1 sec bins. Red curve is a Poisson curve with rate = median count rate of data. |
 |
 |
| Quadrant-wise count rates Data is divided into 100 sec bins |
 |
|
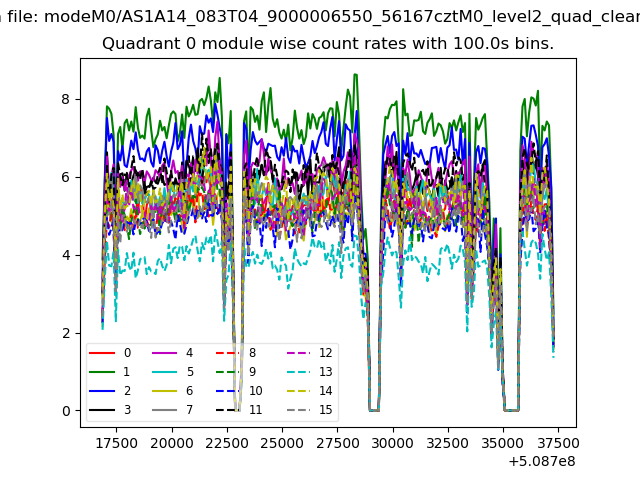
| Module-wise count rates for Quadrant A Data is divided into 100 sec bins |
 |
 |
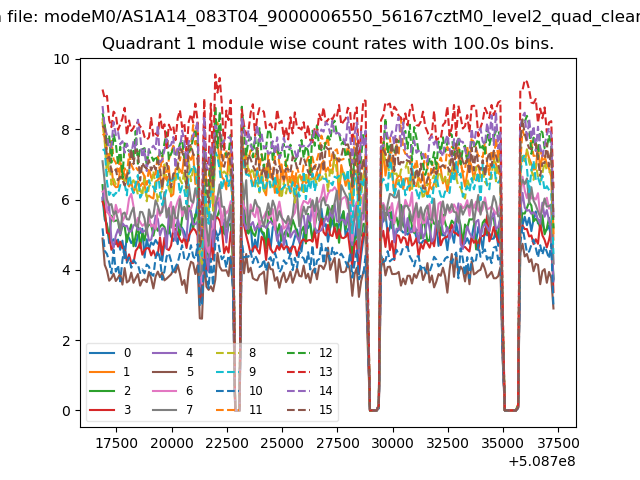
| Module-wise count rates for Quadrant B Data is divided into 100 sec bins |
 |
 |
| Module-wise count rates for Quadrant C Data is divided into 100 sec bins |
 |
 |
| Module-wise count rates for Quadrant D Data is divided into 100 sec bins |
 |
 |
| Parameter | Plot |
|---|---|
| CZT HV Monitor | 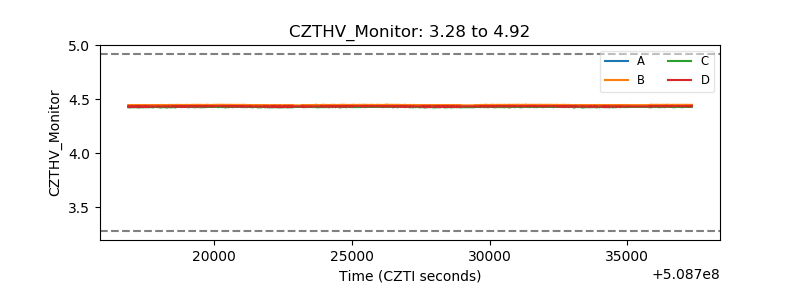 |
| D_VDD |  |
| Temperature 1 | 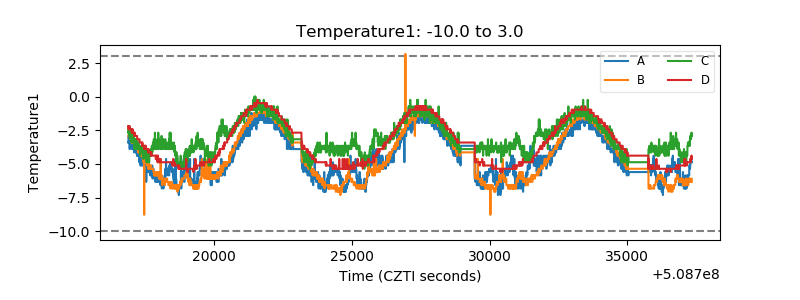 |
| Veto HV Monitor |  |
| Veto LLD |  |
| Alpha Counter | 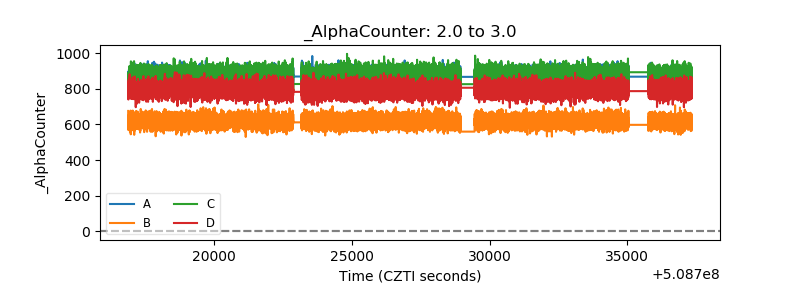 |
| _CPM_Rate | 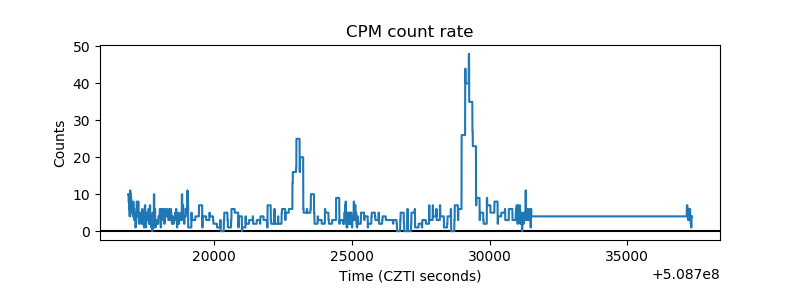 |
| CZT Counter | 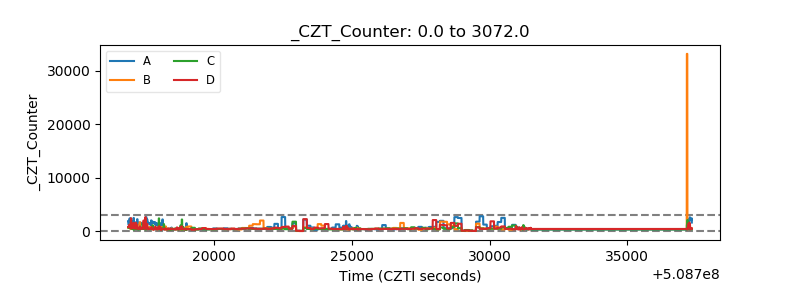 |
| +2.5 Volts monitor | 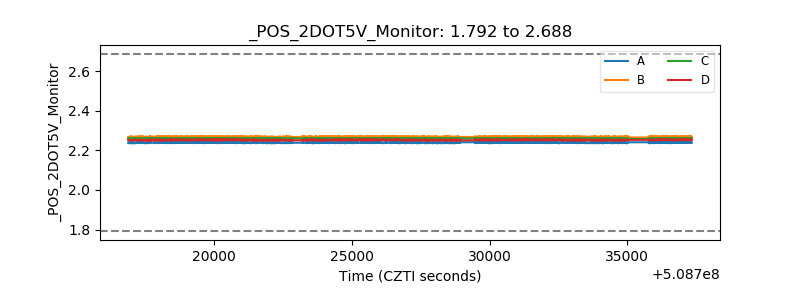 |
| +5 Volts monitor |  |
| _ROLL_ROT |  |
| _Roll_DEC |  |
| _Roll_RA |  |
| Veto Counter |  |