| Param | Original file | Final file |
|---|---|---|
| Filename | modeM0/AS1A14_083T04_9000006550_56168cztM0_level2.fits | modeM0/AS1A14_083T04_9000006550_56168cztM0_level2_quad_clean.evt |
| Size (bytes) | 534,948,480 | 96,266,880 |
| Size | 510.2 MB | 91.8 MB |
| Events in quadrant A | 7,461,707 | 580,117 |
| Events in quadrant B | 3,440,100 | 692,570 |
| Events in quadrant C | 3,703,038 | 600,108 |
| Events in quadrant D | 4,662,354 | 561,681 |
| Mode SS | |||
|---|---|---|---|
| Quadrant | BADHDUFLAG | Total packets | Discarded packets |
| A | 0 | 140 | 0 |
| B | 0 | 140 | 0 |
| C | 0 | 140 | 0 |
| D | 0 | 140 | 0 |
| Mode M9 | |||
|---|---|---|---|
| Quadrant | BADHDUFLAG | Total packets | Discarded packets |
| A | 0 | 14 | 0 |
| B | 0 | 14 | 0 |
| C | 0 | 15 | 0 |
| D | 0 | 15 | 0 |
| Mode M0 | |||
|---|---|---|---|
| Quadrant | BADHDUFLAG | Total packets | Discarded packets |
| A | 0 | 26930 | 2 |
| B | 0 | 14895 | 2 |
| C | 0 | 16250 | 2 |
| D | 0 | 18665 | 2 |
| Quadrant | Total seconds | Saturated seconds | Saturation percentage |
|---|---|---|---|
| A | 6893 | 998 | 14.478456% |
| B | 6893 | 129 | 1.871464% |
| C | 6893 | 258 | 3.742928% |
| D | 6893 | 237 | 3.438271% |
Noise dominated data is calculated using 1-second bins in cleaned event files. If a bin has >2000 counts, and if more than 50% of those come from <1% of pixels, then it is considered to be noise-dominated and hence unusable.
| Quadrant | # 1 sec bins | Bins with >0 counts | Bins with >2000 counts | High rate bins dominated by noise | Noise dominated (total time) | Noise dominated (detector-on time) | Marked lightcurve |
|---|---|---|---|---|---|---|---|
| A | 7782 | 6893 | 806 | 806 | 10.36% | 11.69% |  |
| B | 7782 | 6893 | 13 | 13 | 0.17% | 0.19% |  |
| C | 7782 | 6893 | 161 | 161 | 2.07% | 2.34% |  |
| D | 7782 | 6893 | 180 | 180 | 2.31% | 2.61% |  |
Top three noisy pixels from each quadrant. If the there are fewer than three noisy pixels in the level2.evt file, extra rows are filled as -1
| Pixel properties | Quadrant properties | ||||||
|---|---|---|---|---|---|---|---|
| Quadrant | DetID | PixID | Counts | Sigma | Mean | Median | Sigma |
| A | 12 | 115 | 3161566 | 18058.2 | 704 | 686 | 175.0 |
| A | 9 | 250 | 629478 | 3592.31 | 704 | 686 | 175.0 |
| A | 14 | 235 | 262815 | 1497.55 | 704 | 686 | 175.0 |
| B | 5 | 185 | 192357 | 1228.32 | 733 | 707 | 156.0 |
| B | 5 | 172 | 74679 | 474.1 | 733 | 707 | 156.0 |
| B | 7 | 0 | 51326 | 324.43 | 733 | 707 | 156.0 |
| C | 12 | 254 | 752775 | 3861.22 | 717 | 710 | 194.8 |
| C | 6 | 223 | 99760 | 508.54 | 717 | 710 | 194.8 |
| C | 12 | 252 | 43353 | 218.94 | 717 | 710 | 194.8 |
| D | 8 | 129 | 586572 | 2947.34 | 712 | 681 | 198.8 |
| D | 2 | 249 | 258210 | 1295.51 | 712 | 681 | 198.8 |
| D | 11 | 129 | 234328 | 1175.37 | 712 | 681 | 198.8 |
Histogram calculated using DETX and DETY for each event in the final _common_clean file
| Quadrant A |  |
 |
Quadrant B |
|---|---|---|---|
| Quadrant D |  |
 |
Quadrant C |
| Plot type | Count rate plots | Images |
|---|---|---|
| Comparison with Poisson distribution Blue bars denote a histogram of data divided into 1 sec bins. Red curve is a Poisson curve with rate = median count rate of data. |
 |
 |
| Quadrant-wise count rates Data is divided into 100 sec bins |
 |
|
| Module-wise count rates for Quadrant A Data is divided into 100 sec bins |
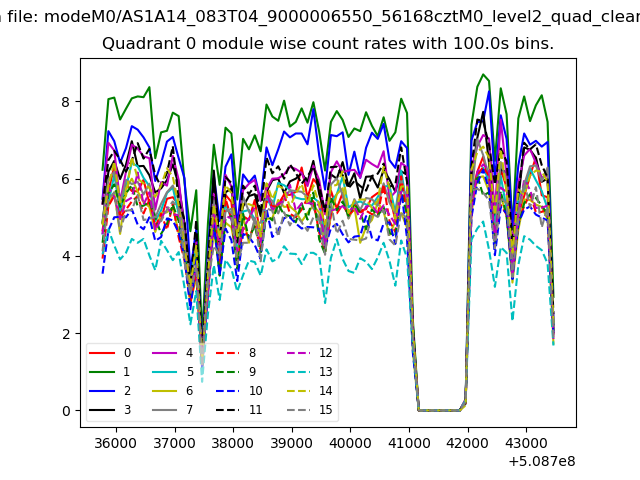 |
 |
| Module-wise count rates for Quadrant B Data is divided into 100 sec bins |
 |
 |
| Module-wise count rates for Quadrant C Data is divided into 100 sec bins |
 |
 |
| Module-wise count rates for Quadrant D Data is divided into 100 sec bins |
 |
 |
| Parameter | Plot |
|---|---|
| CZT HV Monitor |  |
| D_VDD |  |
| Temperature 1 |  |
| Veto HV Monitor |  |
| Veto LLD |  |
| Alpha Counter | 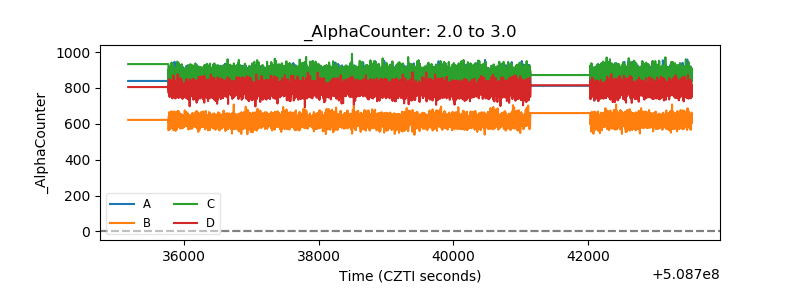 |
| _CPM_Rate |  |
| CZT Counter |  |
| +2.5 Volts monitor |  |
| +5 Volts monitor |  |
| _ROLL_ROT |  |
| _Roll_DEC |  |
| _Roll_RA |  |
| Veto Counter |  |