| Param | Original file | Final file |
|---|---|---|
| Filename | modeM0/AS1A14_083T04_9000006550_56170cztM0_level2.fits | modeM0/AS1A14_083T04_9000006550_56170cztM0_level2_quad_clean.evt |
| Size (bytes) | 464,866,560 | 90,394,560 |
| Size | 443.3 MB | 86.2 MB |
| Events in quadrant A | 5,364,087 | 559,083 |
| Events in quadrant B | 3,672,688 | 633,064 |
| Events in quadrant C | 2,894,058 | 583,705 |
| Events in quadrant D | 4,782,856 | 517,991 |
| Mode SS | |||
|---|---|---|---|
| Quadrant | BADHDUFLAG | Total packets | Discarded packets |
| A | 0 | 128 | 0 |
| B | 0 | 128 | 0 |
| C | 0 | 128 | 0 |
| D | 0 | 128 | 0 |
| Mode M9 | |||
|---|---|---|---|
| Quadrant | BADHDUFLAG | Total packets | Discarded packets |
| A | 0 | 11 | 0 |
| B | 0 | 11 | 0 |
| C | 0 | 11 | 0 |
| D | 0 | 11 | 0 |
| Mode M0 | |||
|---|---|---|---|
| Quadrant | BADHDUFLAG | Total packets | Discarded packets |
| A | 0 | 20290 | 1 |
| B | 0 | 15385 | 1 |
| C | 0 | 13455 | 1 |
| D | 0 | 18686 | 1 |
| Quadrant | Total seconds | Saturated seconds | Saturation percentage |
|---|---|---|---|
| A | 6353 | 686 | 10.798048% |
| B | 6354 | 362 | 5.697199% |
| C | 6354 | 82 | 1.290526% |
| D | 6354 | 480 | 7.554297% |
Noise dominated data is calculated using 1-second bins in cleaned event files. If a bin has >2000 counts, and if more than 50% of those come from <1% of pixels, then it is considered to be noise-dominated and hence unusable.
| Quadrant | # 1 sec bins | Bins with >0 counts | Bins with >2000 counts | High rate bins dominated by noise | Noise dominated (total time) | Noise dominated (detector-on time) | Marked lightcurve |
|---|---|---|---|---|---|---|---|
| A | 7378 | 6354 | 536 | 536 | 7.26% | 8.44% | 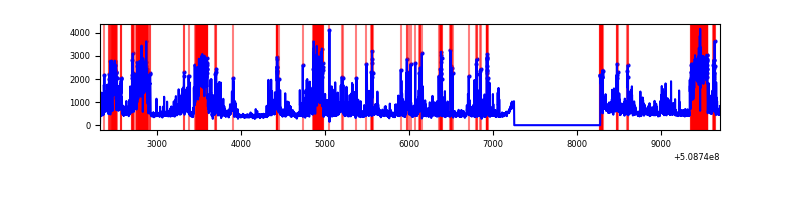 |
| B | 7379 | 6355 | 202 | 202 | 2.74% | 3.18% | 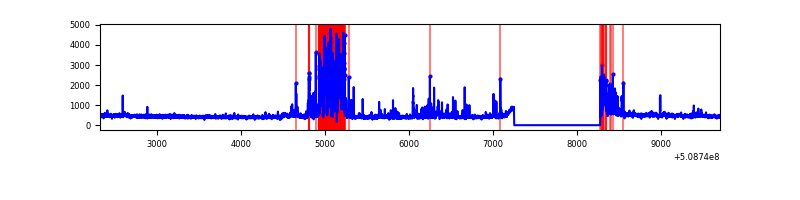 |
| C | 7379 | 6355 | 21 | 21 | 0.28% | 0.33% | 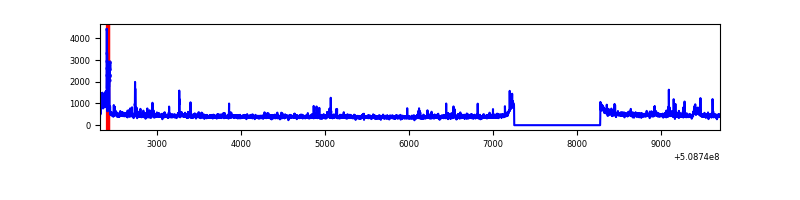 |
| D | 7379 | 6354 | 353 | 353 | 4.78% | 5.56% | 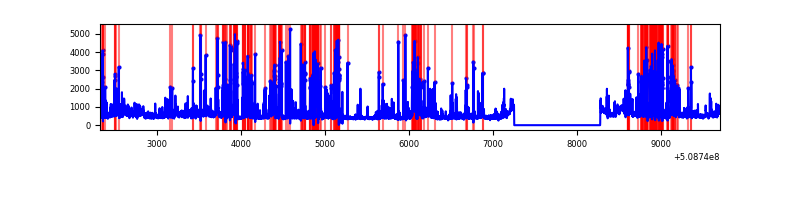 |
Top three noisy pixels from each quadrant. If the there are fewer than three noisy pixels in the level2.evt file, extra rows are filled as -1
| Pixel properties | Quadrant properties | ||||||
|---|---|---|---|---|---|---|---|
| Quadrant | DetID | PixID | Counts | Sigma | Mean | Median | Sigma |
| A | 12 | 115 | 1539495 | 9458.8 | 661 | 645 | 162.7 |
| A | 9 | 250 | 388926 | 2386.63 | 661 | 645 | 162.7 |
| A | 15 | 32 | 370881 | 2275.72 | 661 | 645 | 162.7 |
| B | 5 | 185 | 801924 | 5598.17 | 666 | 641 | 143.1 |
| B | 5 | 172 | 54321 | 375.04 | 666 | 641 | 143.1 |
| B | 10 | 247 | 31472 | 215.4 | 666 | 641 | 143.1 |
| C | 12 | 254 | 172340 | 932.2 | 672 | 665 | 184.2 |
| C | 12 | 252 | 70588 | 379.68 | 672 | 665 | 184.2 |
| C | 12 | 249 | 11471 | 58.67 | 672 | 665 | 184.2 |
| D | 8 | 129 | 1284102 | 7023.73 | 646 | 619 | 182.7 |
| D | 8 | 240 | 341218 | 1863.89 | 646 | 619 | 182.7 |
| D | 2 | 31 | 218221 | 1190.8 | 646 | 619 | 182.7 |
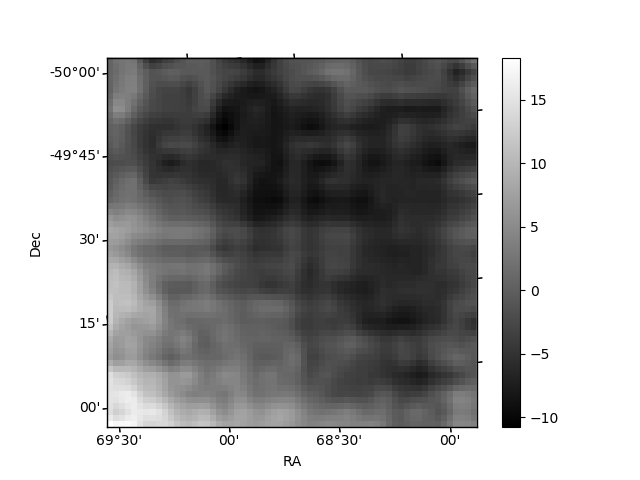
Histogram calculated using DETX and DETY for each event in the final _common_clean file
| Quadrant A |  |
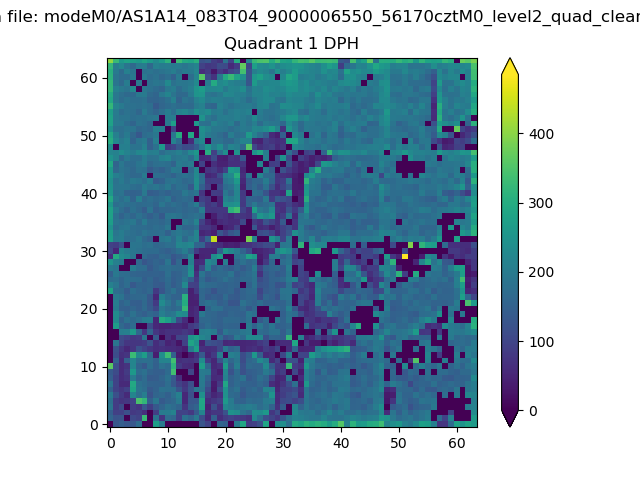 |
Quadrant B |
|---|---|---|---|
| Quadrant D |  |
 |
Quadrant C |
| Plot type | Count rate plots | Images |
|---|---|---|
| Comparison with Poisson distribution Blue bars denote a histogram of data divided into 1 sec bins. Red curve is a Poisson curve with rate = median count rate of data. |
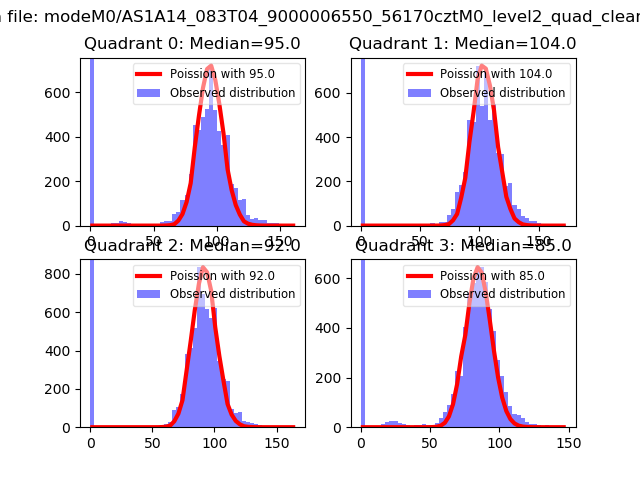 |
 |
| Quadrant-wise count rates Data is divided into 100 sec bins |
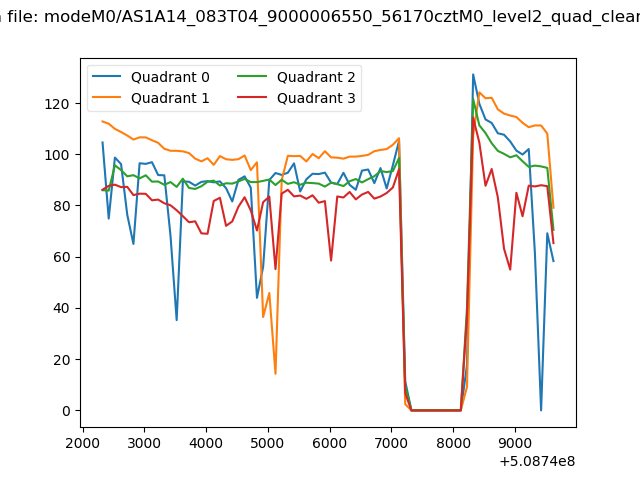 |
|
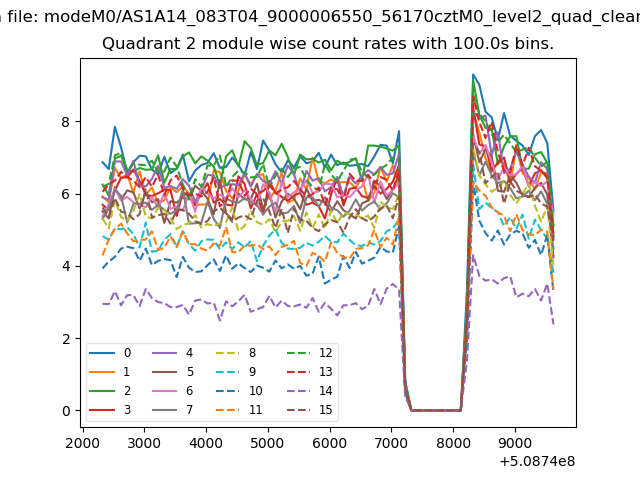
| Module-wise count rates for Quadrant A Data is divided into 100 sec bins |
 |
 |
| Module-wise count rates for Quadrant B Data is divided into 100 sec bins |
 |
 |
| Module-wise count rates for Quadrant C Data is divided into 100 sec bins |
 |
 |
| Module-wise count rates for Quadrant D Data is divided into 100 sec bins |
 |
 |
| Parameter | Plot |
|---|---|
| CZT HV Monitor | 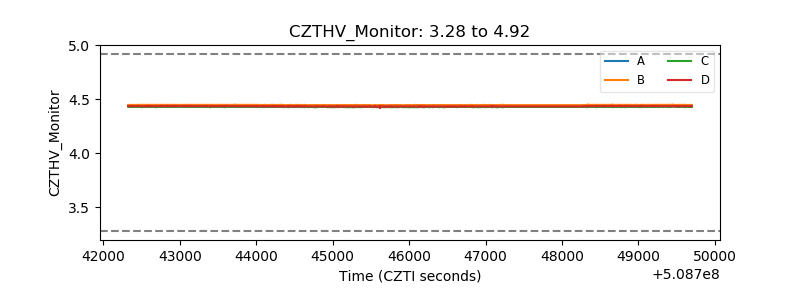 |
| D_VDD | 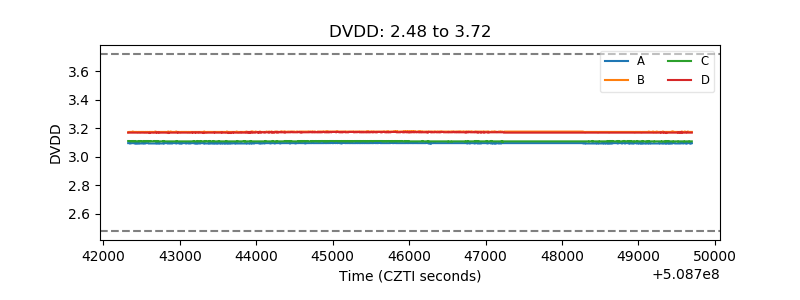 |
| Temperature 1 | 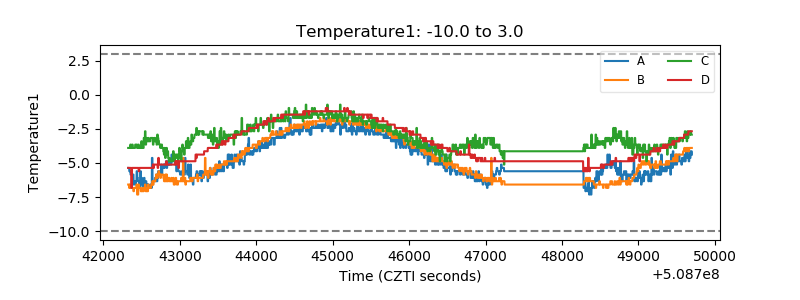 |
| Veto HV Monitor | 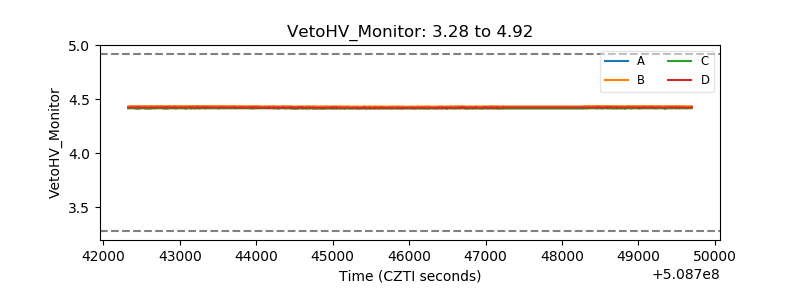 |
| Veto LLD | 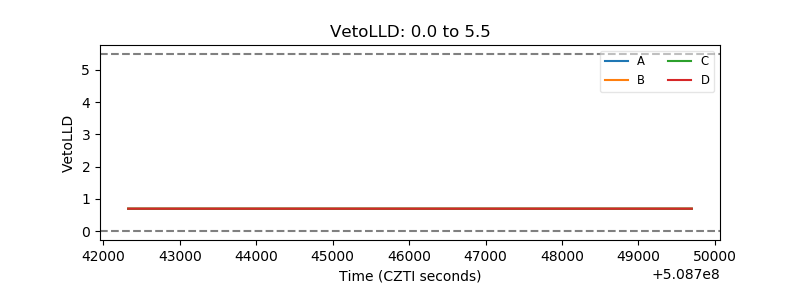 |
| Alpha Counter |  |
| _CPM_Rate |  |
| CZT Counter | 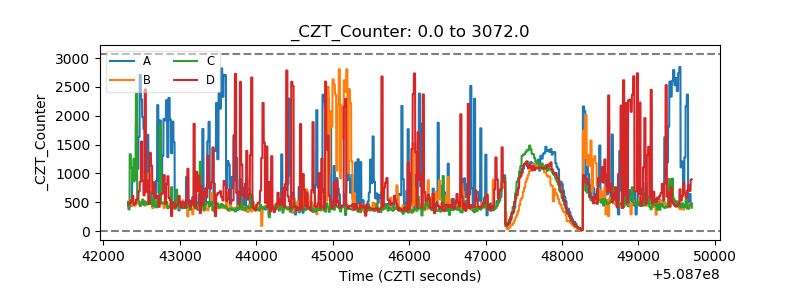 |
| +2.5 Volts monitor | 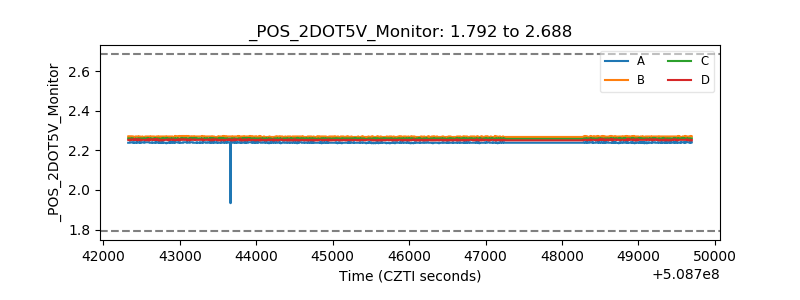 |
| +5 Volts monitor |  |
| _ROLL_ROT | 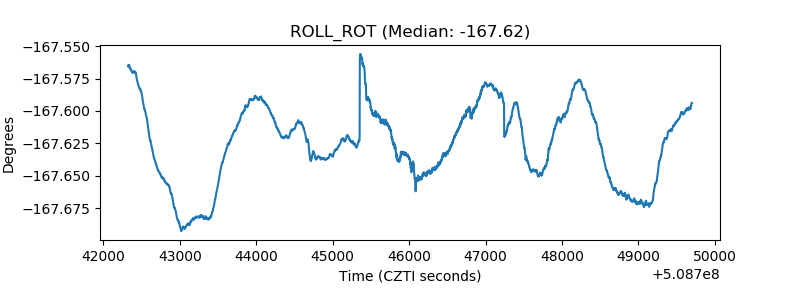 |
| _Roll_DEC | 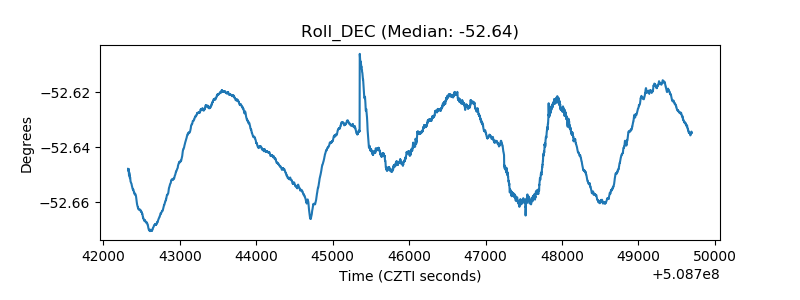 |
| _Roll_RA | 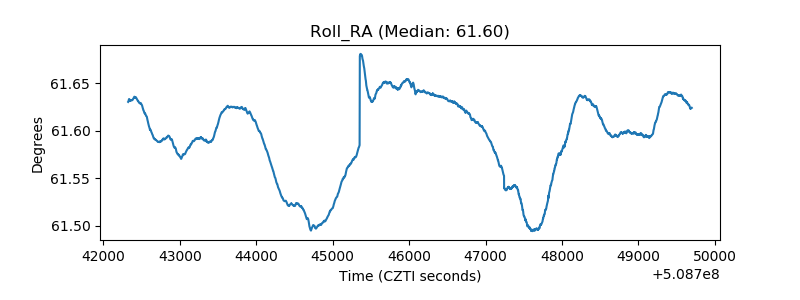 |
| Veto Counter | 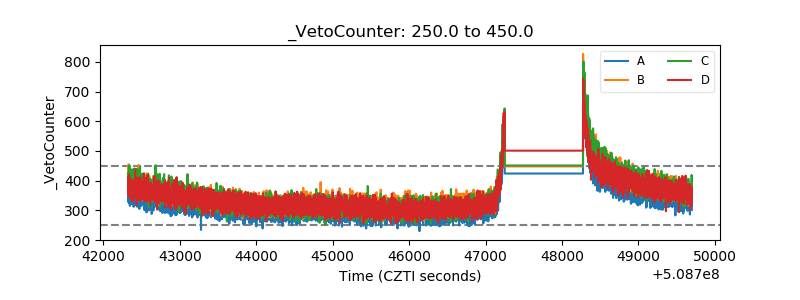 |