| Param | Original file | Final file |
|---|---|---|
| Filename | modeM0/AS1A14_083T04_9000006550_56171cztM0_level2.fits | modeM0/AS1A14_083T04_9000006550_56171cztM0_level2_quad_clean.evt |
| Size (bytes) | 504,374,400 | 96,649,920 |
| Size | 481.0 MB | 92.2 MB |
| Events in quadrant A | 5,846,289 | 594,519 |
| Events in quadrant B | 4,059,973 | 684,438 |
| Events in quadrant C | 3,507,910 | 625,148 |
| Events in quadrant D | 4,746,295 | 565,073 |
| Mode SS | |||
|---|---|---|---|
| Quadrant | BADHDUFLAG | Total packets | Discarded packets |
| A | 0 | 132 | 0 |
| B | 0 | 132 | 0 |
| C | 0 | 132 | 0 |
| D | 0 | 132 | 0 |
| Mode M9 | |||
|---|---|---|---|
| Quadrant | BADHDUFLAG | Total packets | Discarded packets |
| A | 0 | 15 | 0 |
| B | 0 | 15 | 0 |
| C | 0 | 16 | 0 |
| D | 0 | 16 | 0 |
| Mode M0 | |||
|---|---|---|---|
| Quadrant | BADHDUFLAG | Total packets | Discarded packets |
| A | 0 | 21843 | 2 |
| B | 0 | 16401 | 2 |
| C | 0 | 15186 | 2 |
| D | 0 | 18619 | 2 |
| Quadrant | Total seconds | Saturated seconds | Saturation percentage |
|---|---|---|---|
| A | 6563 | 825 | 12.570471% |
| B | 6563 | 422 | 6.429986% |
| C | 6563 | 193 | 2.940728% |
| D | 6563 | 428 | 6.521408% |
Noise dominated data is calculated using 1-second bins in cleaned event files. If a bin has >2000 counts, and if more than 50% of those come from <1% of pixels, then it is considered to be noise-dominated and hence unusable.
| Quadrant | # 1 sec bins | Bins with >0 counts | Bins with >2000 counts | High rate bins dominated by noise | Noise dominated (total time) | Noise dominated (detector-on time) | Marked lightcurve |
|---|---|---|---|---|---|---|---|
| A | 7668 | 6564 | 589 | 589 | 7.68% | 8.97% | 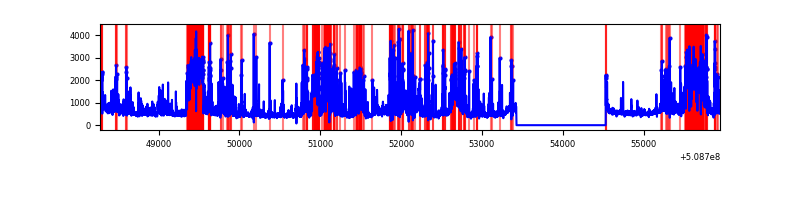 |
| B | 7668 | 6564 | 193 | 193 | 2.52% | 2.94% | 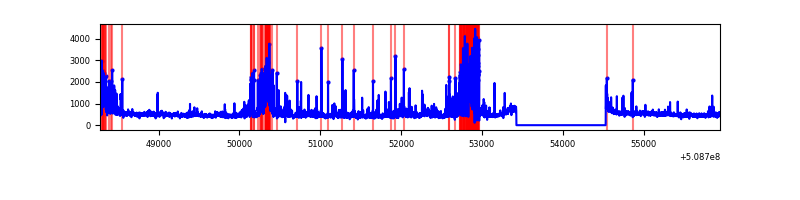 |
| C | 7668 | 6564 | 109 | 109 | 1.42% | 1.66% | 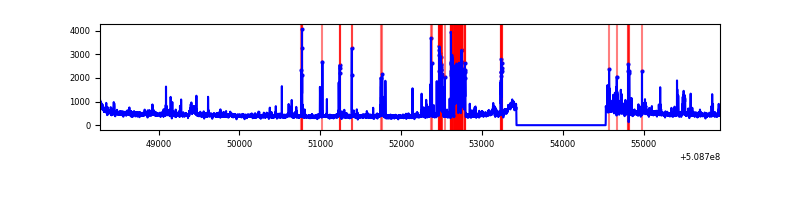 |
| D | 7668 | 6564 | 275 | 275 | 3.59% | 4.19% | 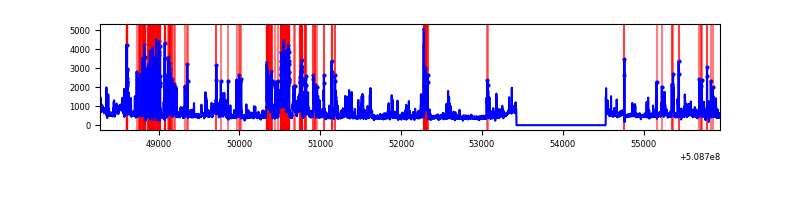 |
Top three noisy pixels from each quadrant. If the there are fewer than three noisy pixels in the level2.evt file, extra rows are filled as -1
| Pixel properties | Quadrant properties | ||||||
|---|---|---|---|---|---|---|---|
| Quadrant | DetID | PixID | Counts | Sigma | Mean | Median | Sigma |
| A | 12 | 115 | 1375510 | 7887.69 | 703 | 685 | 174.3 |
| A | 9 | 250 | 718084 | 4115.89 | 703 | 685 | 174.3 |
| A | 7 | 64 | 503223 | 2883.18 | 703 | 685 | 174.3 |
| B | 4 | 156 | 478267 | 3152.74 | 712 | 687 | 151.5 |
| B | 5 | 185 | 405554 | 2672.73 | 712 | 687 | 151.5 |
| B | 5 | 172 | 101413 | 664.94 | 712 | 687 | 151.5 |
| C | 1 | 157 | 327281 | 1668.75 | 717 | 709 | 195.7 |
| C | 12 | 254 | 158671 | 807.17 | 717 | 709 | 195.7 |
| C | 12 | 252 | 77548 | 392.64 | 717 | 709 | 195.7 |
| D | 8 | 240 | 871043 | 4430.67 | 700 | 670 | 196.4 |
| D | 8 | 129 | 566999 | 2882.92 | 700 | 670 | 196.4 |
| D | 11 | 129 | 224736 | 1140.62 | 700 | 670 | 196.4 |
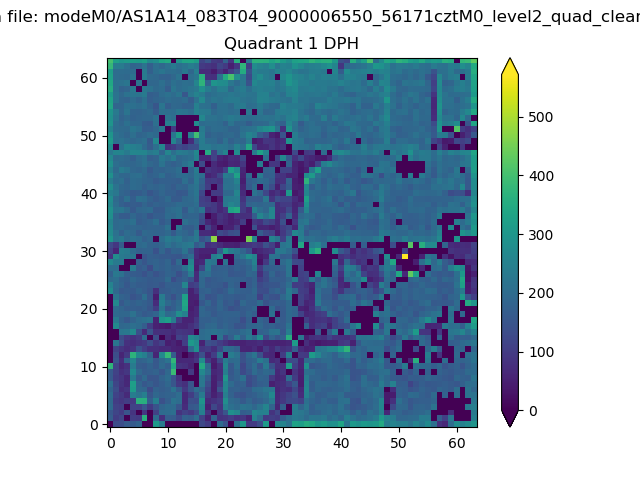
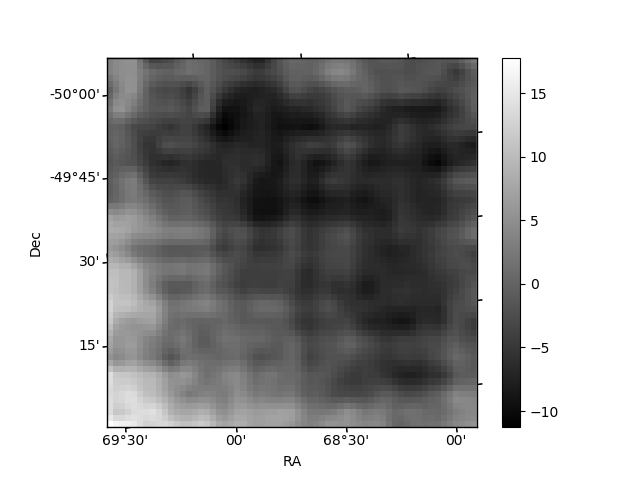
Histogram calculated using DETX and DETY for each event in the final _common_clean file
| Quadrant A |  |
 |
Quadrant B |
|---|---|---|---|
| Quadrant D |  |
 |
Quadrant C |
| Plot type | Count rate plots | Images |
|---|---|---|
| Comparison with Poisson distribution Blue bars denote a histogram of data divided into 1 sec bins. Red curve is a Poisson curve with rate = median count rate of data. |
 |
 |
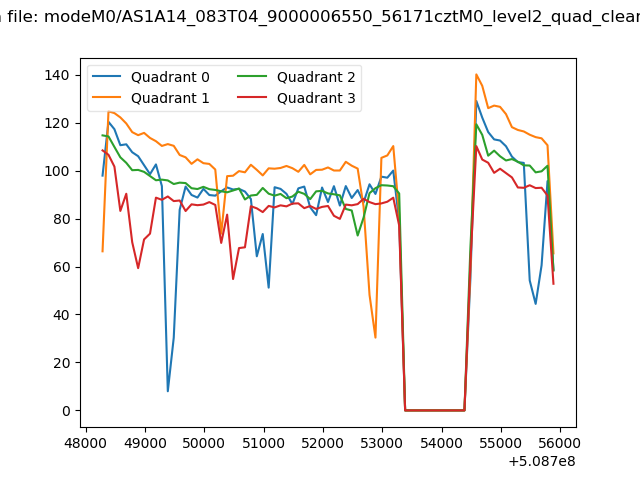
| Quadrant-wise count rates Data is divided into 100 sec bins |
 |
|
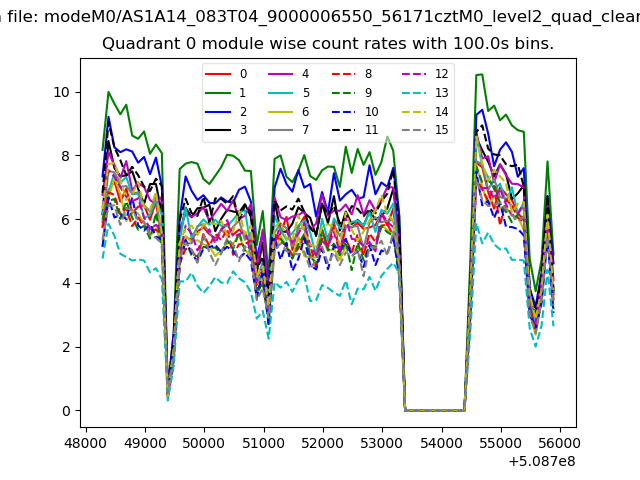
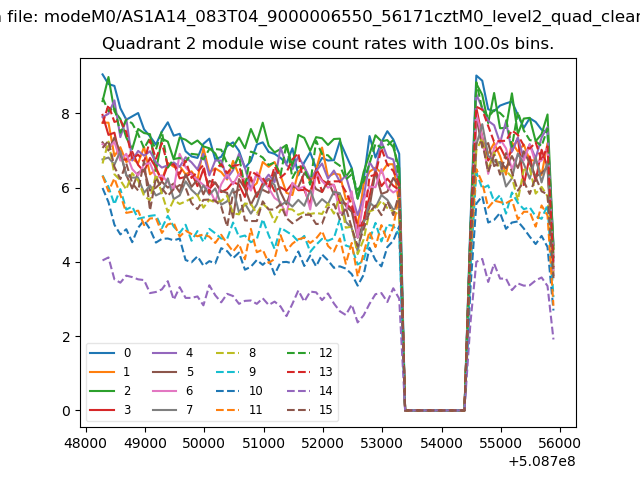
| Module-wise count rates for Quadrant A Data is divided into 100 sec bins |
 |
 |
| Module-wise count rates for Quadrant B Data is divided into 100 sec bins |
 |
 |
| Module-wise count rates for Quadrant C Data is divided into 100 sec bins |
 |
 |
| Module-wise count rates for Quadrant D Data is divided into 100 sec bins |
 |
 |
| Parameter | Plot |
|---|---|
| CZT HV Monitor | 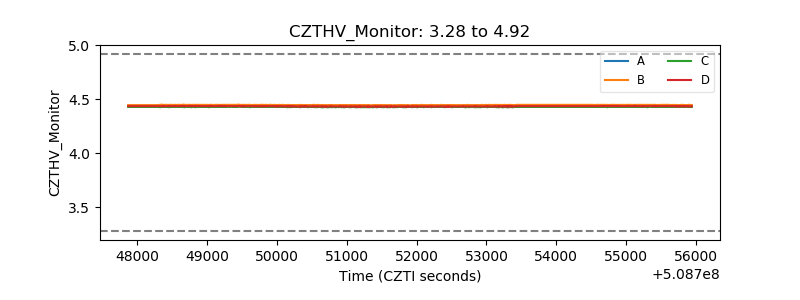 |
| D_VDD | 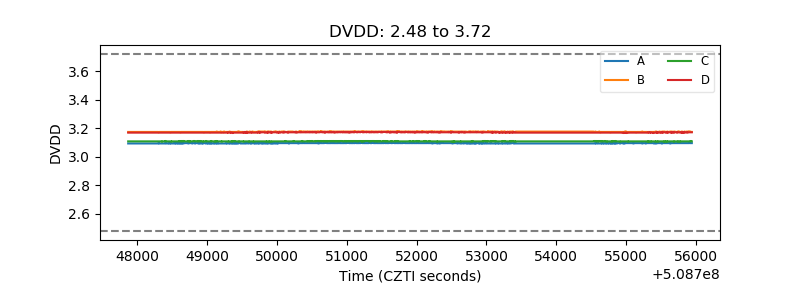 |
| Temperature 1 | 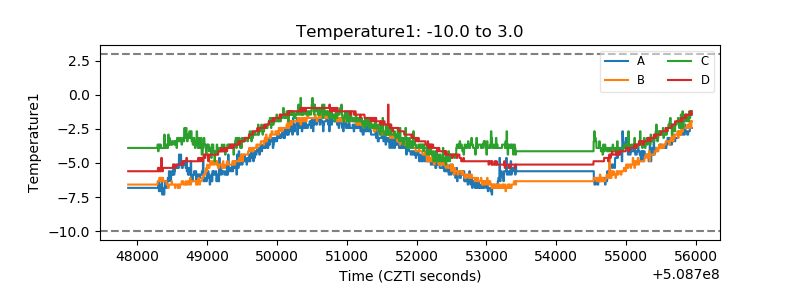 |
| Veto HV Monitor | 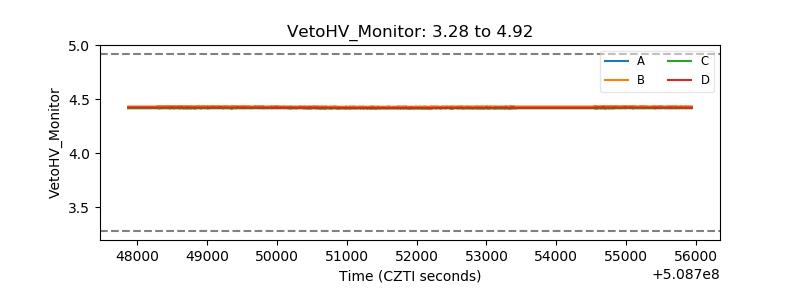 |
| Veto LLD | 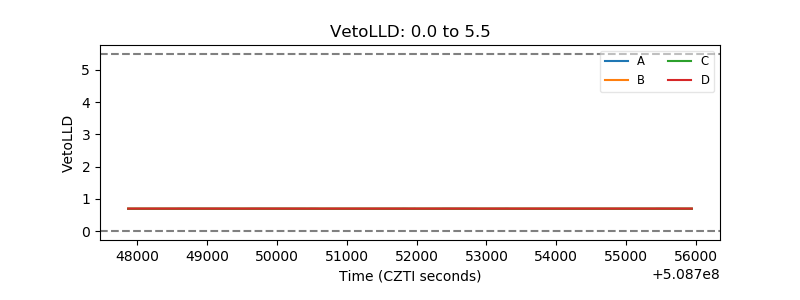 |
| Alpha Counter |  |
| _CPM_Rate |  |
| CZT Counter | 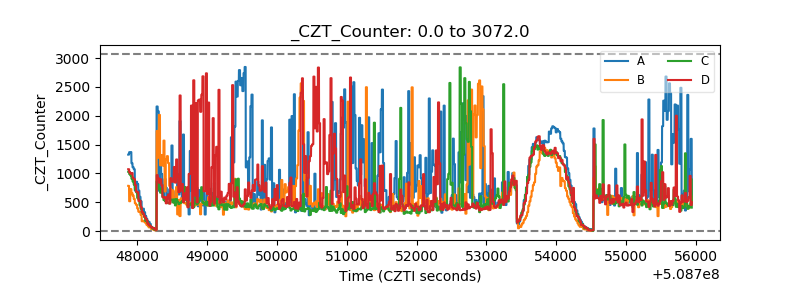 |
| +2.5 Volts monitor |  |
| +5 Volts monitor |  |
| _ROLL_ROT | 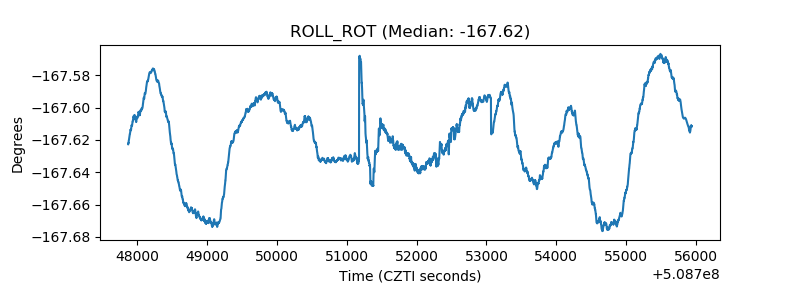 |
| _Roll_DEC | 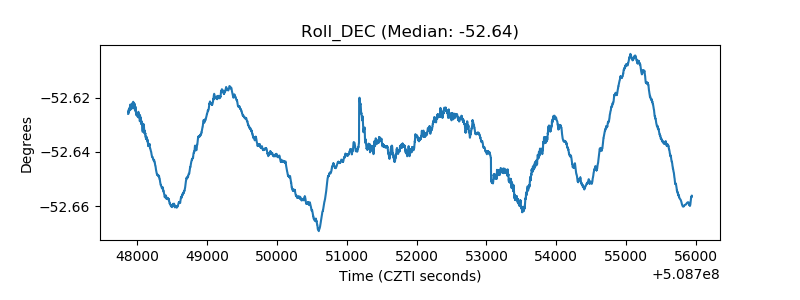 |
| _Roll_RA | 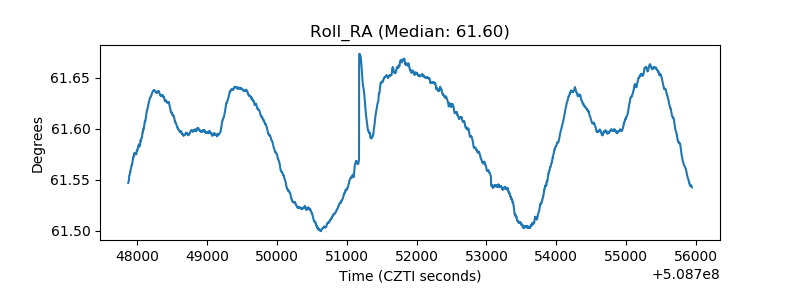 |
| Veto Counter | 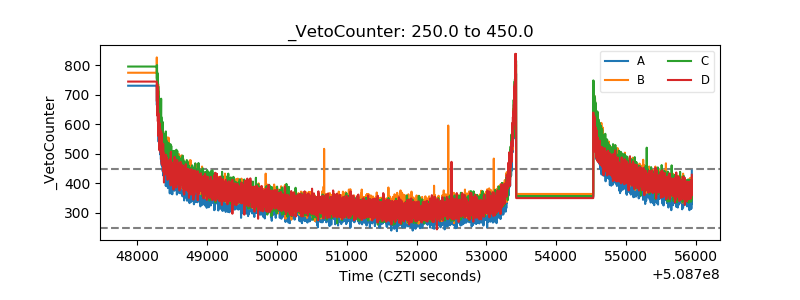 |