| Param | Original file | Final file |
|---|---|---|
| Filename | modeM0/AS1A14_083T04_9000006550_56175cztM0_level2.fits | modeM0/AS1A14_083T04_9000006550_56175cztM0_level2_quad_clean.evt |
| Size (bytes) | 663,969,600 | 79,344,000 |
| Size | 633.2 MB | 75.7 MB |
| Events in quadrant A | 11,512,005 | 311,886 |
| Events in quadrant B | 4,198,412 | 617,144 |
| Events in quadrant C | 4,459,321 | 537,730 |
| Events in quadrant D | 3,931,869 | 506,331 |
| Mode SS | |||
|---|---|---|---|
| Quadrant | BADHDUFLAG | Total packets | Discarded packets |
| A | 0 | 126 | 0 |
| B | 0 | 126 | 0 |
| C | 0 | 126 | 0 |
| D | 0 | 126 | 0 |
| Mode M9 | |||
|---|---|---|---|
| Quadrant | BADHDUFLAG | Total packets | Discarded packets |
| A | 0 | 8 | 0 |
| B | 0 | 8 | 0 |
| C | 0 | 8 | 0 |
| D | 0 | 8 | 0 |
| Mode M0 | |||
|---|---|---|---|
| Quadrant | BADHDUFLAG | Total packets | Discarded packets |
| A | 0 | 38493 | 3 |
| B | 0 | 16837 | 1 |
| C | 0 | 17800 | 1 |
| D | 0 | 16143 | 1 |
| Quadrant | Total seconds | Saturated seconds | Saturation percentage |
|---|---|---|---|
| A | 6143 | 3173 | 51.652287% |
| B | 6143 | 193 | 3.141787% |
| C | 6144 | 329 | 5.354818% |
| D | 6144 | 288 | 4.687500% |
Noise dominated data is calculated using 1-second bins in cleaned event files. If a bin has >2000 counts, and if more than 50% of those come from <1% of pixels, then it is considered to be noise-dominated and hence unusable.
| Quadrant | # 1 sec bins | Bins with >0 counts | Bins with >2000 counts | High rate bins dominated by noise | Noise dominated (total time) | Noise dominated (detector-on time) | Marked lightcurve |
|---|---|---|---|---|---|---|---|
| A | 6923 | 6144 | 2826 | 2826 | 40.82% | 46.00% | 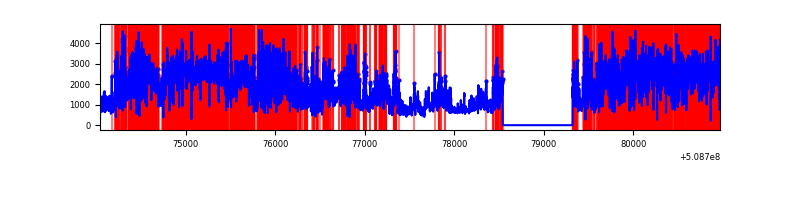 |
| B | 6923 | 6144 | 55 | 55 | 0.79% | 0.90% | 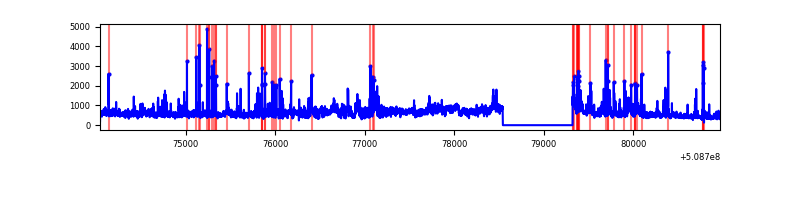 |
| C | 6924 | 6145 | 288 | 288 | 4.16% | 4.69% | 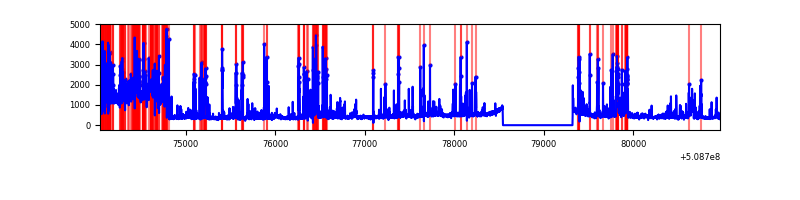 |
| D | 6924 | 6145 | 203 | 203 | 2.93% | 3.30% | 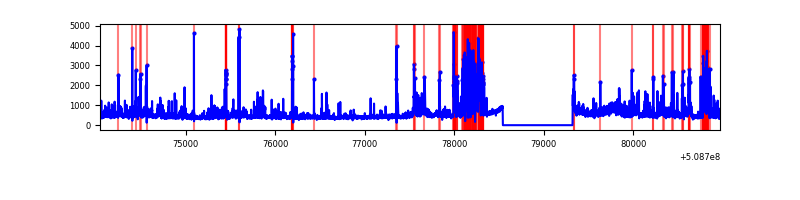 |
Top three noisy pixels from each quadrant. If the there are fewer than three noisy pixels in the level2.evt file, extra rows are filled as -1
| Pixel properties | Quadrant properties | ||||||
|---|---|---|---|---|---|---|---|
| Quadrant | DetID | PixID | Counts | Sigma | Mean | Median | Sigma |
| A | 12 | 115 | 4785228 | 38980.87 | 494 | 482 | 122.7 |
| A | 15 | 32 | 2253814 | 18357.68 | 494 | 482 | 122.7 |
| A | 8 | 176 | 838813 | 6829.8 | 494 | 482 | 122.7 |
| B | 15 | 52 | 827084 | 6097.3 | 639 | 616 | 135.5 |
| B | 5 | 185 | 143154 | 1051.58 | 639 | 616 | 135.5 |
| B | 10 | 247 | 137690 | 1011.27 | 639 | 616 | 135.5 |
| C | 12 | 254 | 919781 | 5500.11 | 612 | 606 | 167.1 |
| C | 9 | 38 | 610056 | 3646.79 | 612 | 606 | 167.1 |
| C | 1 | 12 | 146004 | 870.02 | 612 | 606 | 167.1 |
| D | 8 | 240 | 508947 | 2937.21 | 608 | 578 | 173.1 |
| D | 11 | 129 | 278821 | 1607.6 | 608 | 578 | 173.1 |
| D | 12 | 191 | 247307 | 1425.53 | 608 | 578 | 173.1 |
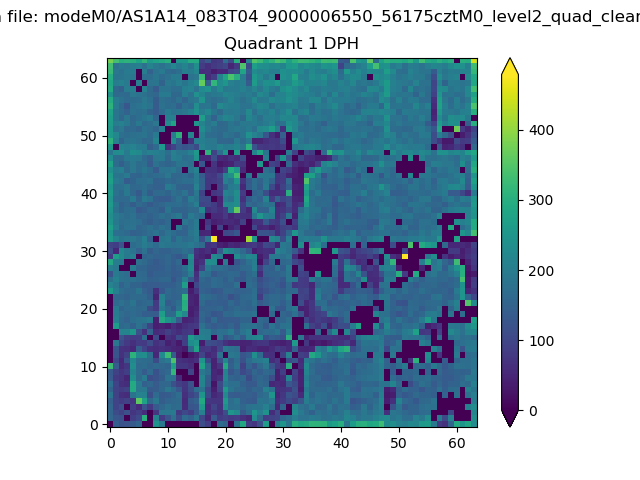
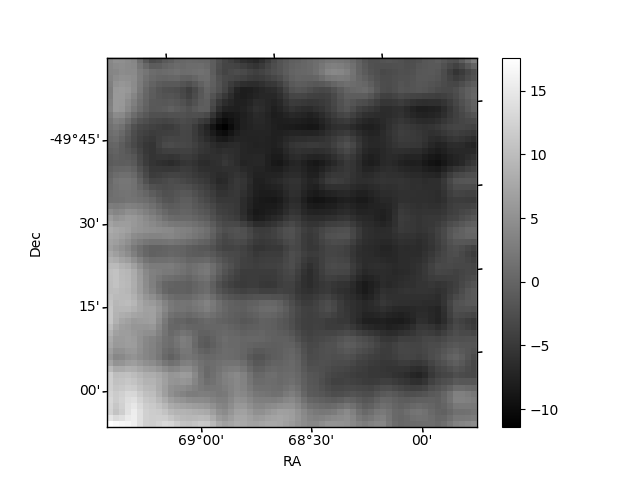
Histogram calculated using DETX and DETY for each event in the final _common_clean file
| Quadrant A |  |
 |
Quadrant B |
|---|---|---|---|
| Quadrant D |  |
 |
Quadrant C |
| Plot type | Count rate plots | Images |
|---|---|---|
| Comparison with Poisson distribution Blue bars denote a histogram of data divided into 1 sec bins. Red curve is a Poisson curve with rate = median count rate of data. |
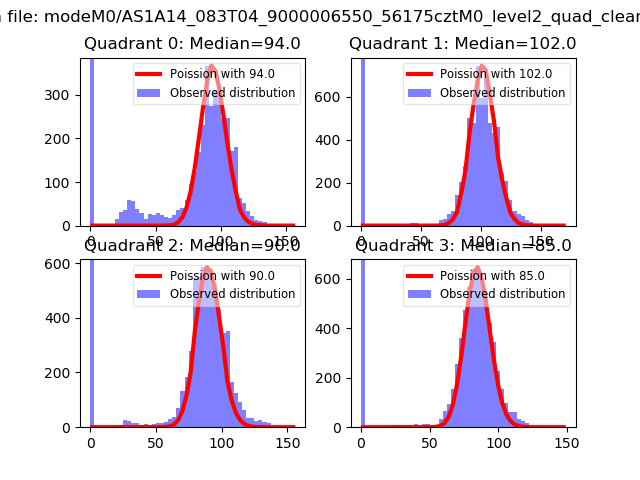 |
 |
| Quadrant-wise count rates Data is divided into 100 sec bins |
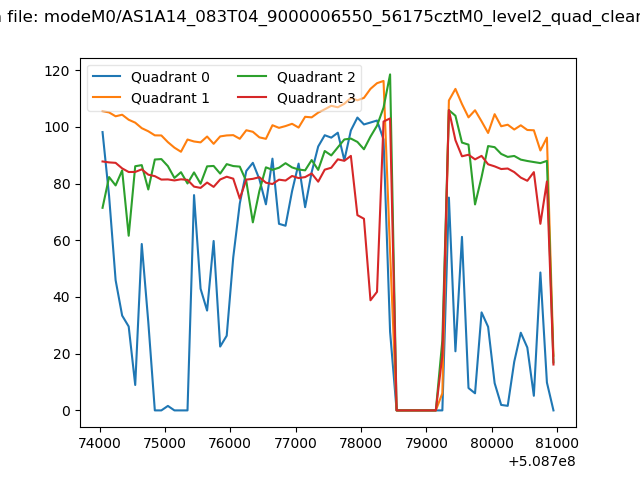 |
|
| Module-wise count rates for Quadrant A Data is divided into 100 sec bins |
 |
 |
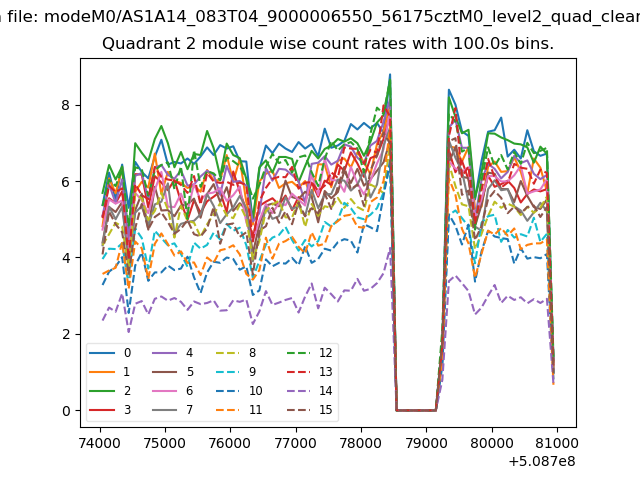
| Module-wise count rates for Quadrant B Data is divided into 100 sec bins |
 |
 |
| Module-wise count rates for Quadrant C Data is divided into 100 sec bins |
 |
 |
| Module-wise count rates for Quadrant D Data is divided into 100 sec bins |
 |
 |
| Parameter | Plot |
|---|---|
| CZT HV Monitor | 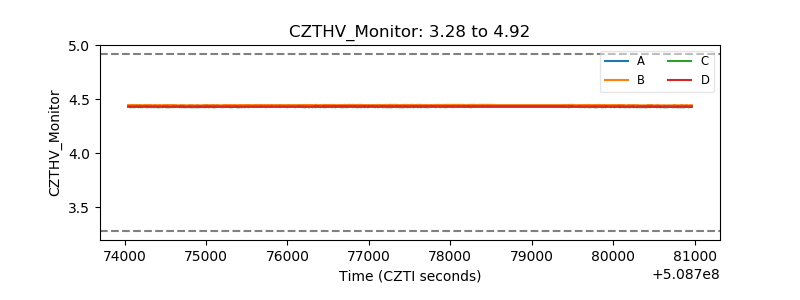 |
| D_VDD | 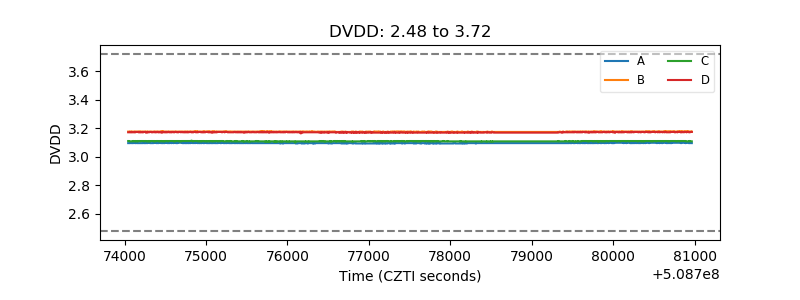 |
| Temperature 1 | 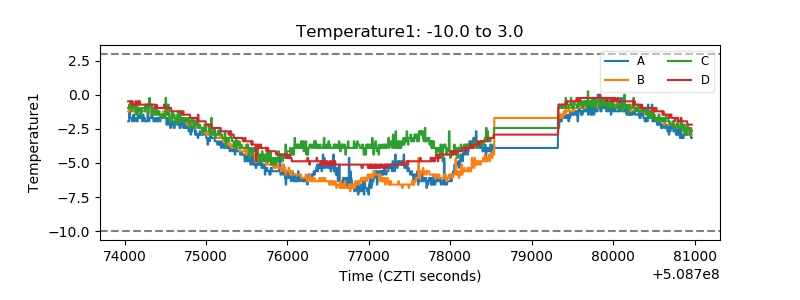 |
| Veto HV Monitor | 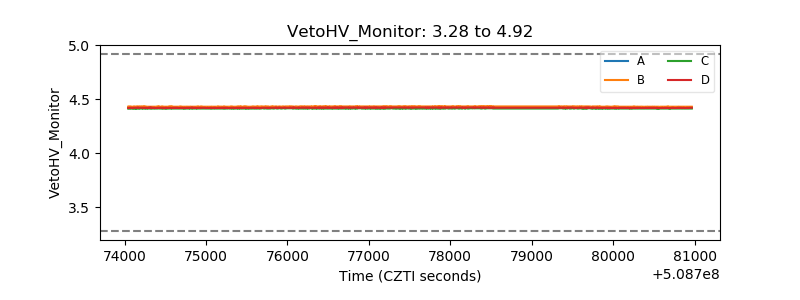 |
| Veto LLD | 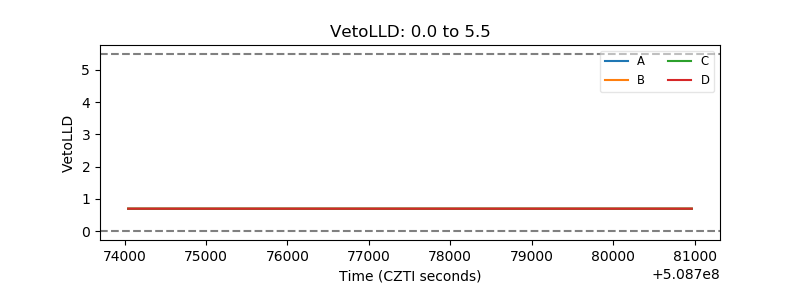 |
| Alpha Counter |  |
| _CPM_Rate |  |
| CZT Counter | 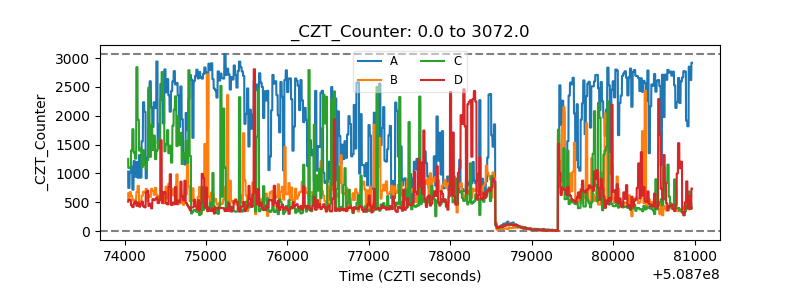 |
| +2.5 Volts monitor |  |
| +5 Volts monitor |  |
| _ROLL_ROT | 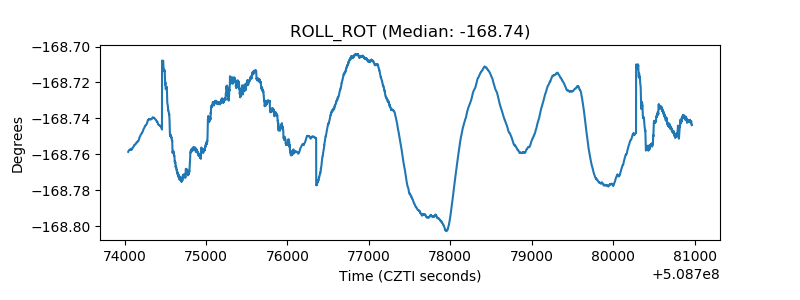 |
| _Roll_DEC | 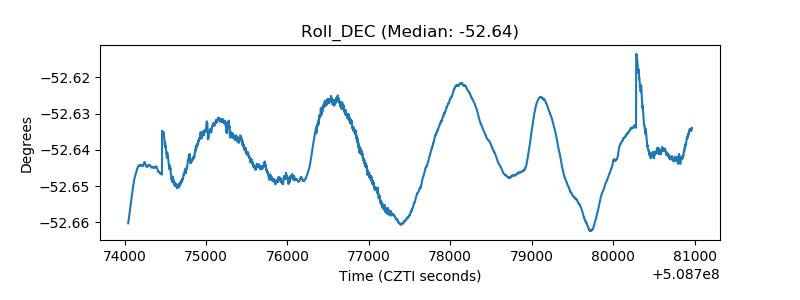 |
| _Roll_RA | 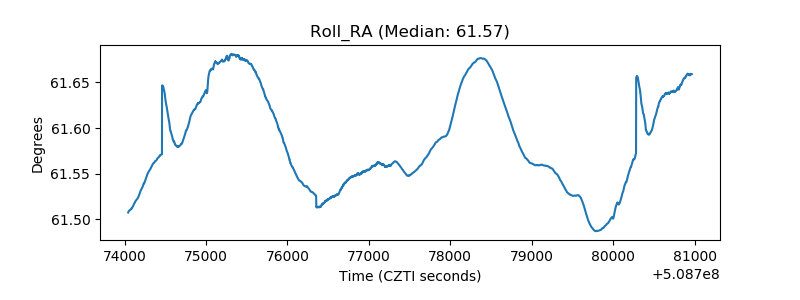 |
| Veto Counter | 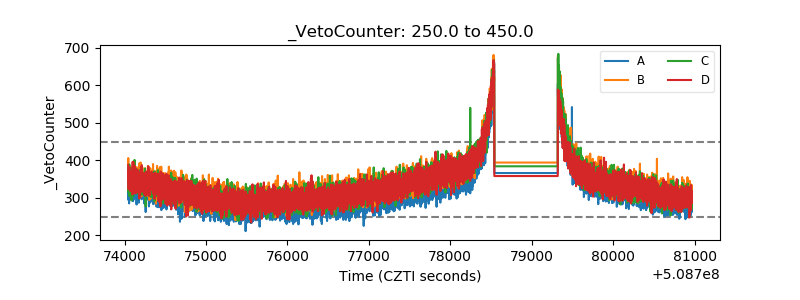 |