| Param | Original file | Final file |
|---|---|---|
| Filename | modeM0/AS1A14_083T04_9000006550_56176cztM0_level2.fits | modeM0/AS1A14_083T04_9000006550_56176cztM0_level2_quad_clean.evt |
| Size (bytes) | 629,418,240 | 86,135,040 |
| Size | 600.3 MB | 82.1 MB |
| Events in quadrant A | 10,261,367 | 408,861 |
| Events in quadrant B | 4,402,932 | 637,944 |
| Events in quadrant C | 4,230,276 | 547,209 |
| Events in quadrant D | 3,889,702 | 551,193 |
| Mode SS | |||
|---|---|---|---|
| Quadrant | BADHDUFLAG | Total packets | Discarded packets |
| A | 0 | 136 | 0 |
| B | 0 | 136 | 0 |
| C | 0 | 136 | 0 |
| D | 0 | 136 | 0 |
| Mode M9 | |||
|---|---|---|---|
| Quadrant | BADHDUFLAG | Total packets | Discarded packets |
| A | 0 | 2 | 0 |
| B | 0 | 2 | 0 |
| C | 0 | 2 | 0 |
| D | 0 | 2 | 0 |
| Mode M0 | |||
|---|---|---|---|
| Quadrant | BADHDUFLAG | Total packets | Discarded packets |
| A | 0 | 34961 | 2 |
| B | 0 | 17664 | 1 |
| C | 0 | 17698 | 1 |
| D | 0 | 16446 | 1 |
| Quadrant | Total seconds | Saturated seconds | Saturation percentage |
|---|---|---|---|
| A | 6629 | 2617 | 39.478051% |
| B | 6629 | 431 | 6.501735% |
| C | 6630 | 566 | 8.536953% |
| D | 6630 | 150 | 2.262443% |
Noise dominated data is calculated using 1-second bins in cleaned event files. If a bin has >2000 counts, and if more than 50% of those come from <1% of pixels, then it is considered to be noise-dominated and hence unusable.
| Quadrant | # 1 sec bins | Bins with >0 counts | Bins with >2000 counts | High rate bins dominated by noise | Noise dominated (total time) | Noise dominated (detector-on time) | Marked lightcurve |
|---|---|---|---|---|---|---|---|
| A | 6879 | 6631 | 2274 | 2274 | 33.06% | 34.29% | 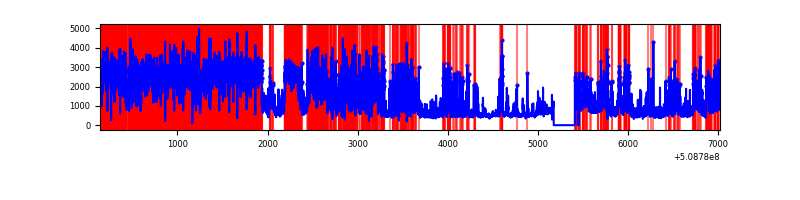 |
| B | 6879 | 6631 | 198 | 198 | 2.88% | 2.99% | 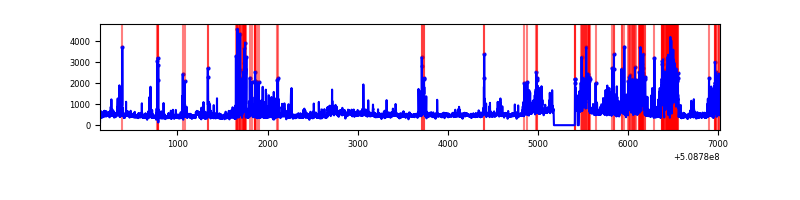 |
| C | 6880 | 6632 | 300 | 300 | 4.36% | 4.52% | 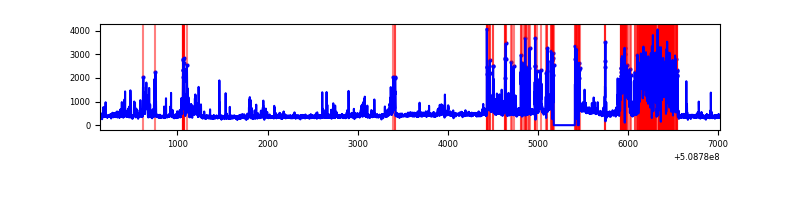 |
| D | 6880 | 6632 | 135 | 135 | 1.96% | 2.04% | 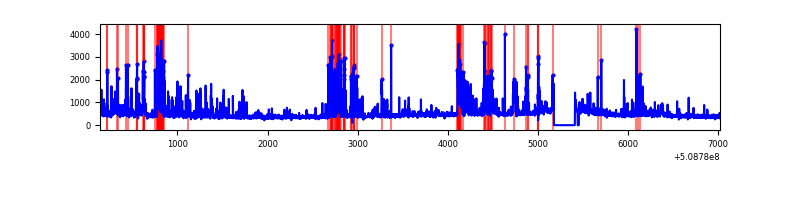 |
Top three noisy pixels from each quadrant. If the there are fewer than three noisy pixels in the level2.evt file, extra rows are filled as -1
| Pixel properties | Quadrant properties | ||||||
|---|---|---|---|---|---|---|---|
| Quadrant | DetID | PixID | Counts | Sigma | Mean | Median | Sigma |
| A | 12 | 115 | 4596108 | 31363.46 | 589 | 574 | 146.5 |
| A | 7 | 64 | 1710616 | 11670.64 | 589 | 574 | 146.5 |
| A | 15 | 32 | 823744 | 5617.95 | 589 | 574 | 146.5 |
| B | 4 | 171 | 608104 | 4157.6 | 684 | 659 | 146.1 |
| B | 10 | 247 | 251406 | 1716.21 | 684 | 659 | 146.1 |
| B | 5 | 172 | 219012 | 1494.5 | 684 | 659 | 146.1 |
| C | 1 | 12 | 744355 | 4148.74 | 654 | 647 | 179.3 |
| C | 12 | 254 | 535107 | 2981.46 | 654 | 647 | 179.3 |
| C | 15 | 230 | 214862 | 1194.99 | 654 | 647 | 179.3 |
| D | 8 | 240 | 573738 | 3017.76 | 669 | 639 | 189.9 |
| D | 2 | 249 | 193968 | 1018.01 | 669 | 639 | 189.9 |
| D | 11 | 129 | 77877 | 406.71 | 669 | 639 | 189.9 |
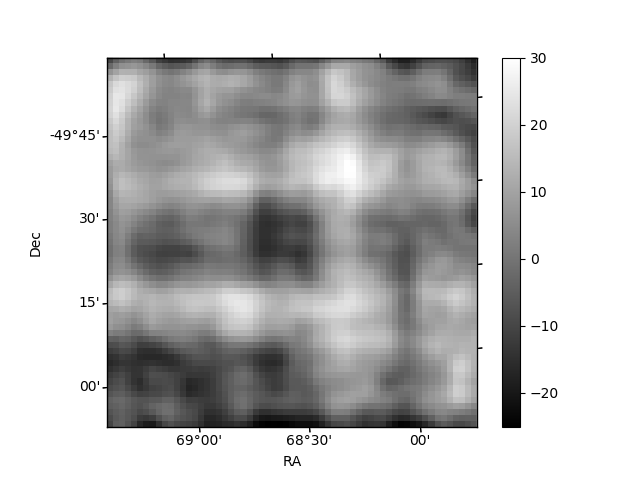
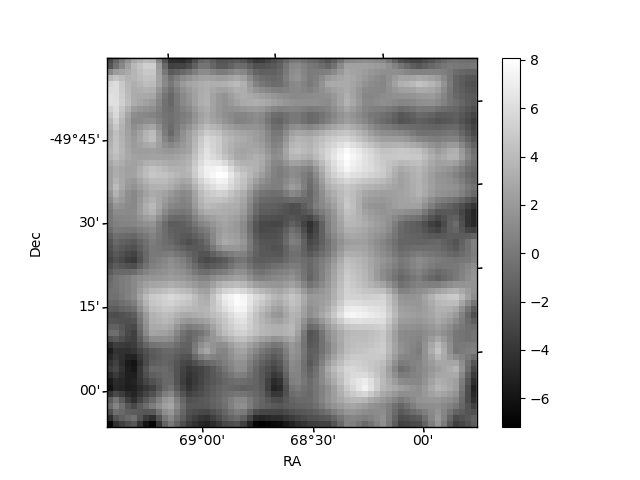
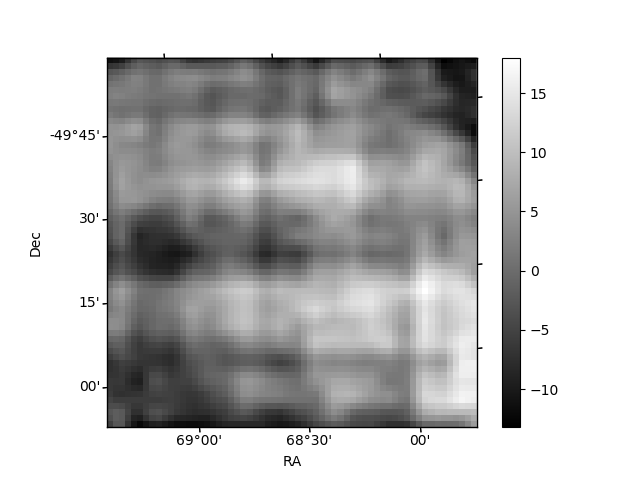
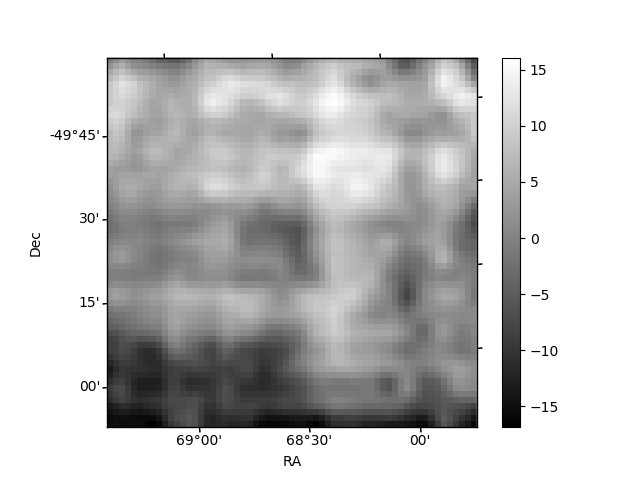
Histogram calculated using DETX and DETY for each event in the final _common_clean file
| Quadrant A | 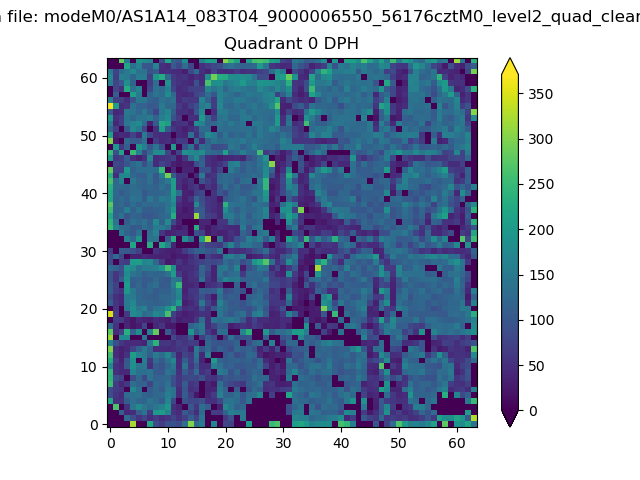 |
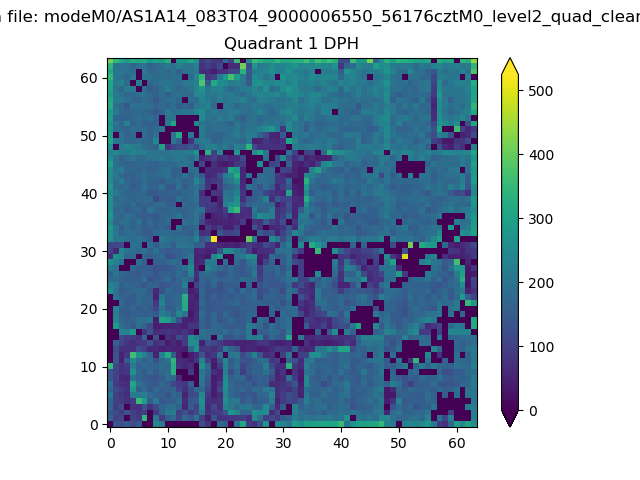 |
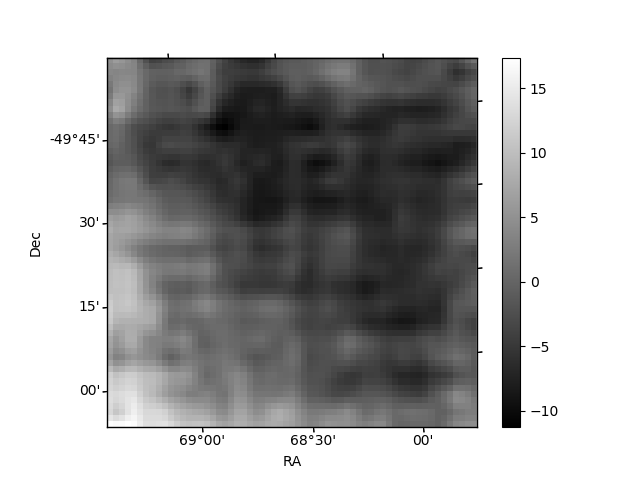
Quadrant B |
|---|---|---|---|
| Quadrant D | 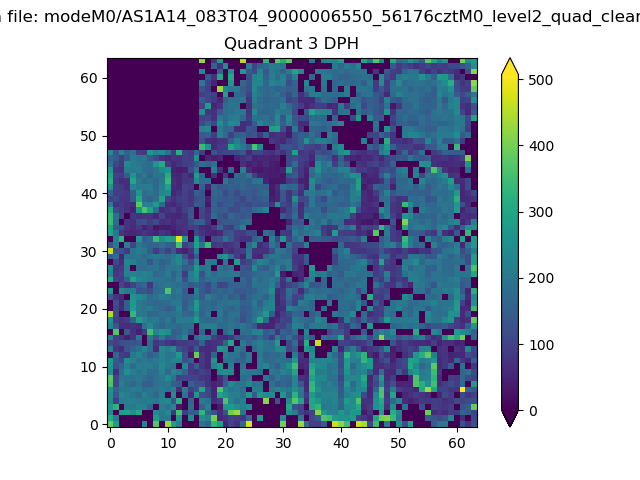 |
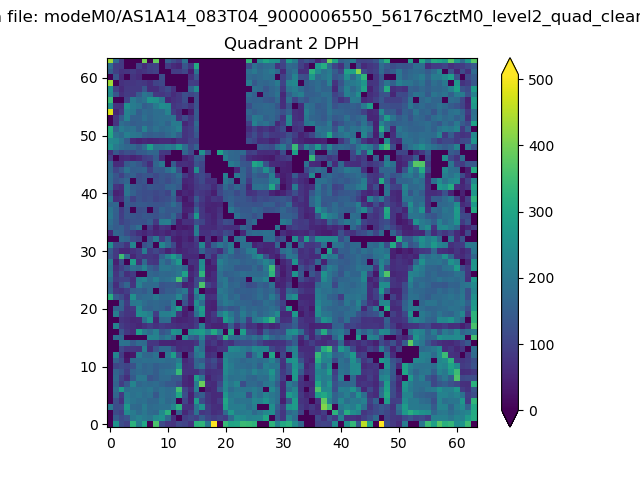 |
Quadrant C |
| Plot type | Count rate plots | Images |
|---|---|---|
| Comparison with Poisson distribution Blue bars denote a histogram of data divided into 1 sec bins. Red curve is a Poisson curve with rate = median count rate of data. |
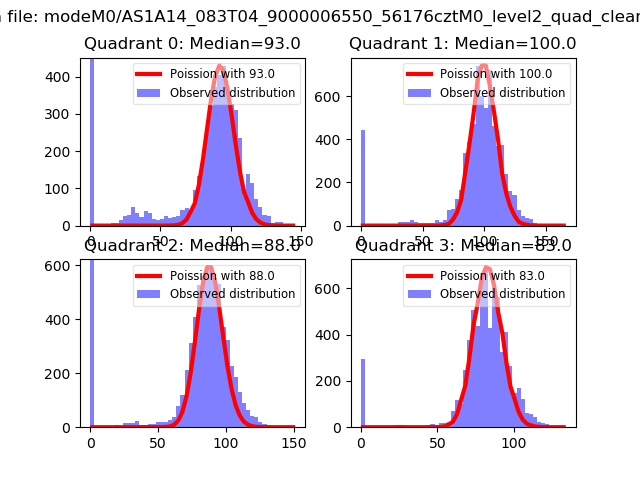 |
 |
| Quadrant-wise count rates Data is divided into 100 sec bins |
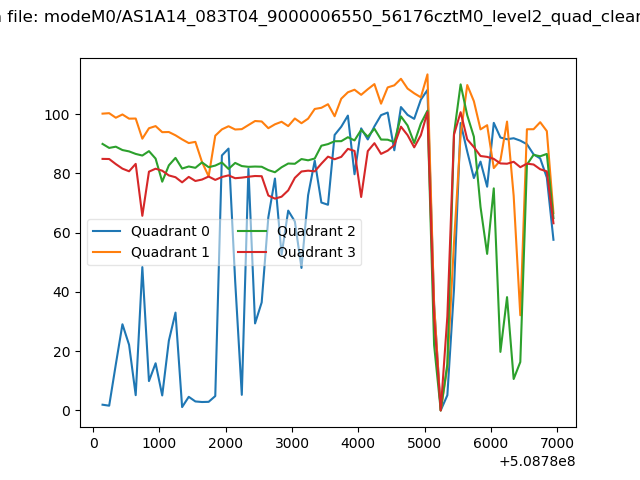 |
|
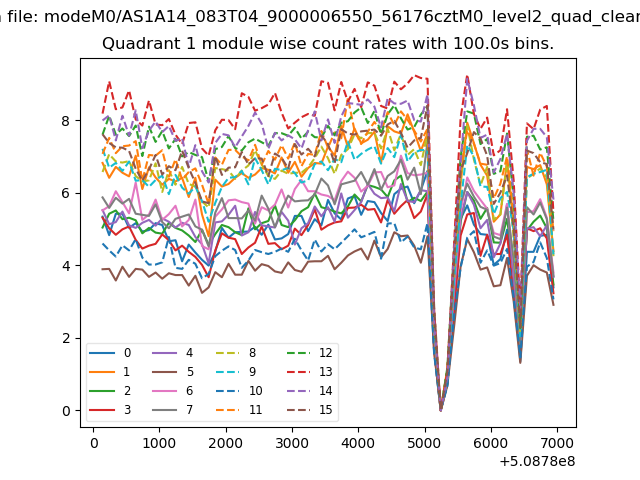
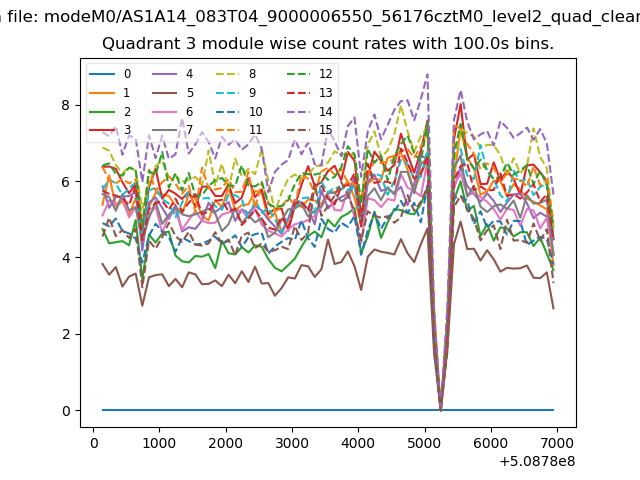
| Module-wise count rates for Quadrant A Data is divided into 100 sec bins |
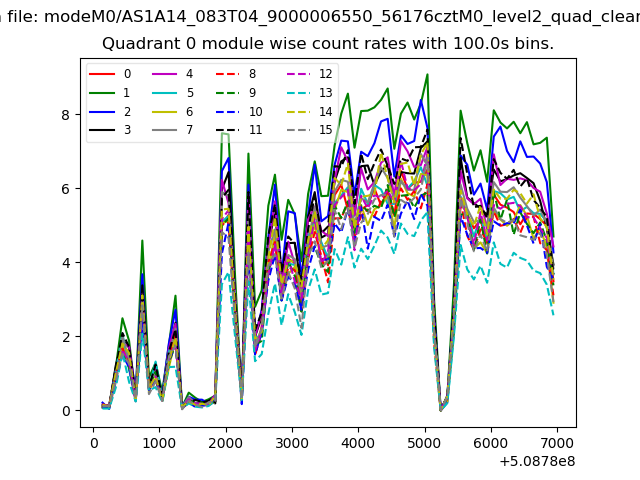 |
 |
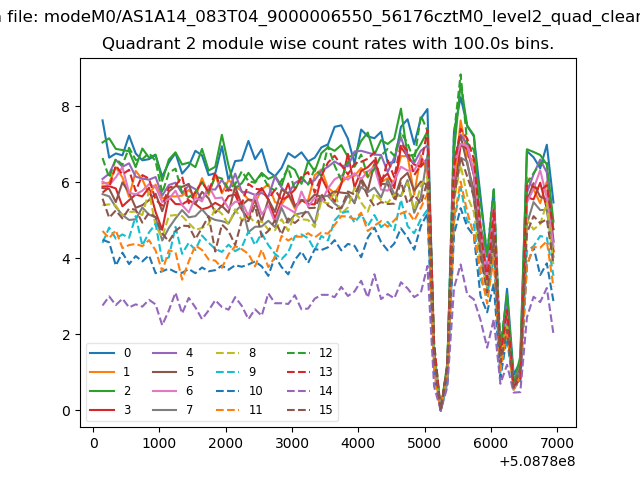
| Module-wise count rates for Quadrant B Data is divided into 100 sec bins |
 |
 |
| Module-wise count rates for Quadrant C Data is divided into 100 sec bins |
 |
 |
| Module-wise count rates for Quadrant D Data is divided into 100 sec bins |
 |
 |
| Parameter | Plot |
|---|---|
| CZT HV Monitor | 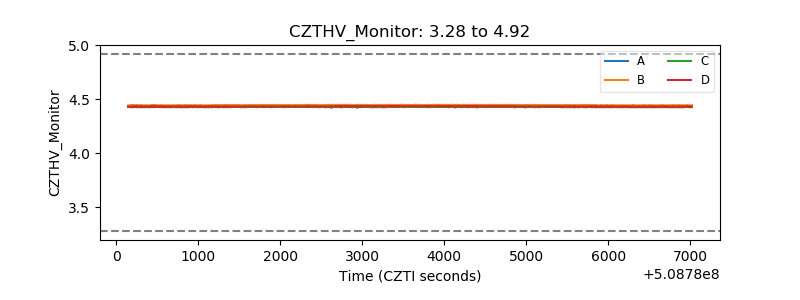 |
| D_VDD | 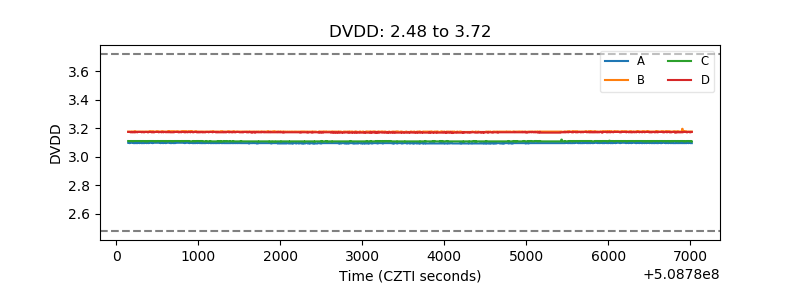 |
| Temperature 1 | 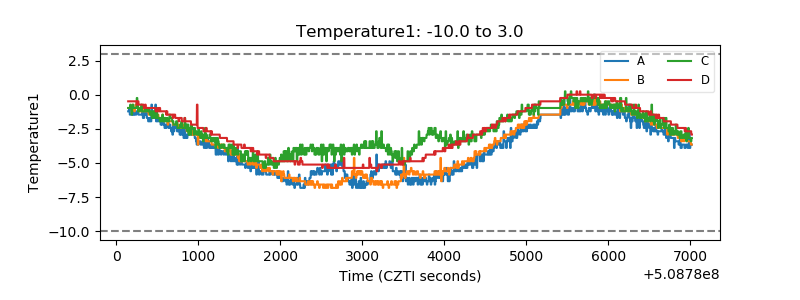 |
| Veto HV Monitor |  |
| Veto LLD | 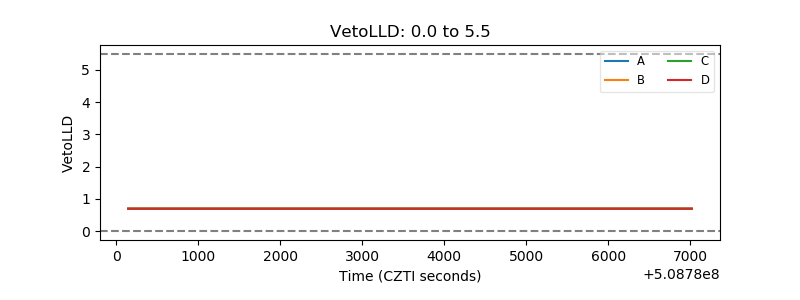 |
| Alpha Counter | 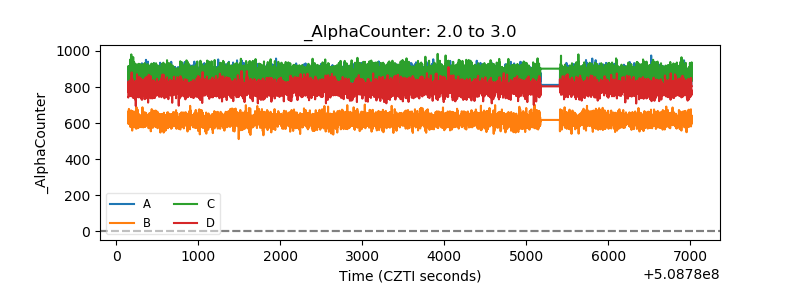 |
| _CPM_Rate | 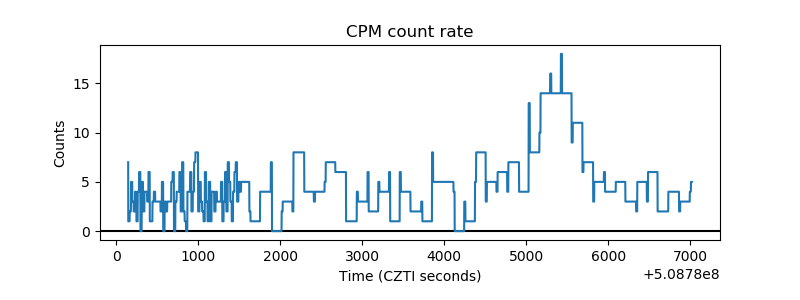 |
| CZT Counter | 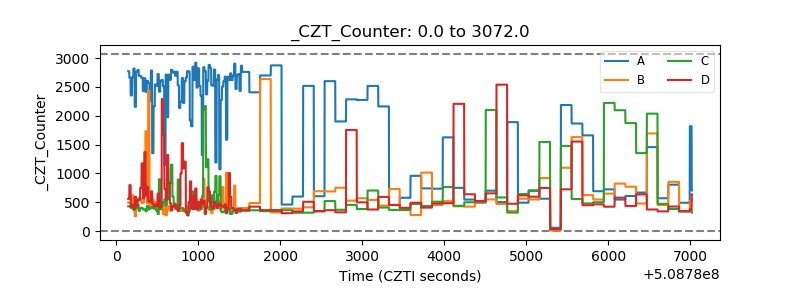 |
| +2.5 Volts monitor | 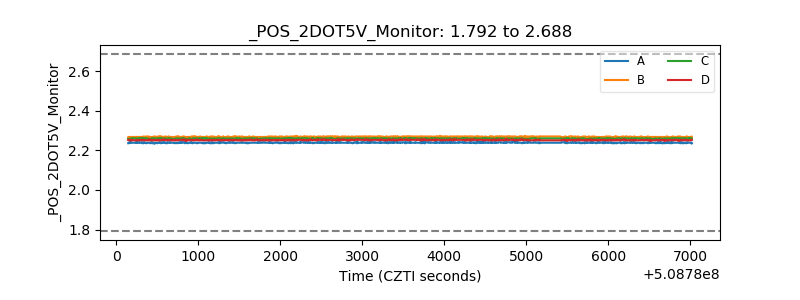 |
| +5 Volts monitor | 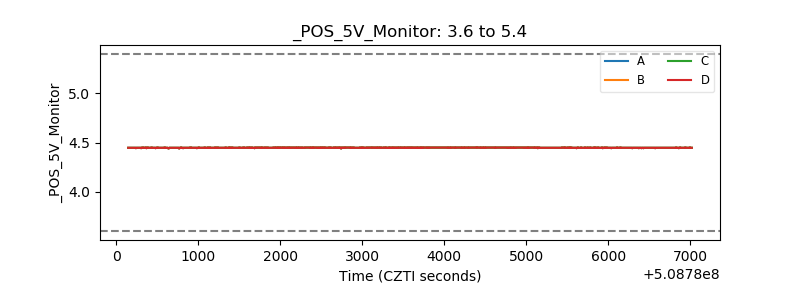 |
| _ROLL_ROT | 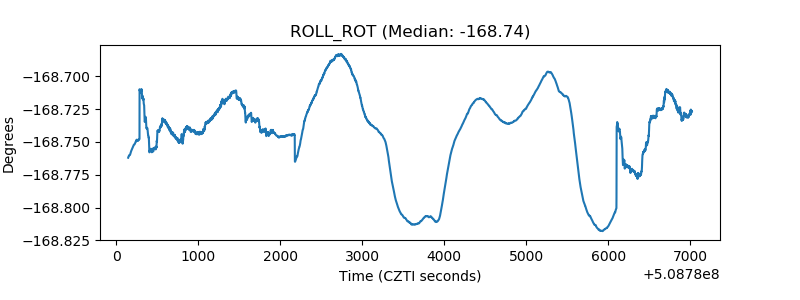 |
| _Roll_DEC | 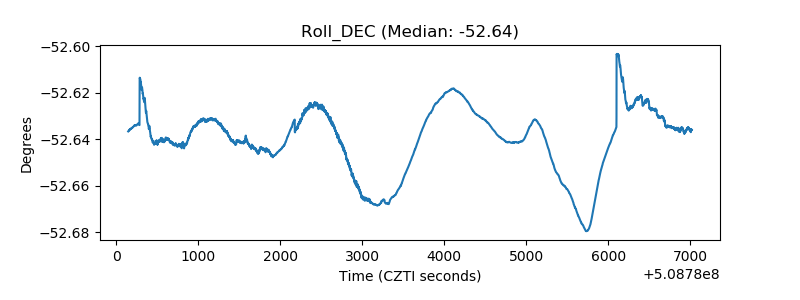 |
| _Roll_RA | 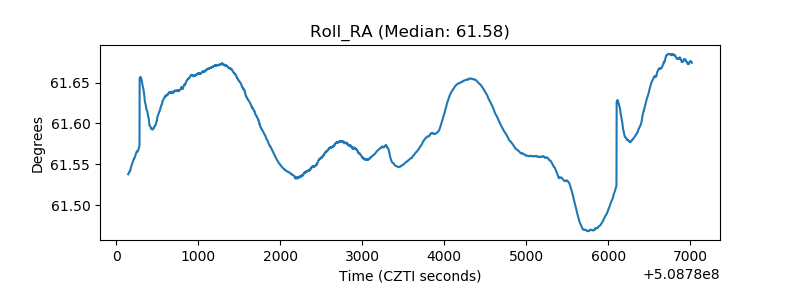 |
| Veto Counter | 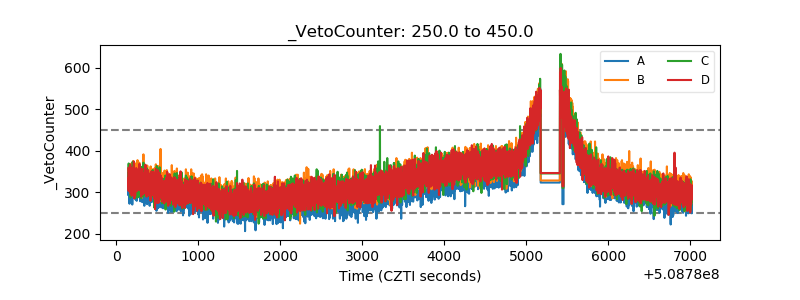 |