| Param | Original file | Final file |
|---|---|---|
| Filename | modeM0/AS1A14_083T04_9000006550_56177cztM0_level2.fits | modeM0/AS1A14_083T04_9000006550_56177cztM0_level2_quad_clean.evt |
| Size (bytes) | 690,909,120 | 103,749,120 |
| Size | 658.9 MB | 98.9 MB |
| Events in quadrant A | 7,535,699 | 623,096 |
| Events in quadrant B | 6,366,812 | 710,686 |
| Events in quadrant C | 6,836,110 | 618,289 |
| Events in quadrant D | 4,232,417 | 646,967 |
| Mode SS | |||
|---|---|---|---|
| Quadrant | BADHDUFLAG | Total packets | Discarded packets |
| A | 0 | 156 | 0 |
| B | 0 | 156 | 0 |
| C | 0 | 156 | 0 |
| D | 0 | 156 | 0 |
| Mode M0 | |||
|---|---|---|---|
| Quadrant | BADHDUFLAG | Total packets | Discarded packets |
| A | 0 | 27877 | 2 |
| B | 0 | 24227 | 0 |
| C | 0 | 26008 | 0 |
| D | 0 | 18250 | 0 |
| Quadrant | Total seconds | Saturated seconds | Saturation percentage |
|---|---|---|---|
| A | 7791 | 1342 | 17.225003% |
| B | 7791 | 852 | 10.935695% |
| C | 7792 | 1078 | 13.834702% |
| D | 7792 | 112 | 1.437372% |
Noise dominated data is calculated using 1-second bins in cleaned event files. If a bin has >2000 counts, and if more than 50% of those come from <1% of pixels, then it is considered to be noise-dominated and hence unusable.
| Quadrant | # 1 sec bins | Bins with >0 counts | Bins with >2000 counts | High rate bins dominated by noise | Noise dominated (total time) | Noise dominated (detector-on time) | Marked lightcurve |
|---|---|---|---|---|---|---|---|
| A | 7791 | 7791 | 954 | 954 | 12.24% | 12.24% |  |
| B | 7791 | 7791 | 543 | 543 | 6.97% | 6.97% | 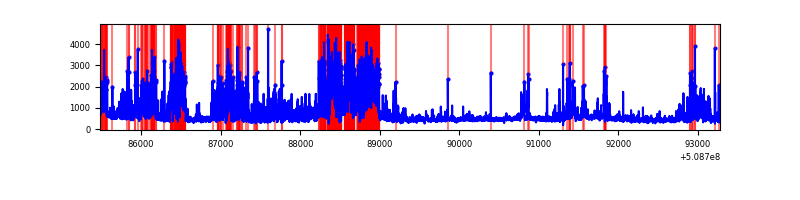 |
| C | 7792 | 7792 | 742 | 742 | 9.52% | 9.52% |  |
| D | 7792 | 7792 | 107 | 107 | 1.37% | 1.37% |  |
Top three noisy pixels from each quadrant. If the there are fewer than three noisy pixels in the level2.evt file, extra rows are filled as -1
| Pixel properties | Quadrant properties | ||||||
|---|---|---|---|---|---|---|---|
| Quadrant | DetID | PixID | Counts | Sigma | Mean | Median | Sigma |
| A | 15 | 32 | 1430067 | 7598.41 | 758 | 740 | 188.1 |
| A | 7 | 64 | 1022304 | 5430.71 | 758 | 740 | 188.1 |
| A | 0 | 212 | 627826 | 3333.64 | 758 | 740 | 188.1 |
| B | 4 | 171 | 1246536 | 7530.47 | 786 | 761 | 165.4 |
| B | 5 | 236 | 1145356 | 6918.85 | 786 | 761 | 165.4 |
| B | 10 | 247 | 309130 | 1864.03 | 786 | 761 | 165.4 |
| C | 12 | 254 | 2901315 | 14207.8 | 746 | 740 | 204.2 |
| C | 1 | 12 | 828475 | 4054.47 | 746 | 740 | 204.2 |
| C | 12 | 252 | 46533 | 224.3 | 746 | 740 | 204.2 |
| D | 2 | 249 | 425616 | 1910.95 | 784 | 749 | 222.3 |
| D | 11 | 129 | 142993 | 639.78 | 784 | 749 | 222.3 |
| D | 2 | 62 | 77661 | 345.93 | 784 | 749 | 222.3 |
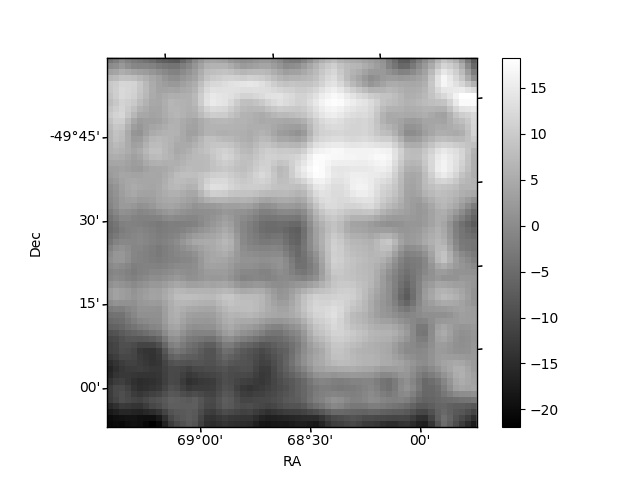
Histogram calculated using DETX and DETY for each event in the final _common_clean file
| Quadrant A | 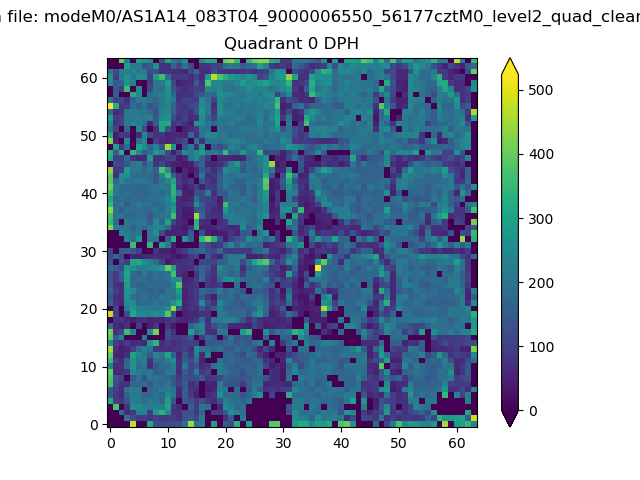 |
 |
Quadrant B |
|---|---|---|---|
| Quadrant D |  |
 |
Quadrant C |
| Plot type | Count rate plots | Images |
|---|---|---|
| Comparison with Poisson distribution Blue bars denote a histogram of data divided into 1 sec bins. Red curve is a Poisson curve with rate = median count rate of data. |
 |
 |
| Quadrant-wise count rates Data is divided into 100 sec bins |
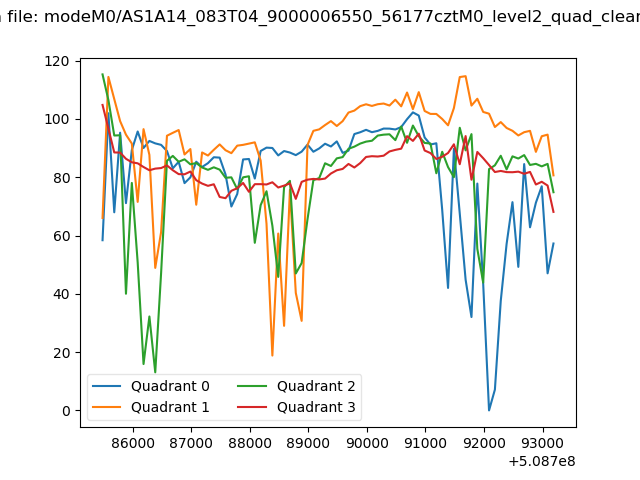 |
|
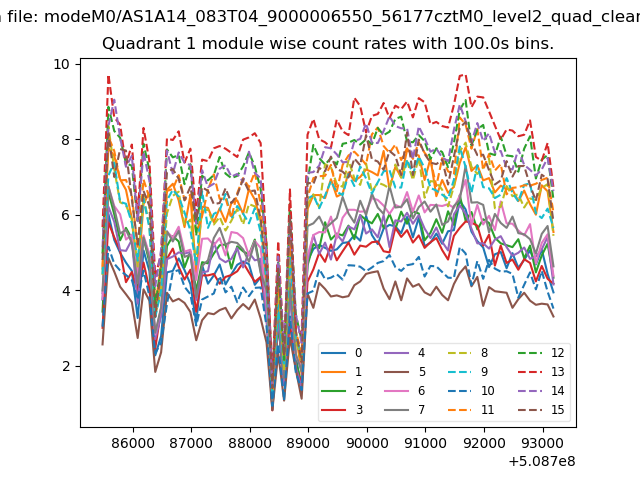
| Module-wise count rates for Quadrant A Data is divided into 100 sec bins |
 |
 |
| Module-wise count rates for Quadrant B Data is divided into 100 sec bins |
 |
 |
| Module-wise count rates for Quadrant C Data is divided into 100 sec bins |
 |
 |
| Module-wise count rates for Quadrant D Data is divided into 100 sec bins |
 |
 |
| Parameter | Plot |
|---|---|
| CZT HV Monitor | 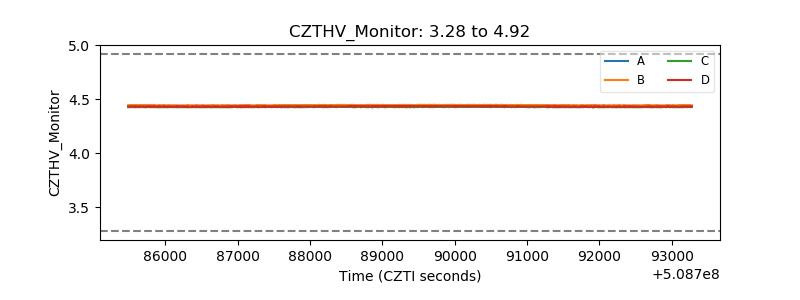 |
| D_VDD |  |
| Temperature 1 | 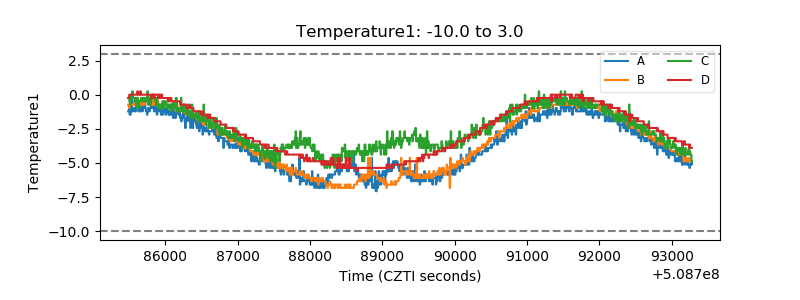 |
| Veto HV Monitor |  |
| Veto LLD |  |
| Alpha Counter |  |
| _CPM_Rate |  |
| CZT Counter | 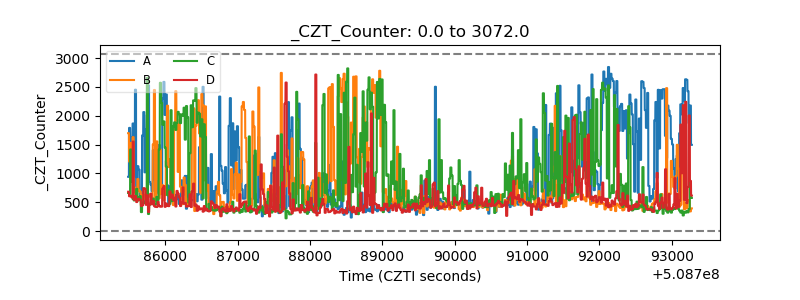 |
| +2.5 Volts monitor |  |
| +5 Volts monitor |  |
| _ROLL_ROT |  |
| _Roll_DEC |  |
| _Roll_RA | 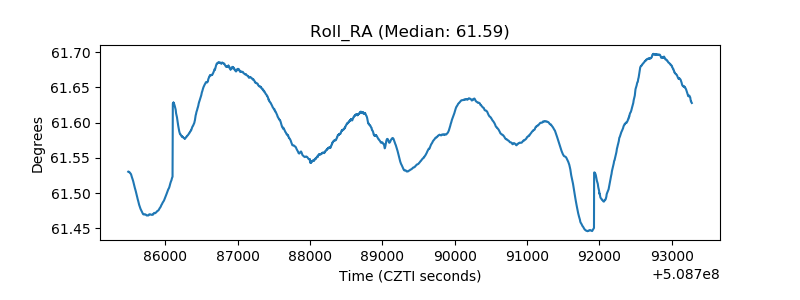 |
| Veto Counter |  |