| Param | Original file | Final file |
|---|---|---|
| Filename | modeM0/AS1A14_083T04_9000006550_56178cztM0_level2.fits | modeM0/AS1A14_083T04_9000006550_56178cztM0_level2_quad_clean.evt |
| Size (bytes) | 798,975,360 | 88,588,800 |
| Size | 762.0 MB | 84.5 MB |
| Events in quadrant A | 13,264,011 | 373,918 |
| Events in quadrant B | 4,839,448 | 676,706 |
| Events in quadrant C | 6,001,376 | 549,331 |
| Events in quadrant D | 4,847,072 | 522,170 |
| Mode SS | |||
|---|---|---|---|
| Quadrant | BADHDUFLAG | Total packets | Discarded packets |
| A | 0 | 162 | 0 |
| B | 0 | 162 | 0 |
| C | 0 | 162 | 0 |
| D | 0 | 162 | 0 |
| Mode M0 | |||
|---|---|---|---|
| Quadrant | BADHDUFLAG | Total packets | Discarded packets |
| A | 0 | 44902 | 0 |
| B | 0 | 19936 | 0 |
| C | 0 | 23970 | 0 |
| D | 0 | 20143 | 0 |
| Quadrant | Total seconds | Saturated seconds | Saturation percentage |
|---|---|---|---|
| A | 8045 | 3694 | 45.916718% |
| B | 8044 | 234 | 2.909000% |
| C | 8045 | 914 | 11.361094% |
| D | 8045 | 234 | 2.908639% |
Noise dominated data is calculated using 1-second bins in cleaned event files. If a bin has >2000 counts, and if more than 50% of those come from <1% of pixels, then it is considered to be noise-dominated and hence unusable.
| Quadrant | # 1 sec bins | Bins with >0 counts | Bins with >2000 counts | High rate bins dominated by noise | Noise dominated (total time) | Noise dominated (detector-on time) | Marked lightcurve |
|---|---|---|---|---|---|---|---|
| A | 8323 | 8255 | 2818 | 2818 | 33.86% | 34.14% | 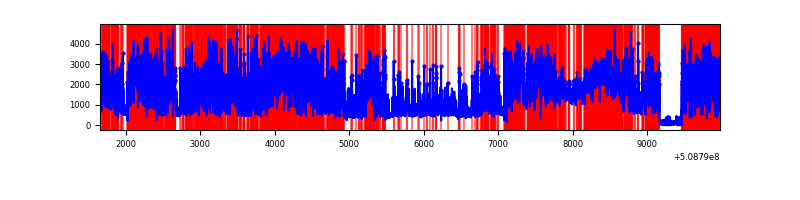 |
| B | 8322 | 8322 | 124 | 124 | 1.49% | 1.49% | 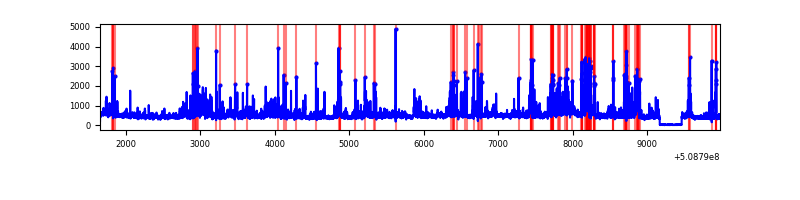 |
| C | 8323 | 8323 | 623 | 623 | 7.49% | 7.49% | 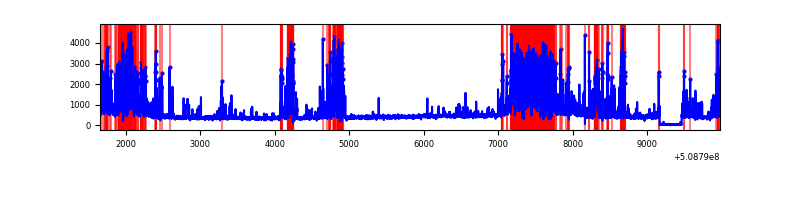 |
| D | 8323 | 8323 | 175 | 175 | 2.10% | 2.10% | 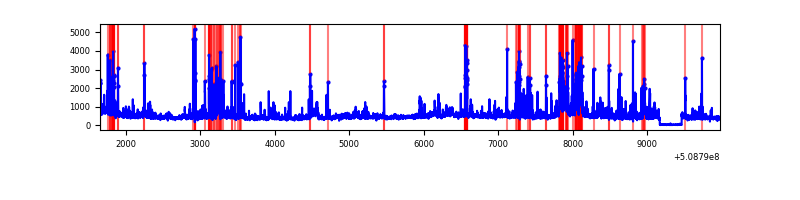 |
Top three noisy pixels from each quadrant. If the there are fewer than three noisy pixels in the level2.evt file, extra rows are filled as -1
| Pixel properties | Quadrant properties | ||||||
|---|---|---|---|---|---|---|---|
| Quadrant | DetID | PixID | Counts | Sigma | Mean | Median | Sigma |
| A | 0 | 212 | 4158495 | 24193.0 | 682 | 664 | 171.9 |
| A | 15 | 32 | 2246687 | 13068.84 | 682 | 664 | 171.9 |
| A | 3 | 78 | 2184339 | 12706.06 | 682 | 664 | 171.9 |
| B | 4 | 171 | 473216 | 2683.37 | 831 | 805 | 176.1 |
| B | 5 | 172 | 341664 | 1936.14 | 831 | 805 | 176.1 |
| B | 10 | 247 | 278393 | 1576.75 | 831 | 805 | 176.1 |
| C | 12 | 254 | 2598397 | 12236.34 | 769 | 760 | 212.3 |
| C | 12 | 252 | 148729 | 697.02 | 769 | 760 | 212.3 |
| C | 1 | 12 | 63725 | 296.6 | 769 | 760 | 212.3 |
| D | 2 | 249 | 319319 | 1400.64 | 799 | 761 | 227.4 |
| D | 8 | 129 | 299167 | 1312.04 | 799 | 761 | 227.4 |
| D | 8 | 240 | 201932 | 884.51 | 799 | 761 | 227.4 |
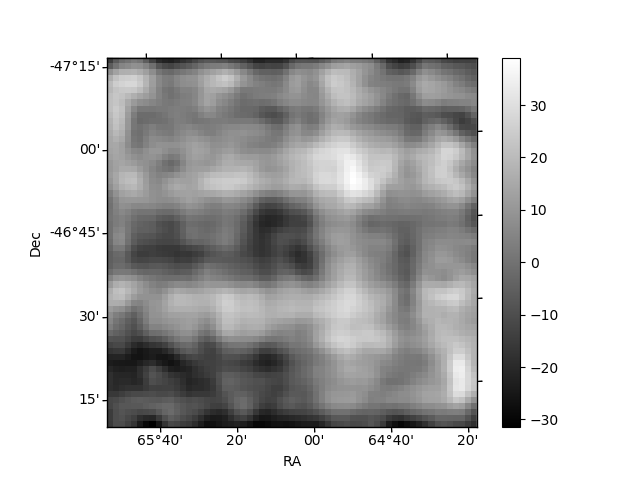
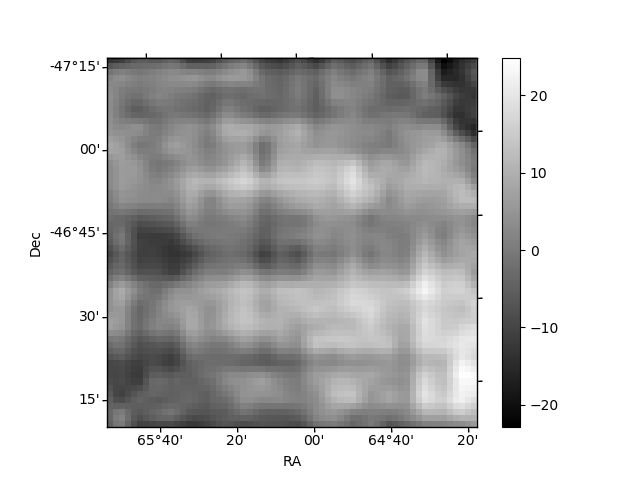
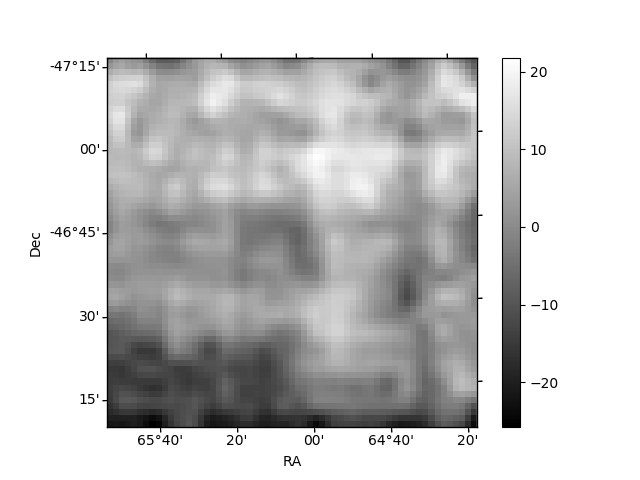
Histogram calculated using DETX and DETY for each event in the final _common_clean file
| Quadrant A | 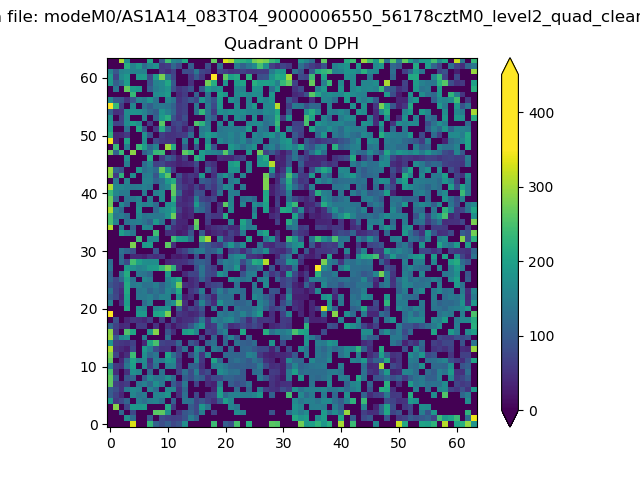 |
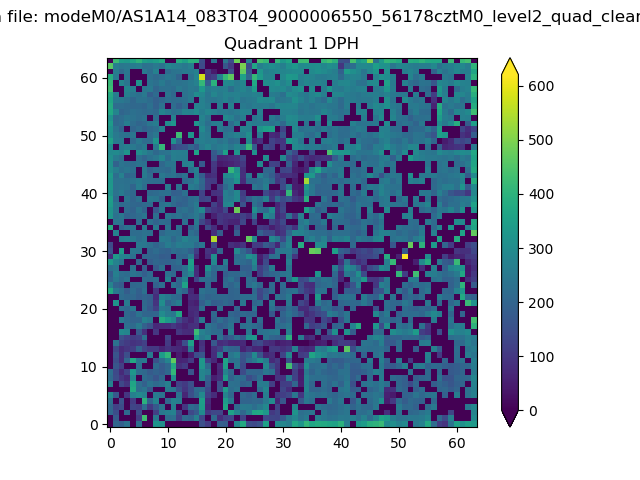 |
Quadrant B |
|---|---|---|---|
| Quadrant D | 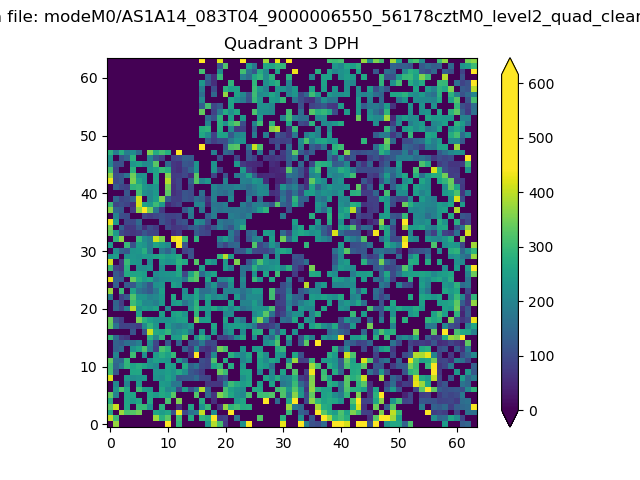 |
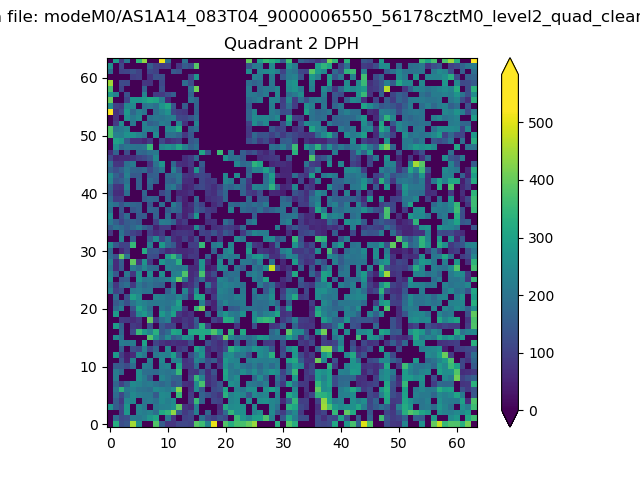 |
Quadrant C |
| Plot type | Count rate plots | Images |
|---|---|---|
| Comparison with Poisson distribution Blue bars denote a histogram of data divided into 1 sec bins. Red curve is a Poisson curve with rate = median count rate of data. |
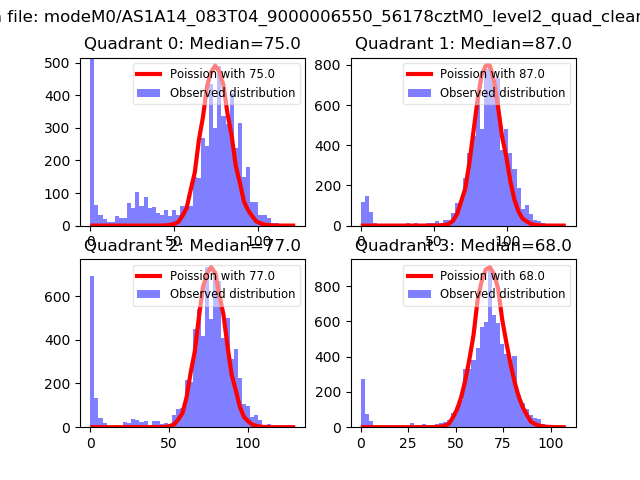 |
 |
| Quadrant-wise count rates Data is divided into 100 sec bins |
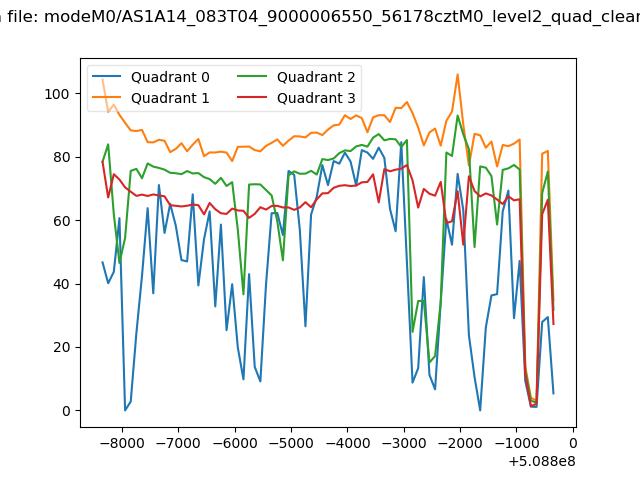 |
|
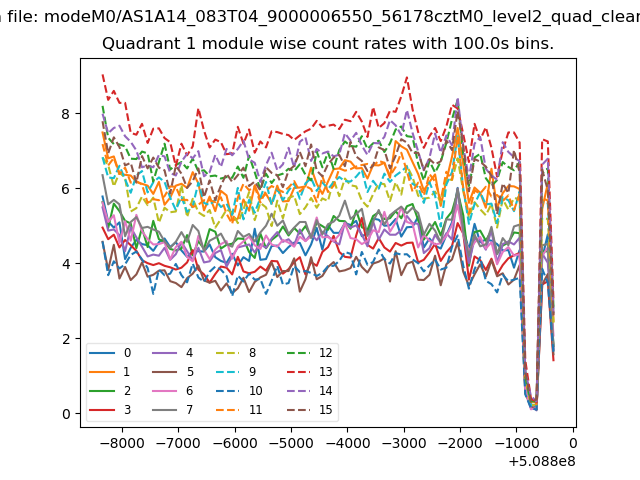
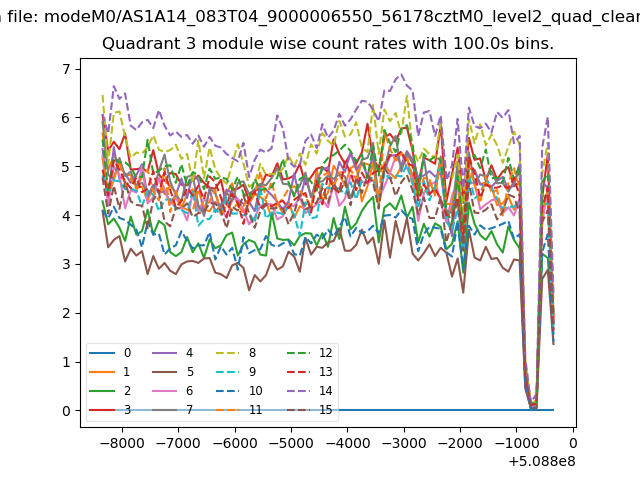
| Module-wise count rates for Quadrant A Data is divided into 100 sec bins |
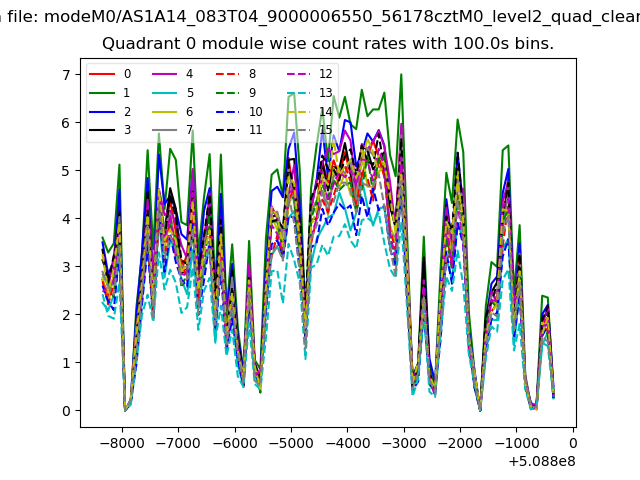 |
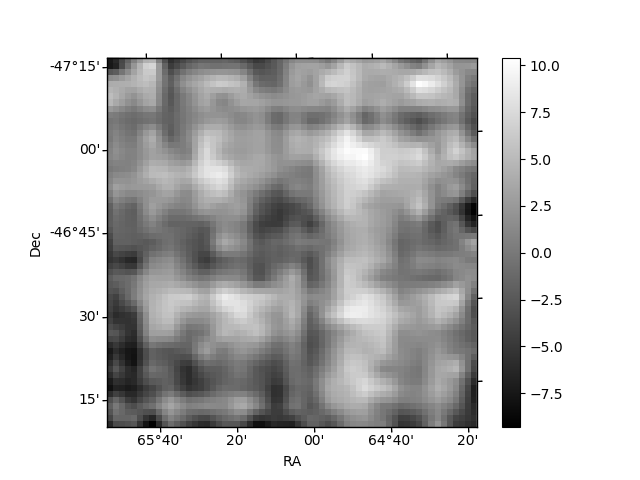 |
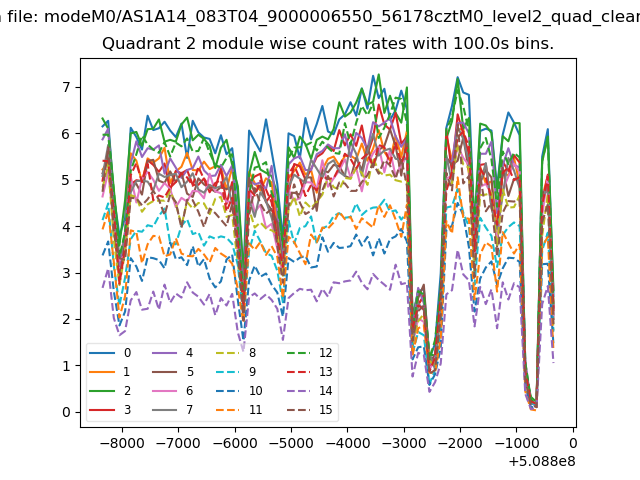
| Module-wise count rates for Quadrant B Data is divided into 100 sec bins |
 |
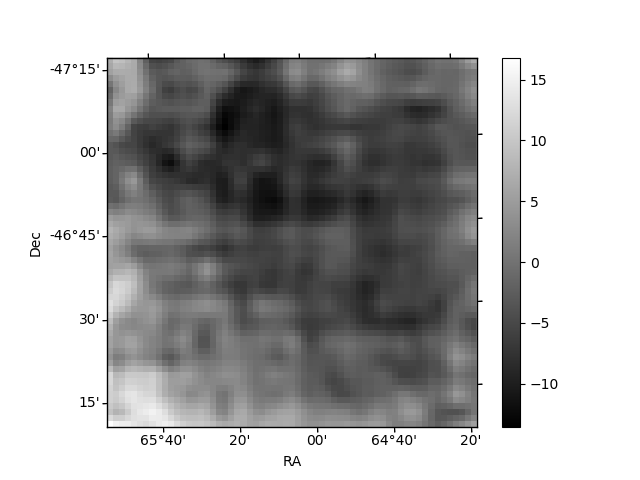 |
| Module-wise count rates for Quadrant C Data is divided into 100 sec bins |
 |
 |
| Module-wise count rates for Quadrant D Data is divided into 100 sec bins |
 |
 |
| Parameter | Plot |
|---|---|
| CZT HV Monitor | 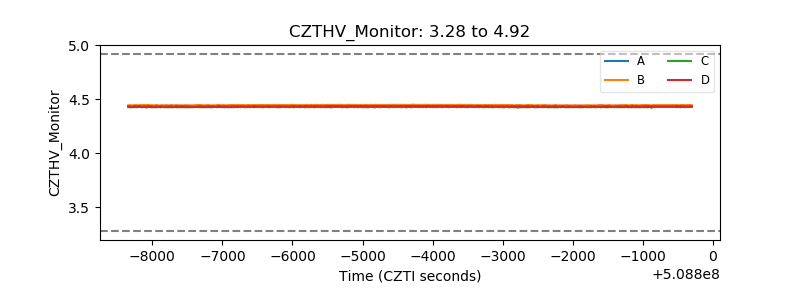 |
| D_VDD | 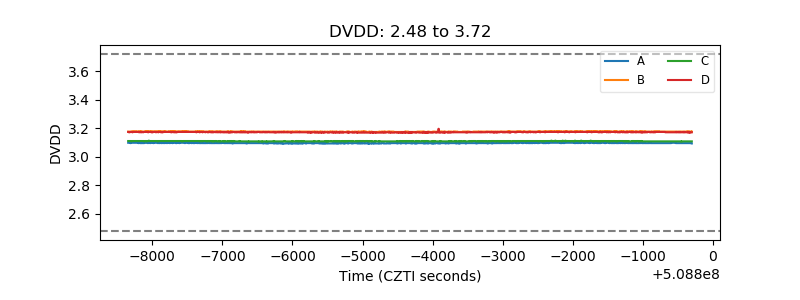 |
| Temperature 1 | 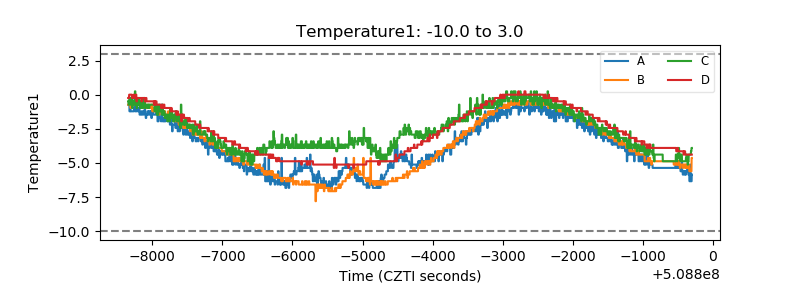 |
| Veto HV Monitor |  |
| Veto LLD | 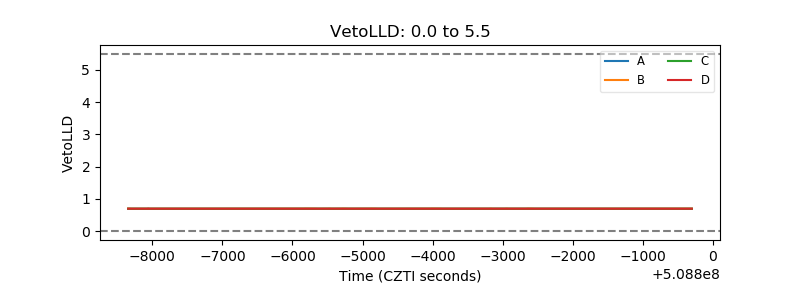 |
| Alpha Counter | 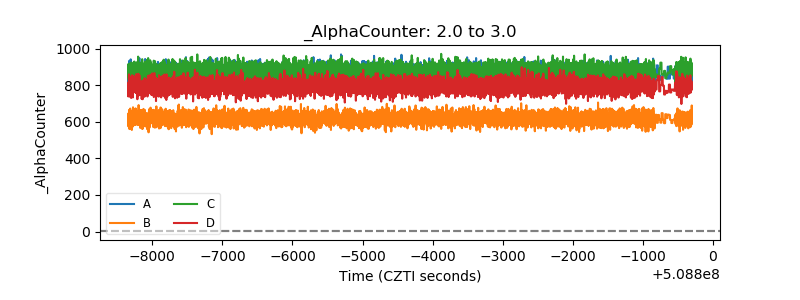 |
| _CPM_Rate | 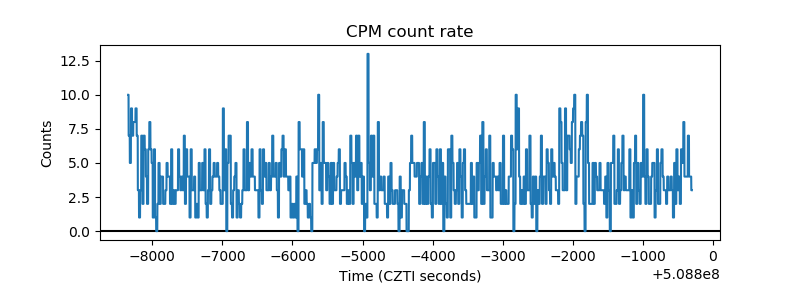 |
| CZT Counter | 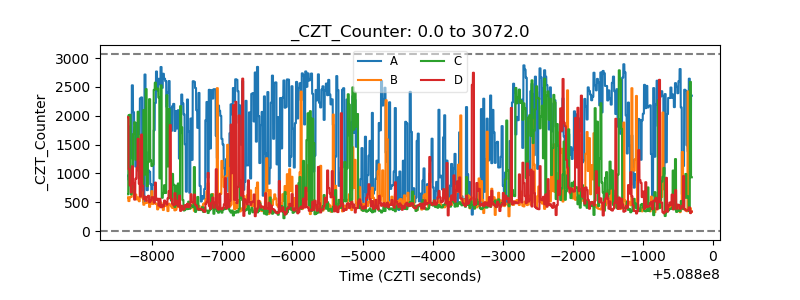 |
| +2.5 Volts monitor |  |
| +5 Volts monitor |  |
| _ROLL_ROT | 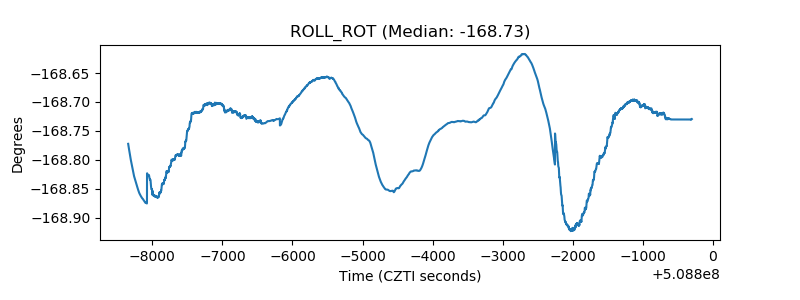 |
| _Roll_DEC | 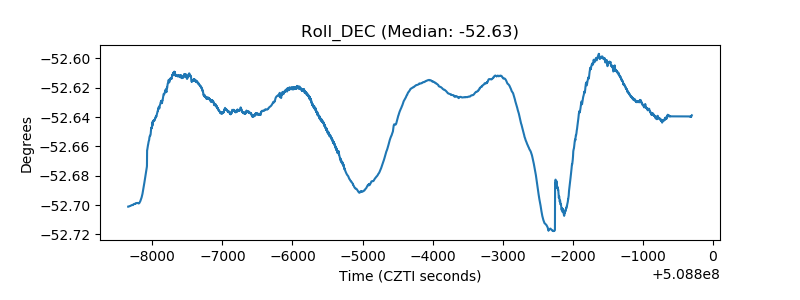 |
| _Roll_RA | 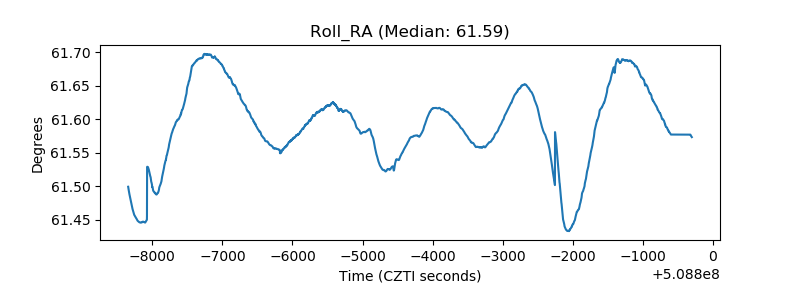 |
| Veto Counter | 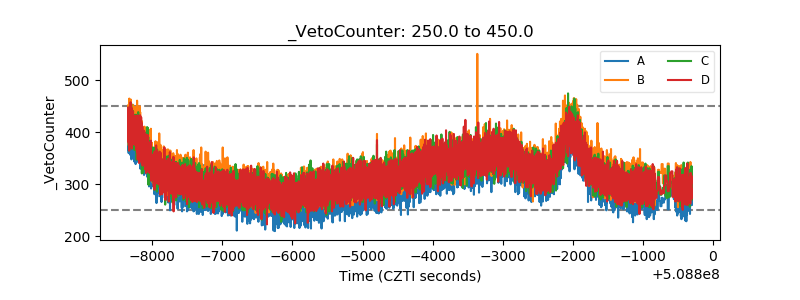 |