| Param | Original file | Final file |
|---|---|---|
| Filename | modeM0/AS1A14_083T04_9000006550_56182cztM0_level2.fits | modeM0/AS1A14_083T04_9000006550_56182cztM0_level2_quad_clean.evt |
| Size (bytes) | 612,086,400 | 97,041,600 |
| Size | 583.7 MB | 92.5 MB |
| Events in quadrant A | 11,047,917 | 463,848 |
| Events in quadrant B | 3,593,462 | 723,529 |
| Events in quadrant C | 3,921,163 | 638,776 |
| Events in quadrant D | 3,528,571 | 604,293 |
| Mode SS | |||
|---|---|---|---|
| Quadrant | BADHDUFLAG | Total packets | Discarded packets |
| A | 0 | 150 | 0 |
| B | 0 | 150 | 0 |
| C | 0 | 150 | 0 |
| D | 0 | 150 | 0 |
| Mode M9 | |||
|---|---|---|---|
| Quadrant | BADHDUFLAG | Total packets | Discarded packets |
| A | 0 | 13 | 0 |
| B | 0 | 13 | 0 |
| C | 0 | 13 | 0 |
| D | 0 | 13 | 0 |
| Mode M0 | |||
|---|---|---|---|
| Quadrant | BADHDUFLAG | Total packets | Discarded packets |
| A | 0 | 37866 | 2 |
| B | 0 | 15968 | 2 |
| C | 0 | 17164 | 2 |
| D | 0 | 15909 | 2 |
| Quadrant | Total seconds | Saturated seconds | Saturation percentage |
|---|---|---|---|
| A | 7288 | 2684 | 36.827662% |
| B | 7288 | 214 | 2.936334% |
| C | 7289 | 248 | 3.402387% |
| D | 7289 | 126 | 1.728632% |
Noise dominated data is calculated using 1-second bins in cleaned event files. If a bin has >2000 counts, and if more than 50% of those come from <1% of pixels, then it is considered to be noise-dominated and hence unusable.
| Quadrant | # 1 sec bins | Bins with >0 counts | Bins with >2000 counts | High rate bins dominated by noise | Noise dominated (total time) | Noise dominated (detector-on time) | Marked lightcurve |
|---|---|---|---|---|---|---|---|
| A | 8643 | 7290 | 2056 | 2056 | 23.79% | 28.20% | 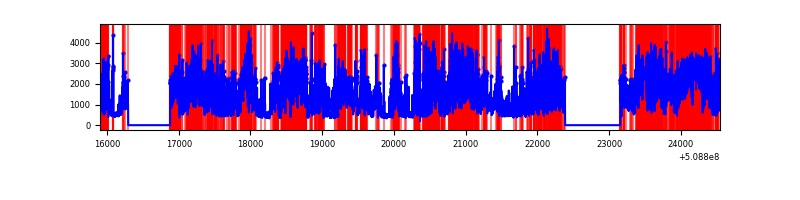 |
| B | 8643 | 7290 | 14 | 14 | 0.16% | 0.19% | 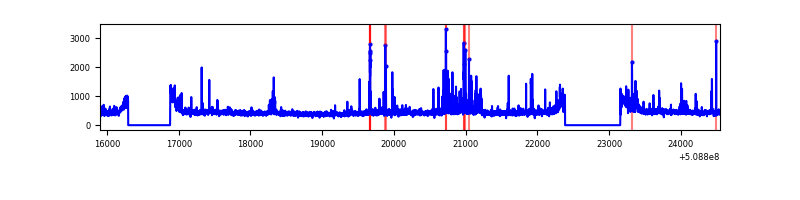 |
| C | 8644 | 7291 | 95 | 95 | 1.10% | 1.30% | 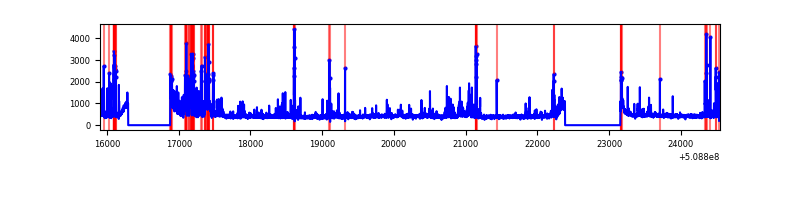 |
| D | 8644 | 7291 | 7 | 7 | 0.08% | 0.10% | 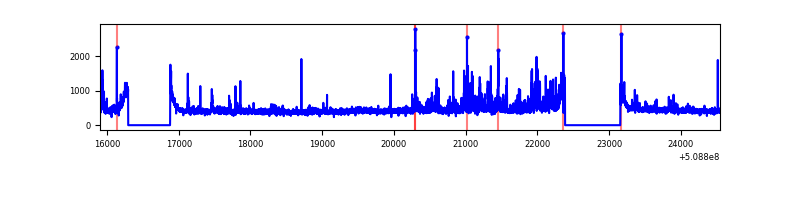 |
Top three noisy pixels from each quadrant. If the there are fewer than three noisy pixels in the level2.evt file, extra rows are filled as -1
| Pixel properties | Quadrant properties | ||||||
|---|---|---|---|---|---|---|---|
| Quadrant | DetID | PixID | Counts | Sigma | Mean | Median | Sigma |
| A | 0 | 212 | 3565658 | 21151.16 | 675 | 655 | 168.5 |
| A | 15 | 32 | 2840229 | 16847.19 | 675 | 655 | 168.5 |
| A | 7 | 64 | 803782 | 4764.95 | 675 | 655 | 168.5 |
| B | 10 | 247 | 158168 | 931.6 | 788 | 758 | 169.0 |
| B | 4 | 171 | 101151 | 594.16 | 788 | 758 | 169.0 |
| B | 5 | 172 | 52489 | 306.16 | 788 | 758 | 169.0 |
| C | 12 | 252 | 486744 | 2339.07 | 771 | 762 | 207.8 |
| C | 6 | 223 | 226656 | 1087.25 | 771 | 762 | 207.8 |
| C | 12 | 254 | 100426 | 479.69 | 771 | 762 | 207.8 |
| D | 2 | 249 | 170196 | 783.27 | 771 | 737 | 216.3 |
| D | 11 | 129 | 70483 | 322.38 | 771 | 737 | 216.3 |
| D | 5 | 173 | 64134 | 293.03 | 771 | 737 | 216.3 |
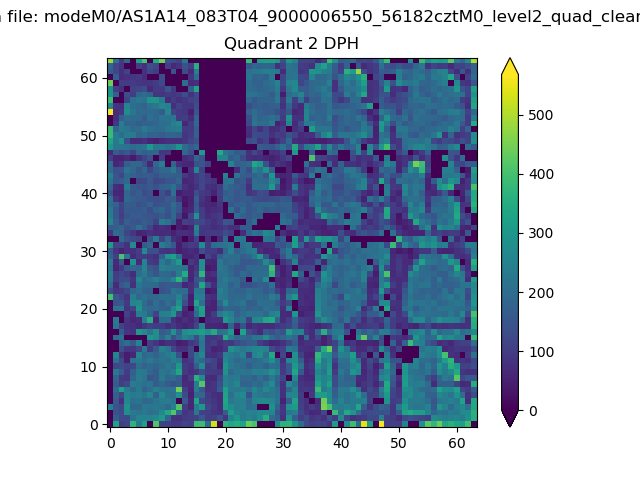
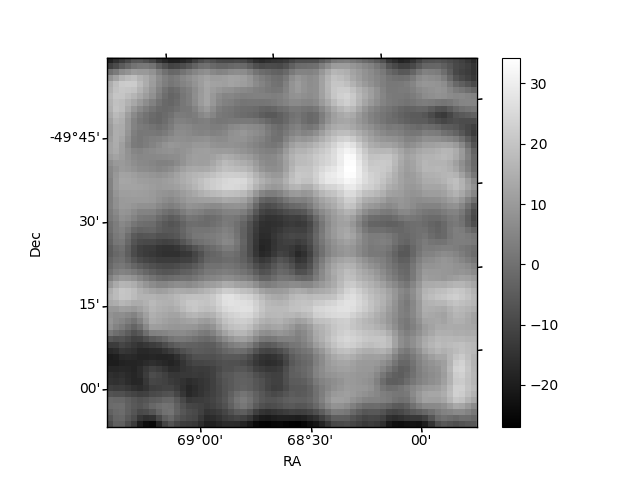
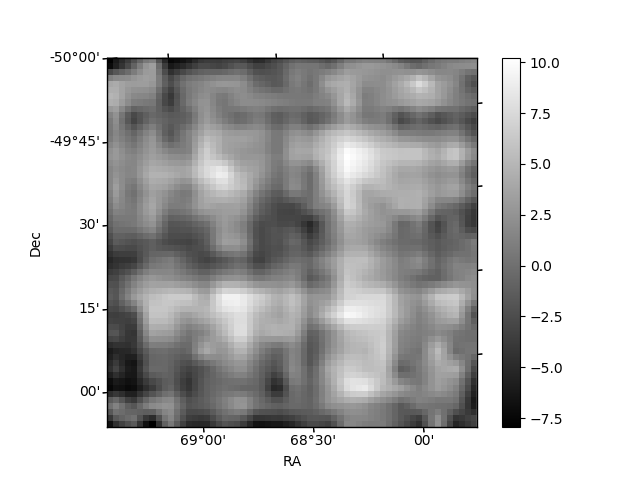
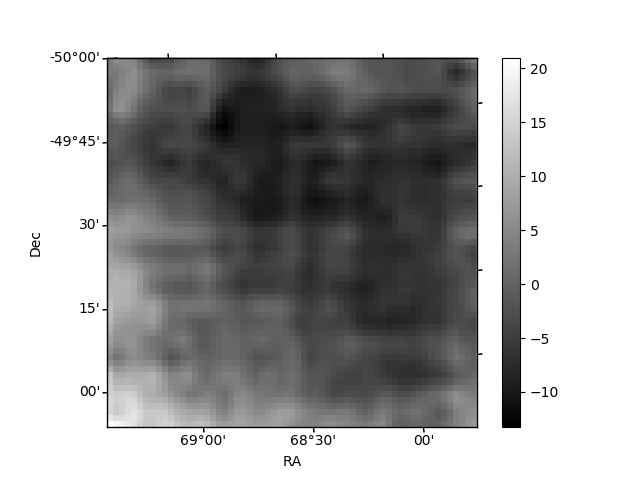
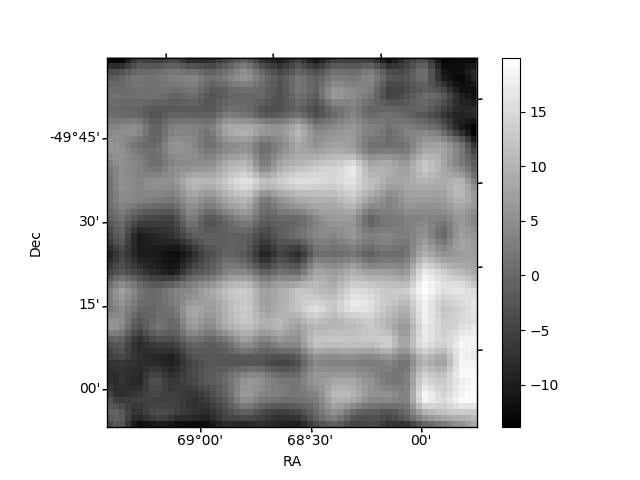
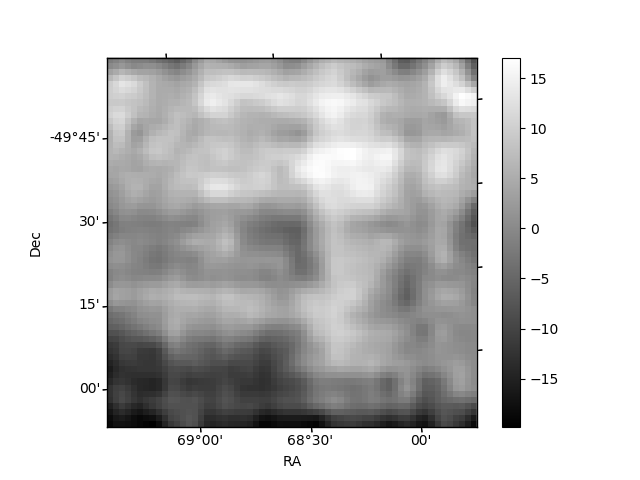
Histogram calculated using DETX and DETY for each event in the final _common_clean file
| Quadrant A | 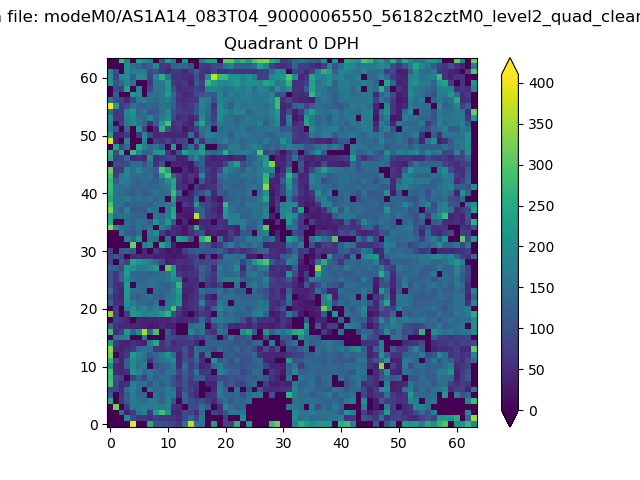 |
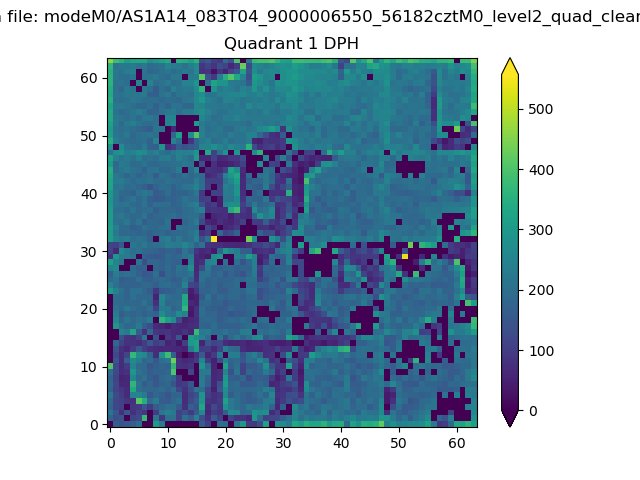 |
Quadrant B |
|---|---|---|---|
| Quadrant D | 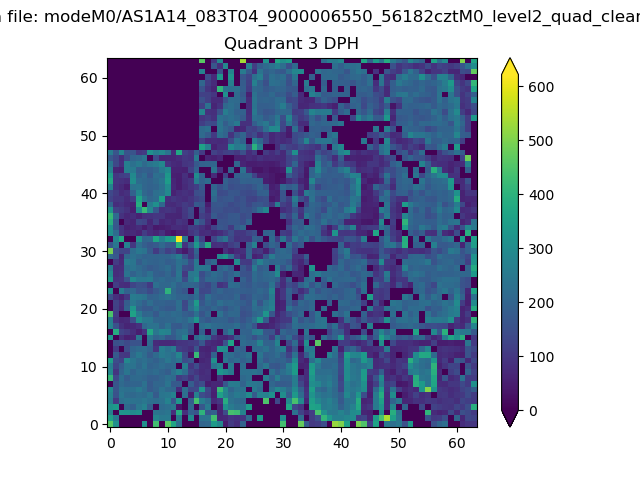 |
 |
Quadrant C |
| Plot type | Count rate plots | Images |
|---|---|---|
| Comparison with Poisson distribution Blue bars denote a histogram of data divided into 1 sec bins. Red curve is a Poisson curve with rate = median count rate of data. |
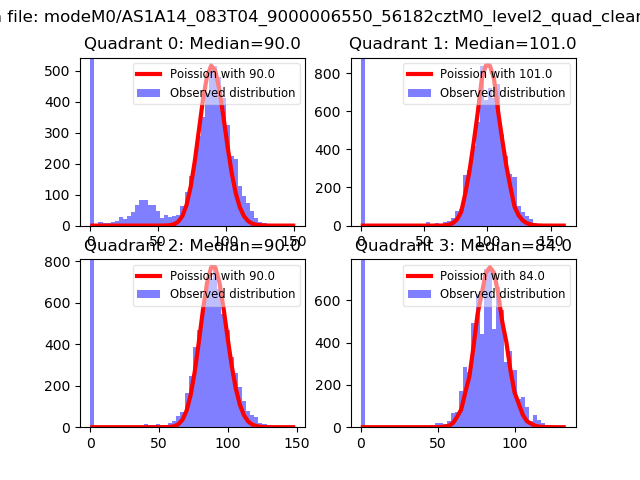 |
 |
| Quadrant-wise count rates Data is divided into 100 sec bins |
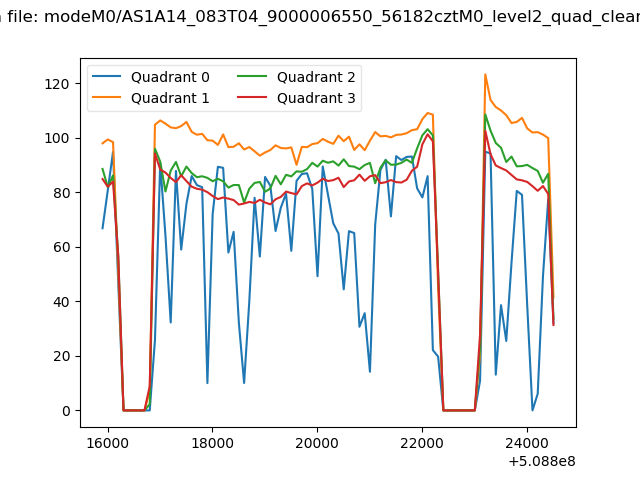 |
|
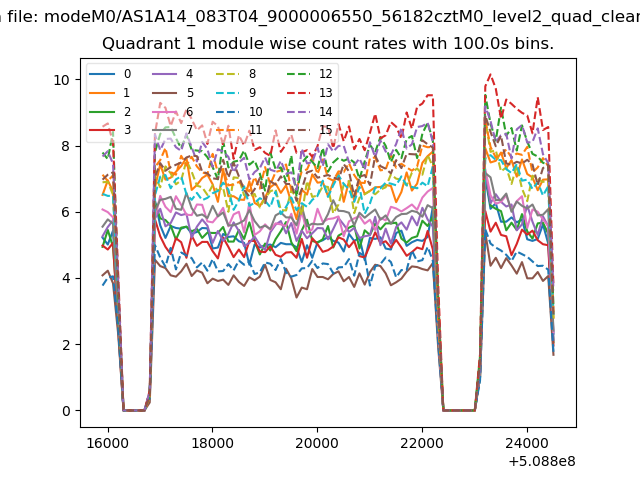
| Module-wise count rates for Quadrant A Data is divided into 100 sec bins |
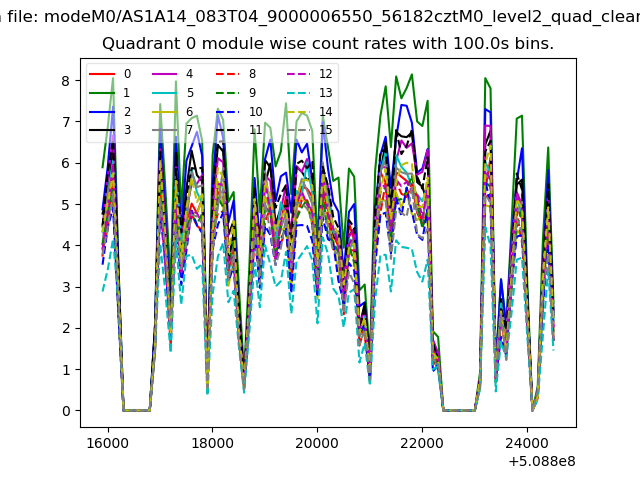 |
 |
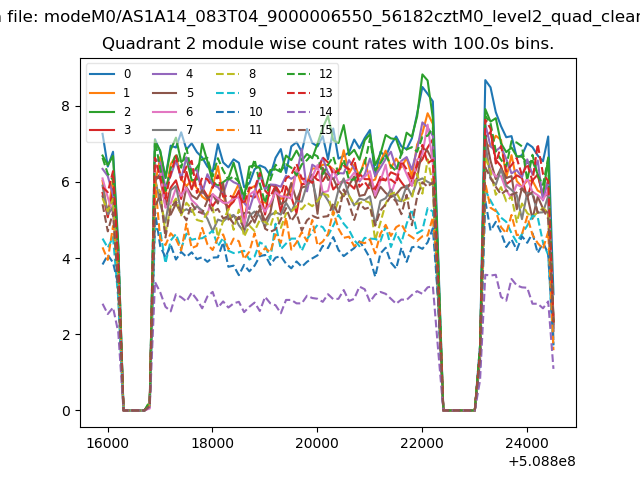
| Module-wise count rates for Quadrant B Data is divided into 100 sec bins |
 |
 |
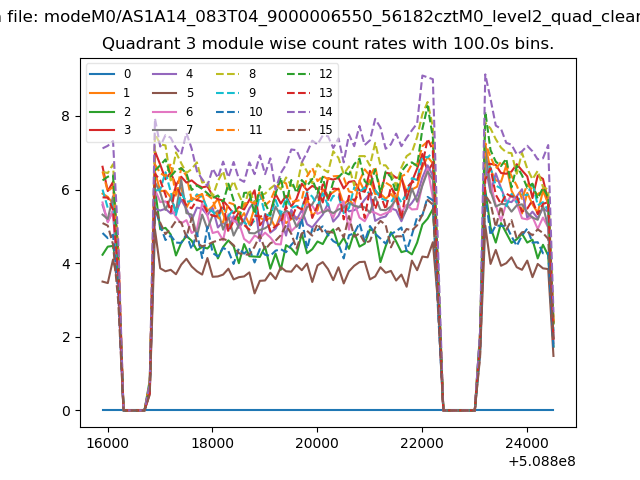
| Module-wise count rates for Quadrant C Data is divided into 100 sec bins |
 |
 |
| Module-wise count rates for Quadrant D Data is divided into 100 sec bins |
 |
 |
| Parameter | Plot |
|---|---|
| CZT HV Monitor | 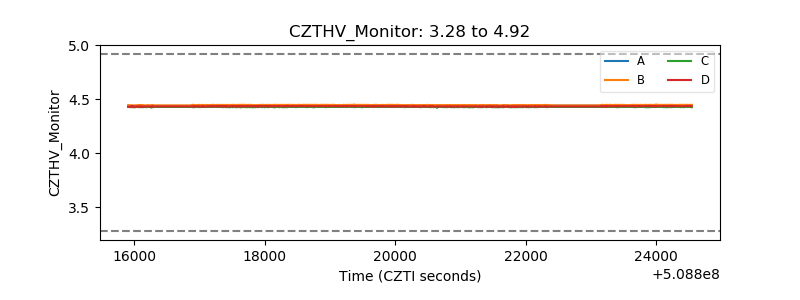 |
| D_VDD | 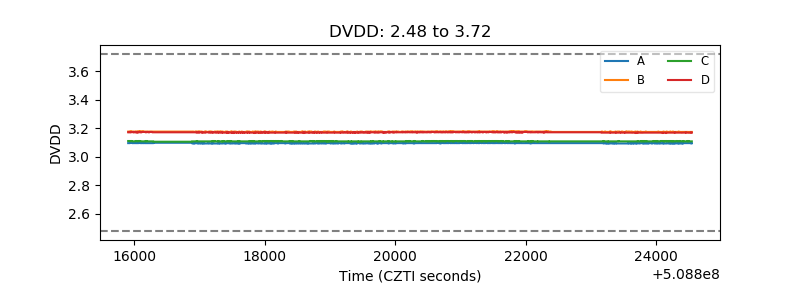 |
| Temperature 1 | 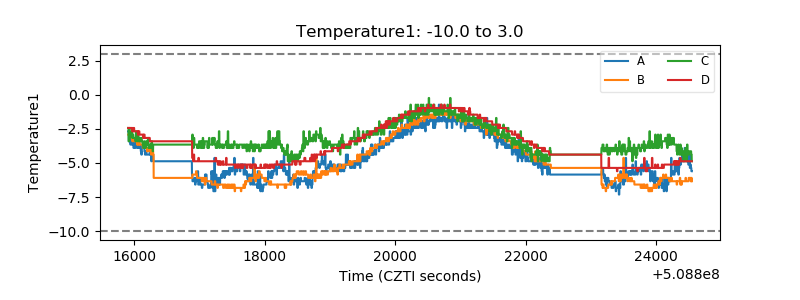 |
| Veto HV Monitor | 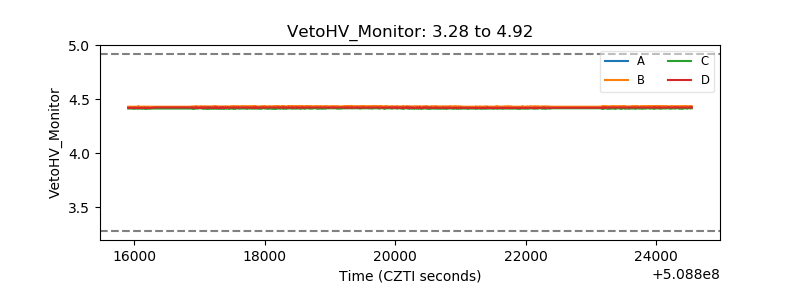 |
| Veto LLD | 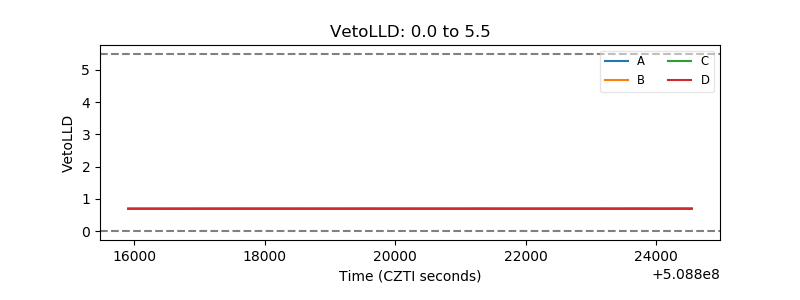 |
| Alpha Counter | 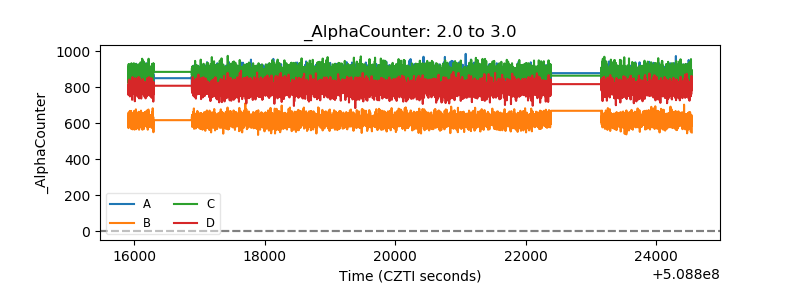 |
| _CPM_Rate | 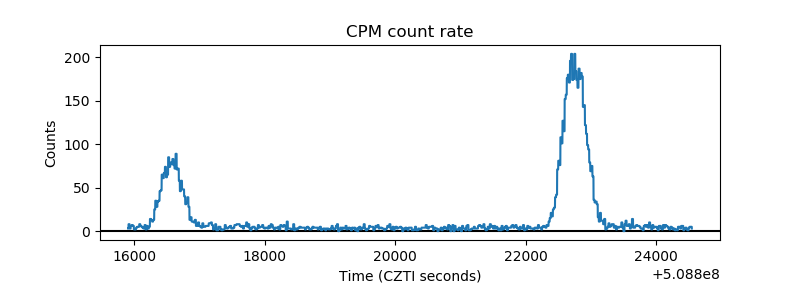 |
| CZT Counter | 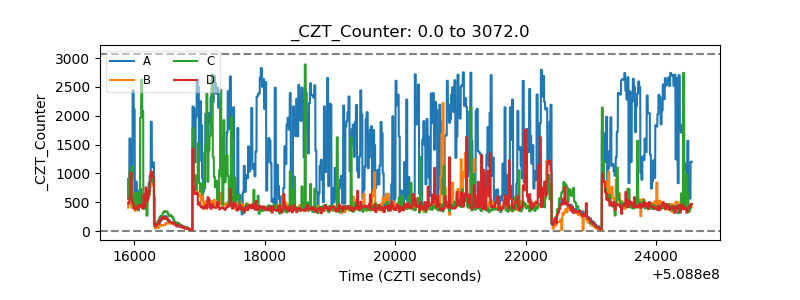 |
| +2.5 Volts monitor | 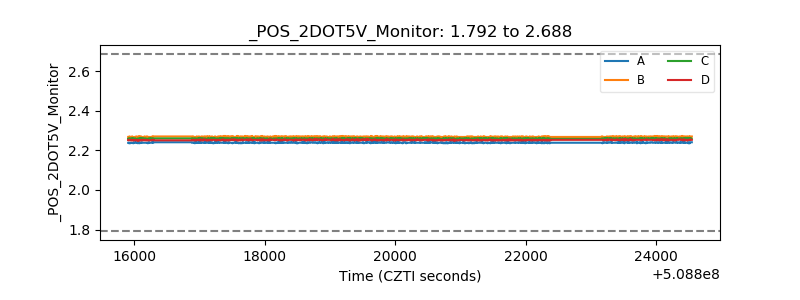 |
| +5 Volts monitor | 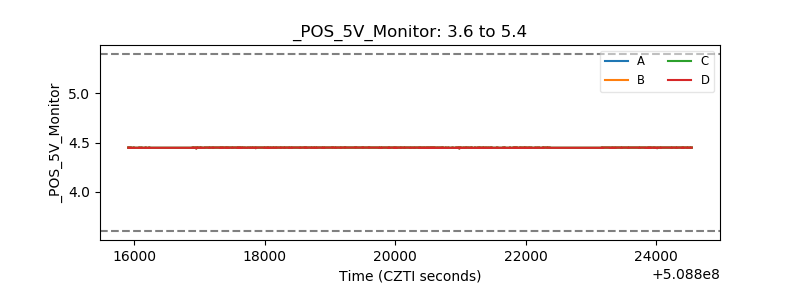 |
| _ROLL_ROT | 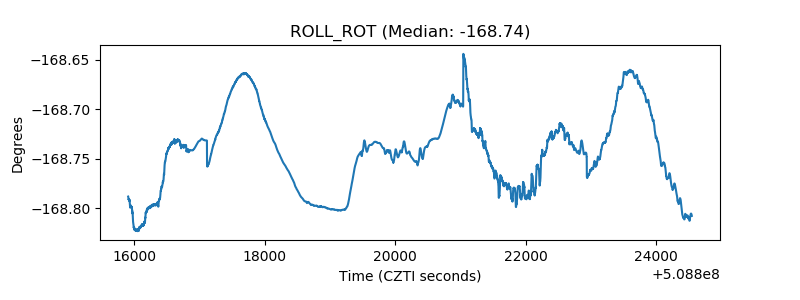 |
| _Roll_DEC | 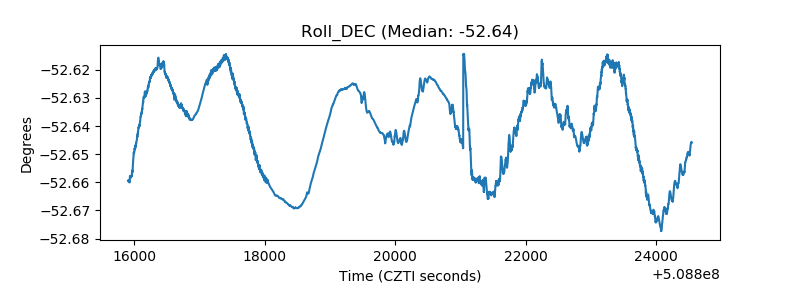 |
| _Roll_RA | 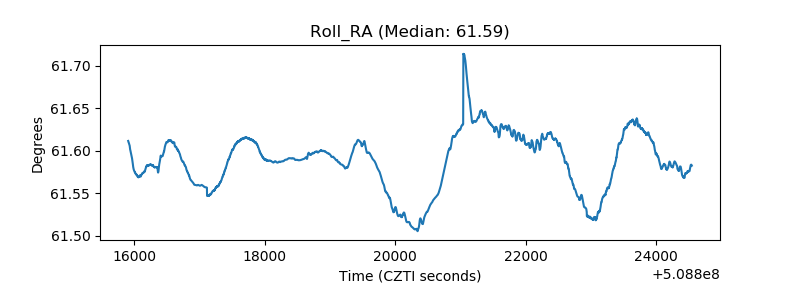 |
| Veto Counter | 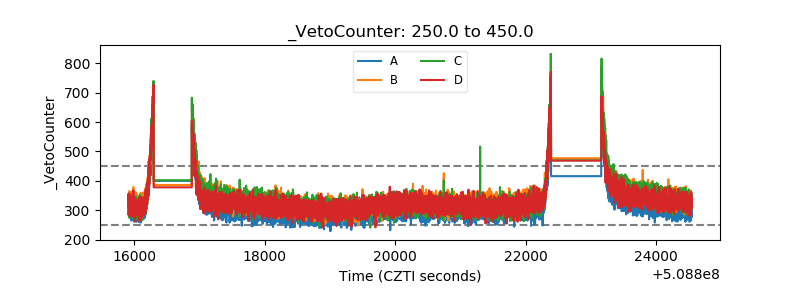 |