| Param | Original file | Final file |
|---|---|---|
| Filename | modeM0/AS1A14_083T04_9000006550_56184cztM0_level2.fits | modeM0/AS1A14_083T04_9000006550_56184cztM0_level2_quad_clean.evt |
| Size (bytes) | 523,460,160 | 92,825,280 |
| Size | 499.2 MB | 88.5 MB |
| Events in quadrant A | 8,179,454 | 492,798 |
| Events in quadrant B | 3,572,230 | 687,138 |
| Events in quadrant C | 3,320,964 | 607,004 |
| Events in quadrant D | 3,782,516 | 556,105 |
| Mode SS | |||
|---|---|---|---|
| Quadrant | BADHDUFLAG | Total packets | Discarded packets |
| A | 0 | 136 | 0 |
| B | 0 | 136 | 0 |
| C | 0 | 136 | 0 |
| D | 0 | 136 | 0 |
| Mode M9 | |||
|---|---|---|---|
| Quadrant | BADHDUFLAG | Total packets | Discarded packets |
| A | 0 | 9 | 0 |
| B | 0 | 9 | 0 |
| C | 0 | 9 | 0 |
| D | 0 | 9 | 0 |
| Mode M0 | |||
|---|---|---|---|
| Quadrant | BADHDUFLAG | Total packets | Discarded packets |
| A | 0 | 28915 | 1 |
| B | 0 | 15372 | 1 |
| C | 0 | 14842 | 1 |
| D | 0 | 15990 | 1 |
| Quadrant | Total seconds | Saturated seconds | Saturation percentage |
|---|---|---|---|
| A | 6706 | 1765 | 26.319714% |
| B | 6707 | 142 | 2.117191% |
| C | 6707 | 125 | 1.863724% |
| D | 6707 | 232 | 3.459073% |
Noise dominated data is calculated using 1-second bins in cleaned event files. If a bin has >2000 counts, and if more than 50% of those come from <1% of pixels, then it is considered to be noise-dominated and hence unusable.
| Quadrant | # 1 sec bins | Bins with >0 counts | Bins with >2000 counts | High rate bins dominated by noise | Noise dominated (total time) | Noise dominated (detector-on time) | Marked lightcurve |
|---|---|---|---|---|---|---|---|
| A | 7641 | 6707 | 1360 | 1360 | 17.80% | 20.28% |  |
| B | 7642 | 6707 | 36 | 36 | 0.47% | 0.54% |  |
| C | 7642 | 6708 | 43 | 43 | 0.56% | 0.64% |  |
| D | 7642 | 6708 | 167 | 167 | 2.19% | 2.49% |  |
Top three noisy pixels from each quadrant. If the there are fewer than three noisy pixels in the level2.evt file, extra rows are filled as -1
| Pixel properties | Quadrant properties | ||||||
|---|---|---|---|---|---|---|---|
| Quadrant | DetID | PixID | Counts | Sigma | Mean | Median | Sigma |
| A | 15 | 32 | 2494949 | 15523.0 | 639 | 623 | 160.7 |
| A | 0 | 212 | 1624335 | 10104.88 | 639 | 623 | 160.7 |
| A | 7 | 64 | 442177 | 2747.93 | 639 | 623 | 160.7 |
| B | 1 | 207 | 313177 | 2019.65 | 721 | 694 | 154.7 |
| B | 5 | 185 | 99997 | 641.82 | 721 | 694 | 154.7 |
| B | 10 | 247 | 53802 | 343.25 | 721 | 694 | 154.7 |
| C | 6 | 223 | 346844 | 1798.14 | 711 | 704 | 192.5 |
| C | 12 | 252 | 117510 | 606.79 | 711 | 704 | 192.5 |
| C | 11 | 244 | 23168 | 116.7 | 711 | 704 | 192.5 |
| D | 11 | 129 | 414951 | 2085.91 | 702 | 668 | 198.6 |
| D | 8 | 129 | 96377 | 481.89 | 702 | 668 | 198.6 |
| D | 14 | 52 | 95402 | 476.98 | 702 | 668 | 198.6 |
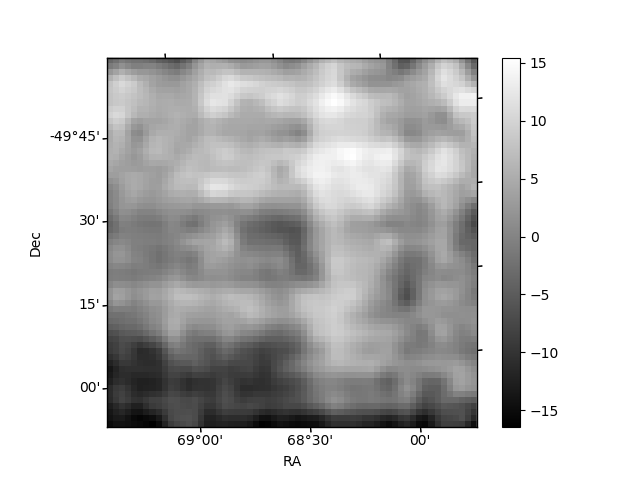
Histogram calculated using DETX and DETY for each event in the final _common_clean file
| Quadrant A | 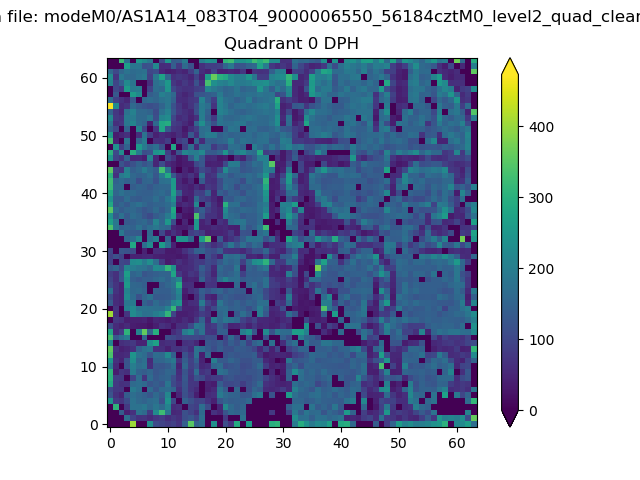 |
 |
Quadrant B |
|---|---|---|---|
| Quadrant D | 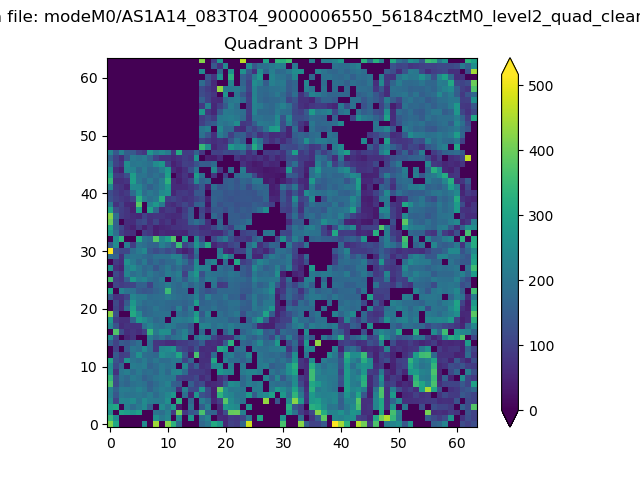 |
 |
Quadrant C |
| Plot type | Count rate plots | Images |
|---|---|---|
| Comparison with Poisson distribution Blue bars denote a histogram of data divided into 1 sec bins. Red curve is a Poisson curve with rate = median count rate of data. |
 |
 |
| Quadrant-wise count rates Data is divided into 100 sec bins |
 |
|
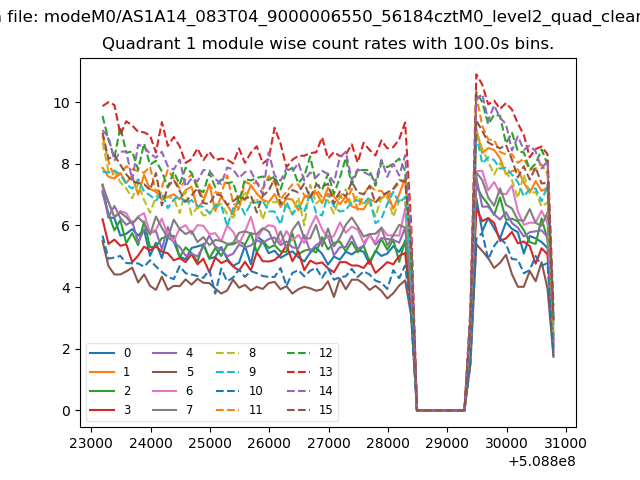
| Module-wise count rates for Quadrant A Data is divided into 100 sec bins |
 |
 |
| Module-wise count rates for Quadrant B Data is divided into 100 sec bins |
 |
 |
| Module-wise count rates for Quadrant C Data is divided into 100 sec bins |
 |
 |
| Module-wise count rates for Quadrant D Data is divided into 100 sec bins |
 |
 |
| Parameter | Plot |
|---|---|
| CZT HV Monitor | 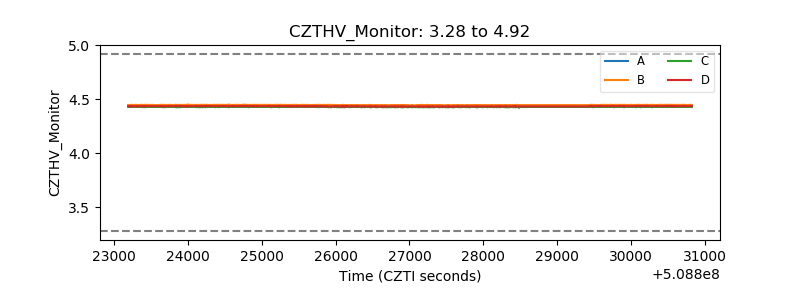 |
| D_VDD |  |
| Temperature 1 | 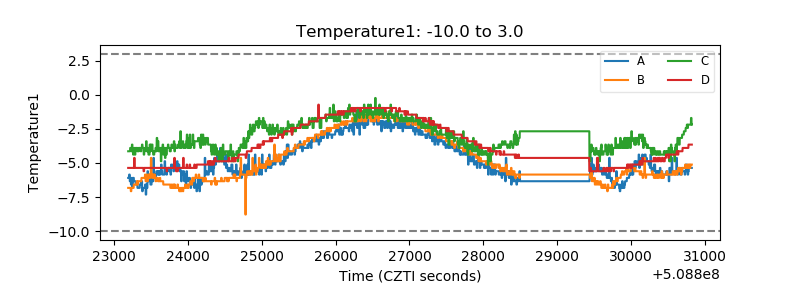 |
| Veto HV Monitor |  |
| Veto LLD |  |
| Alpha Counter | 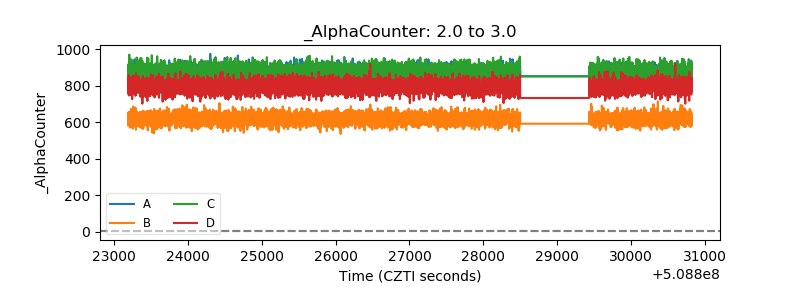 |
| _CPM_Rate | 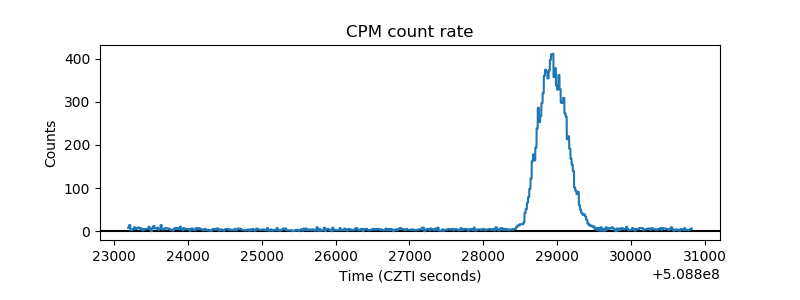 |
| CZT Counter | 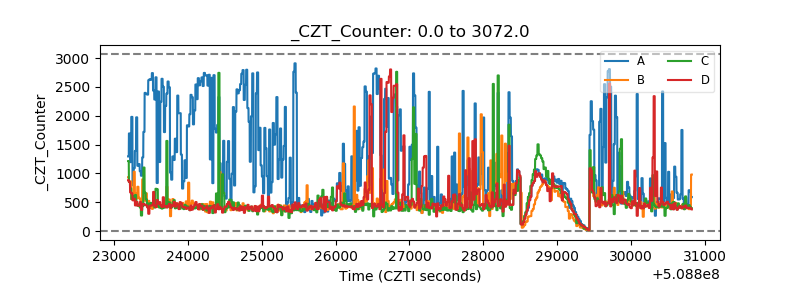 |
| +2.5 Volts monitor | 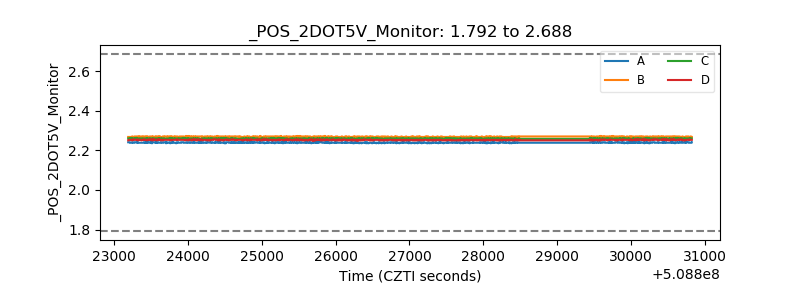 |
| +5 Volts monitor |  |
| _ROLL_ROT |  |
| _Roll_DEC |  |
| _Roll_RA | 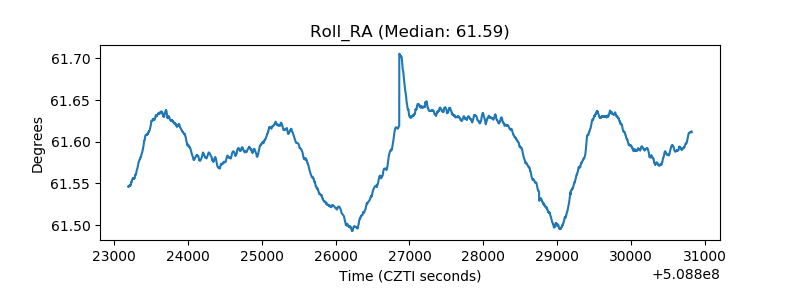 |
| Veto Counter |  |