| Param | Original file | Final file |
|---|---|---|
| Filename | modeM0/AS1A14_083T04_9000006550_56185cztM0_level2.fits | modeM0/AS1A14_083T04_9000006550_56185cztM0_level2_quad_clean.evt |
| Size (bytes) | 463,075,200 | 101,871,360 |
| Size | 441.6 MB | 97.2 MB |
| Events in quadrant A | 5,988,732 | 635,345 |
| Events in quadrant B | 3,417,811 | 721,221 |
| Events in quadrant C | 3,319,459 | 644,828 |
| Events in quadrant D | 3,882,891 | 606,183 |
| Mode SS | |||
|---|---|---|---|
| Quadrant | BADHDUFLAG | Total packets | Discarded packets |
| A | 0 | 140 | 0 |
| B | 0 | 140 | 0 |
| C | 0 | 140 | 0 |
| D | 0 | 140 | 0 |
| Mode M9 | |||
|---|---|---|---|
| Quadrant | BADHDUFLAG | Total packets | Discarded packets |
| A | 0 | 20 | 0 |
| B | 0 | 20 | 0 |
| C | 0 | 20 | 0 |
| D | 0 | 20 | 0 |
| Mode M0 | |||
|---|---|---|---|
| Quadrant | BADHDUFLAG | Total packets | Discarded packets |
| A | 0 | 22487 | 2 |
| B | 0 | 14867 | 2 |
| C | 0 | 14913 | 2 |
| D | 0 | 16229 | 2 |
| Quadrant | Total seconds | Saturated seconds | Saturation percentage |
|---|---|---|---|
| A | 6851 | 665 | 9.706612% |
| B | 6851 | 208 | 3.036053% |
| C | 6852 | 186 | 2.714536% |
| D | 6852 | 211 | 3.079393% |
Noise dominated data is calculated using 1-second bins in cleaned event files. If a bin has >2000 counts, and if more than 50% of those come from <1% of pixels, then it is considered to be noise-dominated and hence unusable.
| Quadrant | # 1 sec bins | Bins with >0 counts | Bins with >2000 counts | High rate bins dominated by noise | Noise dominated (total time) | Noise dominated (detector-on time) | Marked lightcurve |
|---|---|---|---|---|---|---|---|
| A | 8831 | 6852 | 455 | 455 | 5.15% | 6.64% | 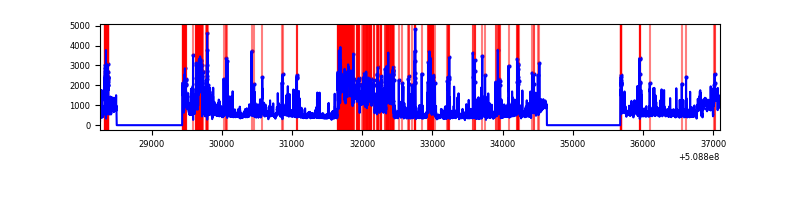 |
| B | 8831 | 6852 | 13 | 13 | 0.15% | 0.19% | 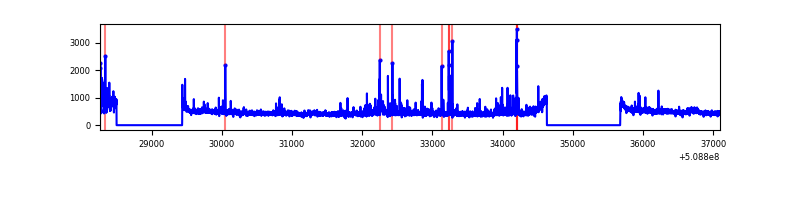 |
| C | 8832 | 6853 | 25 | 25 | 0.28% | 0.36% | 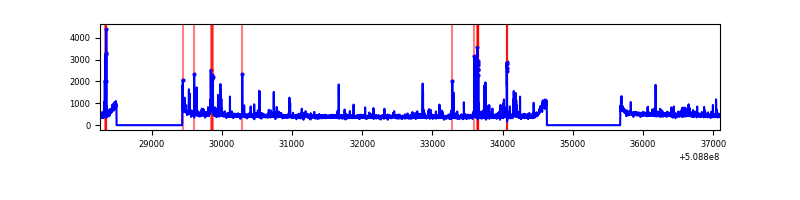 |
| D | 8832 | 6853 | 63 | 63 | 0.71% | 0.92% | 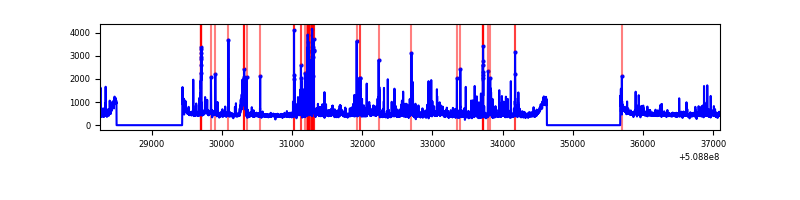 |
Top three noisy pixels from each quadrant. If the there are fewer than three noisy pixels in the level2.evt file, extra rows are filled as -1
| Pixel properties | Quadrant properties | ||||||
|---|---|---|---|---|---|---|---|
| Quadrant | DetID | PixID | Counts | Sigma | Mean | Median | Sigma |
| A | 0 | 250 | 885185 | 4755.79 | 750 | 731 | 186.0 |
| A | 7 | 64 | 671044 | 3604.34 | 750 | 731 | 186.0 |
| A | 0 | 212 | 494607 | 2655.62 | 750 | 731 | 186.0 |
| B | 10 | 247 | 89602 | 544.16 | 761 | 731 | 163.3 |
| B | 1 | 207 | 67335 | 407.82 | 761 | 731 | 163.3 |
| B | 4 | 171 | 58534 | 353.93 | 761 | 731 | 163.3 |
| C | 6 | 223 | 149233 | 721.33 | 756 | 748 | 205.8 |
| C | 12 | 252 | 95596 | 460.76 | 756 | 748 | 205.8 |
| C | 13 | 3 | 86141 | 414.83 | 756 | 748 | 205.8 |
| D | 8 | 240 | 213883 | 988.35 | 755 | 719 | 215.7 |
| D | 8 | 129 | 115669 | 532.98 | 755 | 719 | 215.7 |
| D | 12 | 191 | 103546 | 476.77 | 755 | 719 | 215.7 |
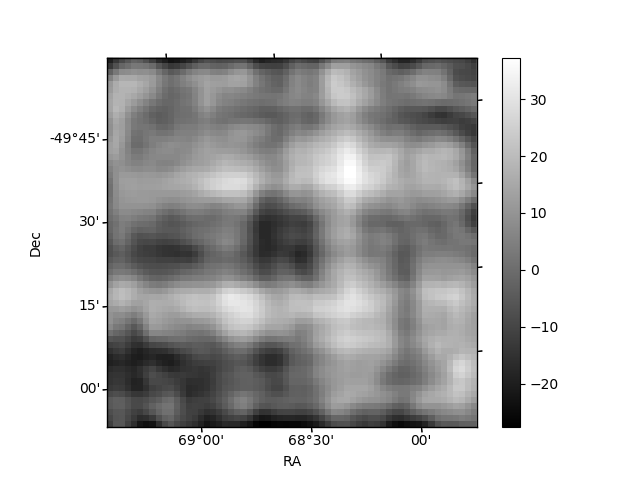
Histogram calculated using DETX and DETY for each event in the final _common_clean file
| Quadrant A |  |
 |
Quadrant B |
|---|---|---|---|
| Quadrant D |  |
 |
Quadrant C |
| Plot type | Count rate plots | Images |
|---|---|---|
| Comparison with Poisson distribution Blue bars denote a histogram of data divided into 1 sec bins. Red curve is a Poisson curve with rate = median count rate of data. |
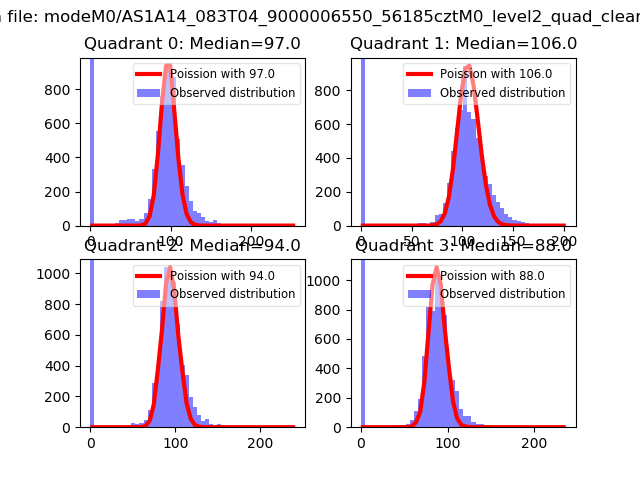 |
 |
| Quadrant-wise count rates Data is divided into 100 sec bins |
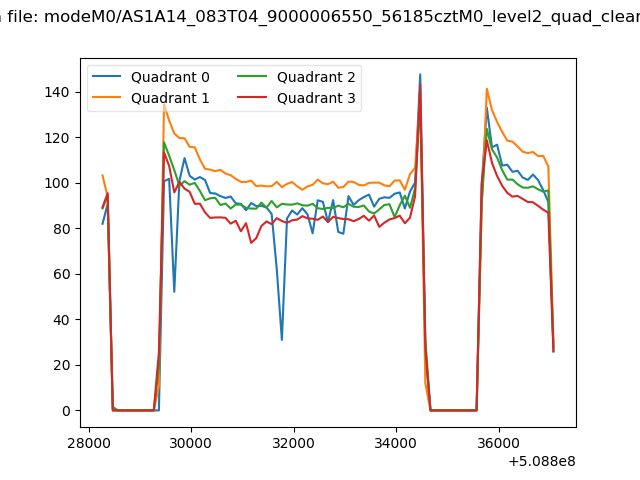 |
|
| Module-wise count rates for Quadrant A Data is divided into 100 sec bins |
 |
 |
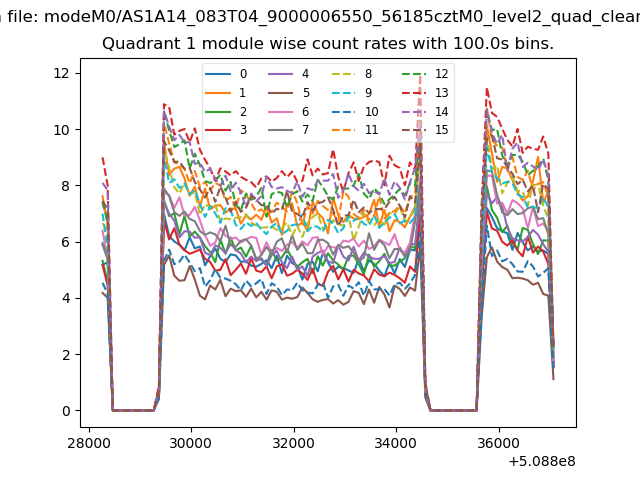
| Module-wise count rates for Quadrant B Data is divided into 100 sec bins |
 |
 |
| Module-wise count rates for Quadrant C Data is divided into 100 sec bins |
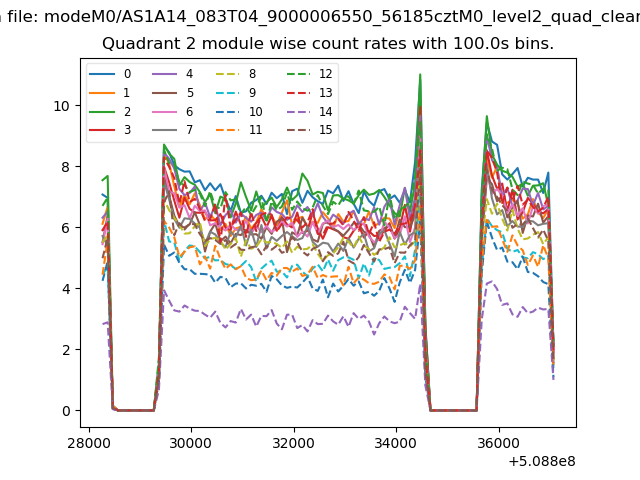 |
 |
| Module-wise count rates for Quadrant D Data is divided into 100 sec bins |
 |
 |
| Parameter | Plot |
|---|---|
| CZT HV Monitor | 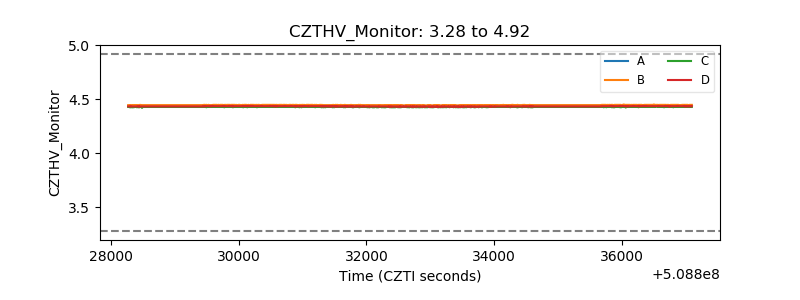 |
| D_VDD | 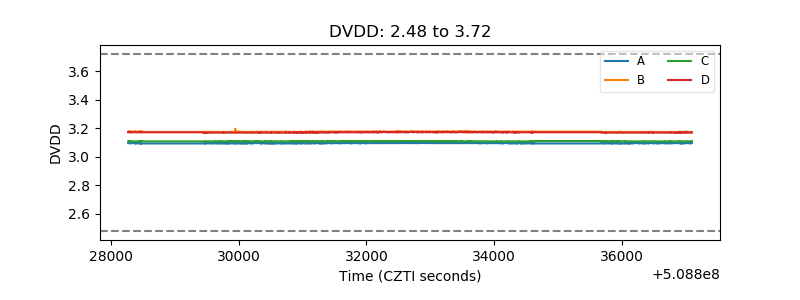 |
| Temperature 1 | 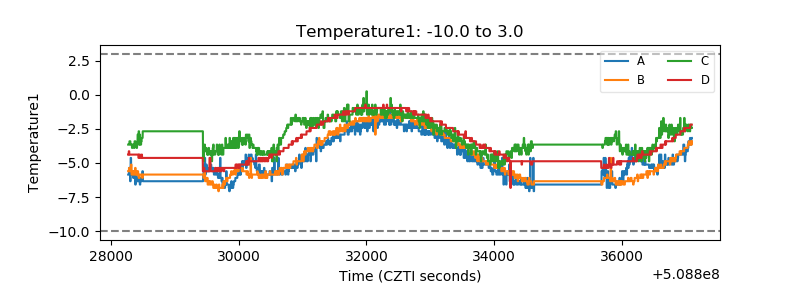 |
| Veto HV Monitor | 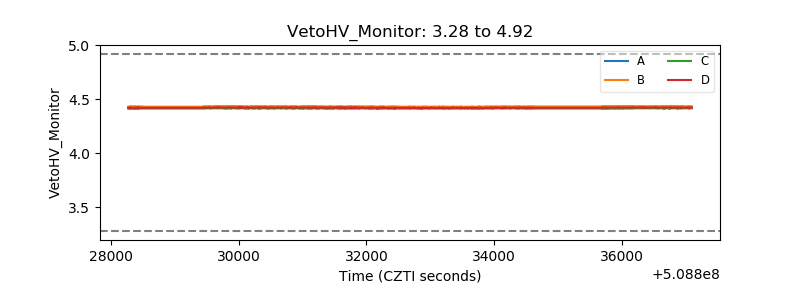 |
| Veto LLD | 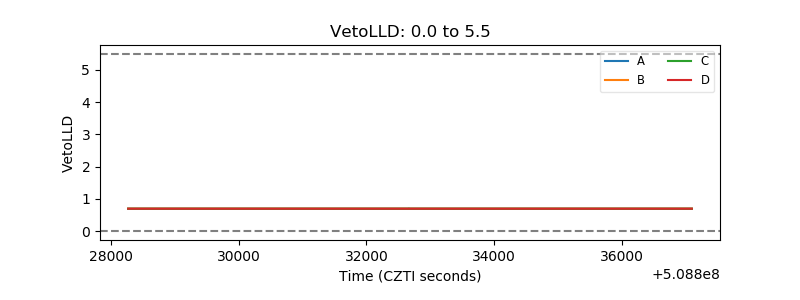 |
| Alpha Counter |  |
| _CPM_Rate |  |
| CZT Counter | 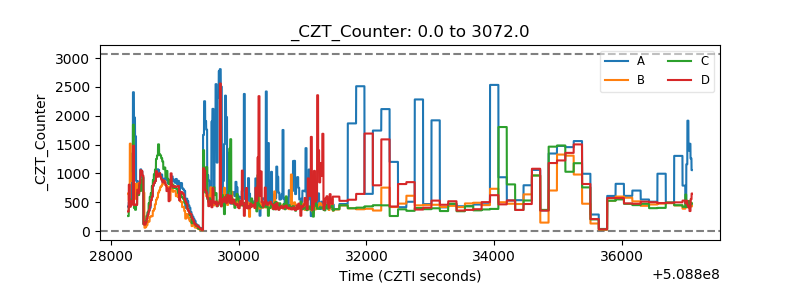 |
| +2.5 Volts monitor |  |
| +5 Volts monitor |  |
| _ROLL_ROT | 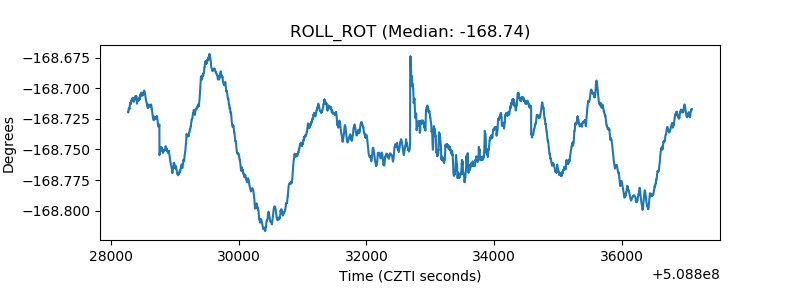 |
| _Roll_DEC | 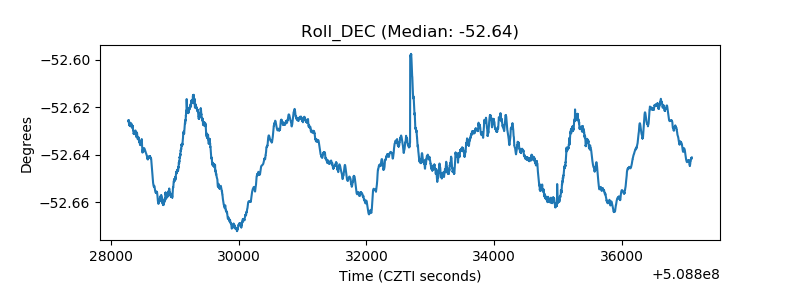 |
| _Roll_RA | 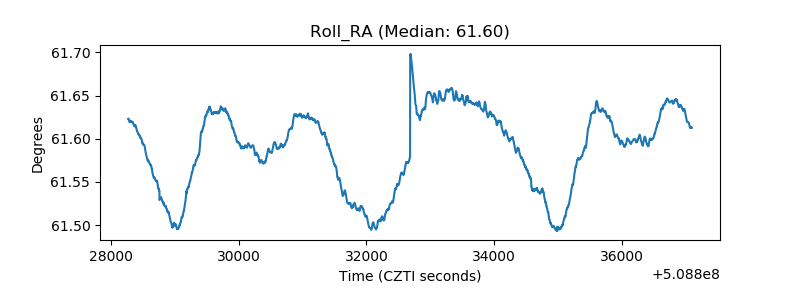 |
| Veto Counter | 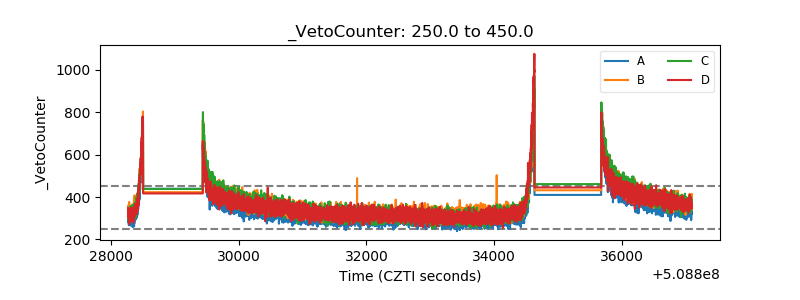 |