| Param | Original file | Final file |
|---|---|---|
| Filename | modeM0/AS1A14_083T04_9000006550_56186cztM0_level2.fits | modeM0/AS1A14_083T04_9000006550_56186cztM0_level2_quad_clean.evt |
| Size (bytes) | 452,557,440 | 99,803,520 |
| Size | 431.6 MB | 95.2 MB |
| Events in quadrant A | 5,171,744 | 644,121 |
| Events in quadrant B | 3,430,201 | 712,252 |
| Events in quadrant C | 4,179,111 | 616,340 |
| Events in quadrant D | 3,463,501 | 594,079 |
| Mode SS | |||
|---|---|---|---|
| Quadrant | BADHDUFLAG | Total packets | Discarded packets |
| A | 0 | 132 | 0 |
| B | 0 | 132 | 0 |
| C | 0 | 132 | 0 |
| D | 0 | 132 | 0 |
| Mode M9 | |||
|---|---|---|---|
| Quadrant | BADHDUFLAG | Total packets | Discarded packets |
| A | 0 | 12 | 0 |
| B | 0 | 12 | 0 |
| C | 0 | 13 | 0 |
| D | 0 | 13 | 0 |
| Mode M0 | |||
|---|---|---|---|
| Quadrant | BADHDUFLAG | Total packets | Discarded packets |
| A | 0 | 19795 | 2 |
| B | 0 | 14654 | 2 |
| C | 0 | 16856 | 2 |
| D | 0 | 14751 | 2 |
| Quadrant | Total seconds | Saturated seconds | Saturation percentage |
|---|---|---|---|
| A | 6528 | 349 | 5.346201% |
| B | 6528 | 180 | 2.757353% |
| C | 6528 | 357 | 5.468750% |
| D | 6528 | 168 | 2.573529% |
Noise dominated data is calculated using 1-second bins in cleaned event files. If a bin has >2000 counts, and if more than 50% of those come from <1% of pixels, then it is considered to be noise-dominated and hence unusable.
| Quadrant | # 1 sec bins | Bins with >0 counts | Bins with >2000 counts | High rate bins dominated by noise | Noise dominated (total time) | Noise dominated (detector-on time) | Marked lightcurve |
|---|---|---|---|---|---|---|---|
| A | 7648 | 6528 | 172 | 172 | 2.25% | 2.63% |  |
| B | 7648 | 6529 | 28 | 28 | 0.37% | 0.43% |  |
| C | 7648 | 6529 | 195 | 195 | 2.55% | 2.99% | 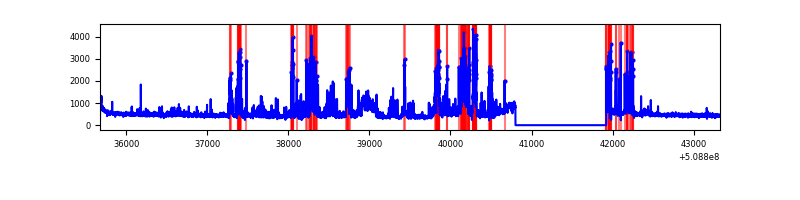 |
| D | 7648 | 6528 | 54 | 54 | 0.71% | 0.83% |  |
Top three noisy pixels from each quadrant. If the there are fewer than three noisy pixels in the level2.evt file, extra rows are filled as -1
| Pixel properties | Quadrant properties | ||||||
|---|---|---|---|---|---|---|---|
| Quadrant | DetID | PixID | Counts | Sigma | Mean | Median | Sigma |
| A | 0 | 212 | 672608 | 3711.87 | 729 | 711 | 181.0 |
| A | 7 | 64 | 481938 | 2658.52 | 729 | 711 | 181.0 |
| A | 8 | 176 | 293222 | 1615.96 | 729 | 711 | 181.0 |
| B | 5 | 185 | 296662 | 1914.97 | 727 | 701 | 154.6 |
| B | 10 | 247 | 67048 | 429.29 | 727 | 701 | 154.6 |
| B | 4 | 171 | 34412 | 218.12 | 727 | 701 | 154.6 |
| C | 12 | 252 | 898974 | 4671.81 | 708 | 703 | 192.3 |
| C | 12 | 254 | 387483 | 2011.6 | 708 | 703 | 192.3 |
| C | 6 | 223 | 36609 | 186.74 | 708 | 703 | 192.3 |
| D | 8 | 129 | 120177 | 585.26 | 720 | 686 | 204.2 |
| D | 12 | 6 | 92406 | 449.24 | 720 | 686 | 204.2 |
| D | 2 | 249 | 79707 | 387.04 | 720 | 686 | 204.2 |
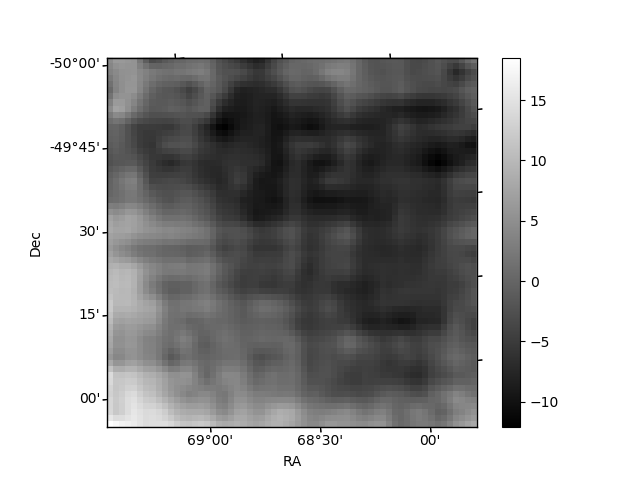
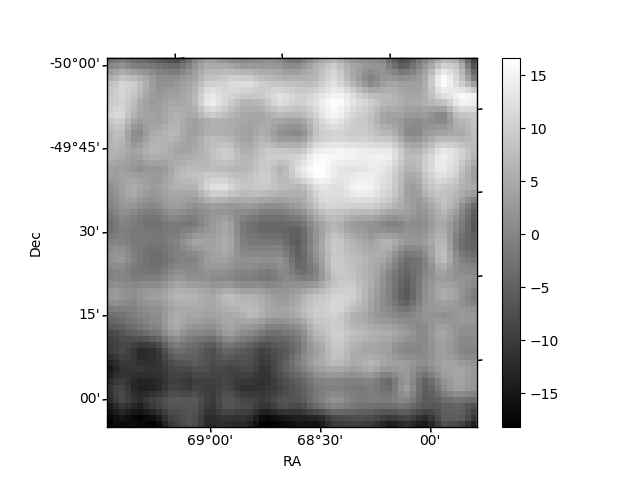
Histogram calculated using DETX and DETY for each event in the final _common_clean file
| Quadrant A |  |
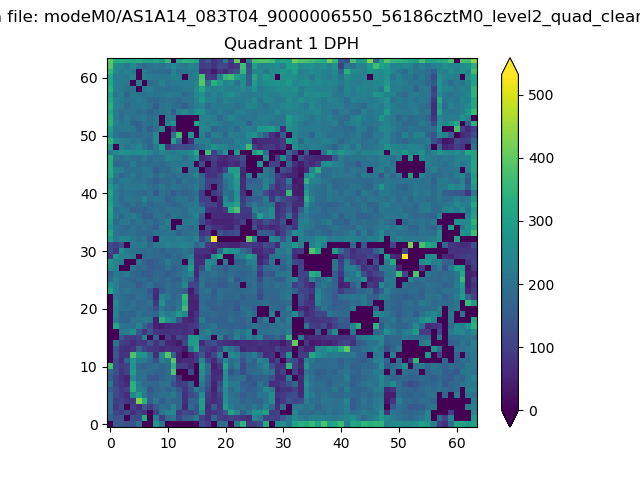 |
Quadrant B |
|---|---|---|---|
| Quadrant D |  |
 |
Quadrant C |
| Plot type | Count rate plots | Images |
|---|---|---|
| Comparison with Poisson distribution Blue bars denote a histogram of data divided into 1 sec bins. Red curve is a Poisson curve with rate = median count rate of data. |
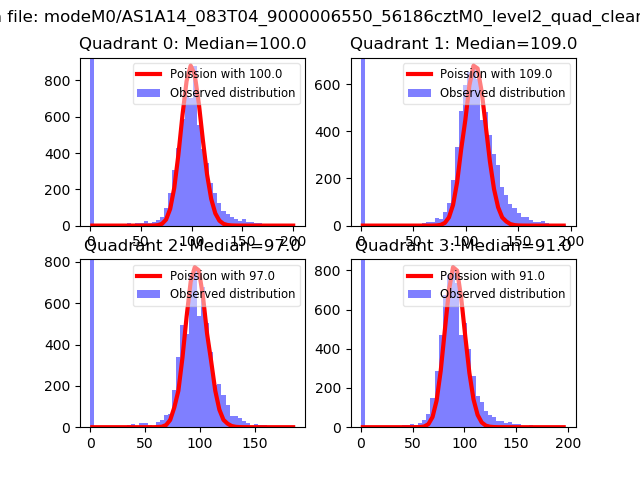 |
 |
| Quadrant-wise count rates Data is divided into 100 sec bins |
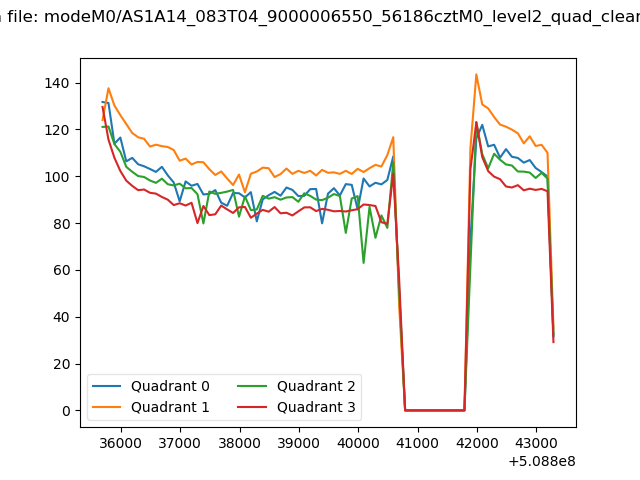 |
|
| Module-wise count rates for Quadrant A Data is divided into 100 sec bins |
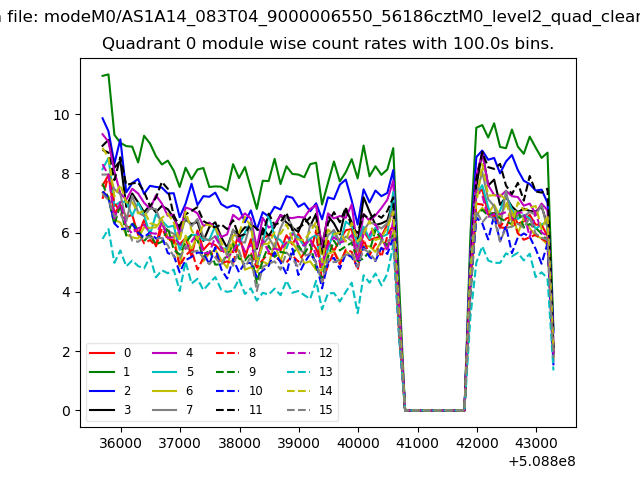 |
 |
| Module-wise count rates for Quadrant B Data is divided into 100 sec bins |
 |
 |
| Module-wise count rates for Quadrant C Data is divided into 100 sec bins |
 |
 |
| Module-wise count rates for Quadrant D Data is divided into 100 sec bins |
 |
 |
| Parameter | Plot |
|---|---|
| CZT HV Monitor |  |
| D_VDD | 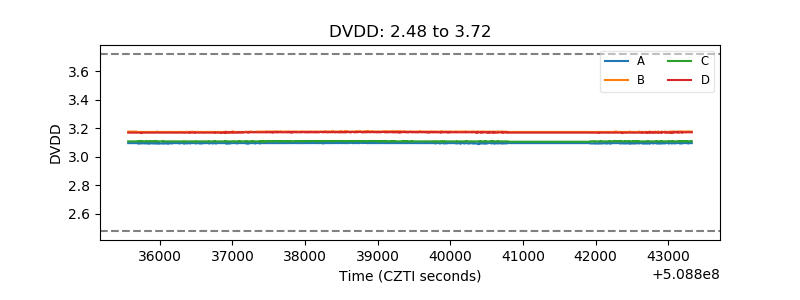 |
| Temperature 1 | 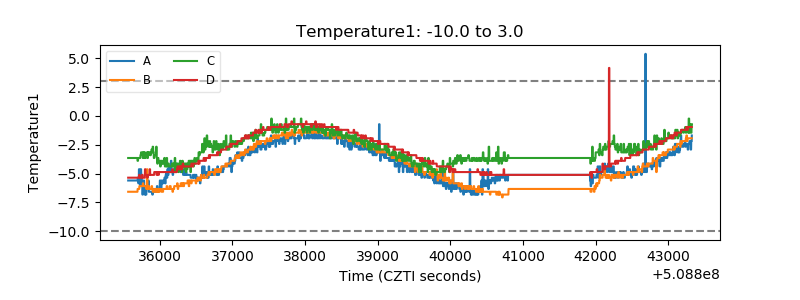 |
| Veto HV Monitor |  |
| Veto LLD | 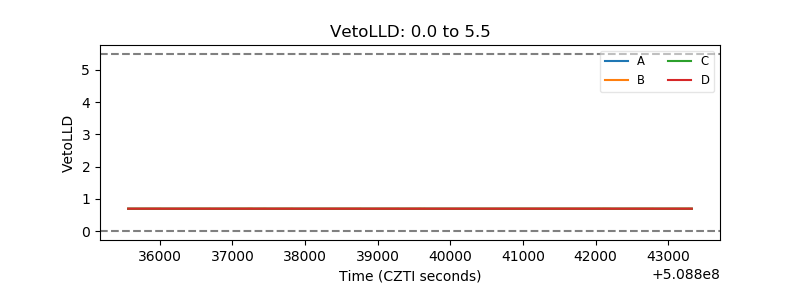 |
| Alpha Counter |  |
| _CPM_Rate | 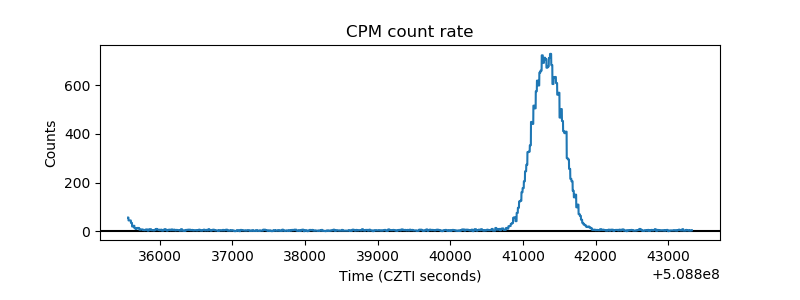 |
| CZT Counter | 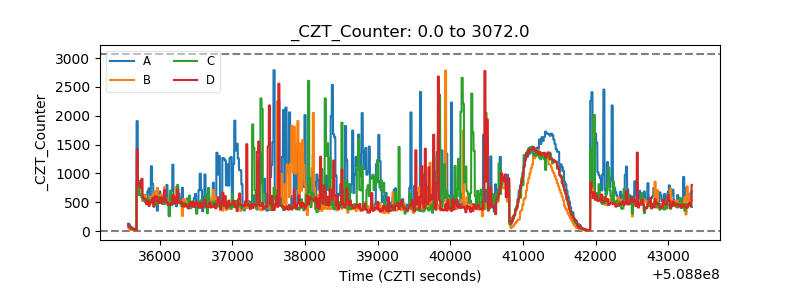 |
| +2.5 Volts monitor | 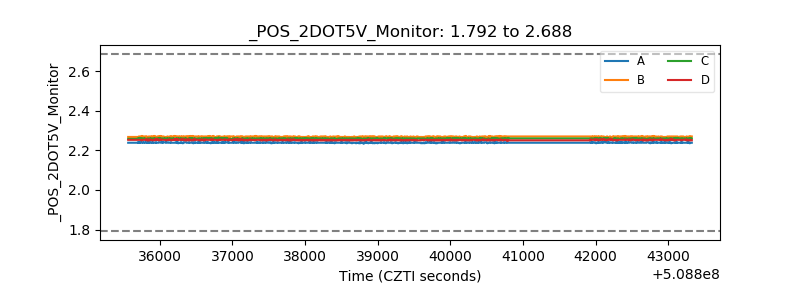 |
| +5 Volts monitor | 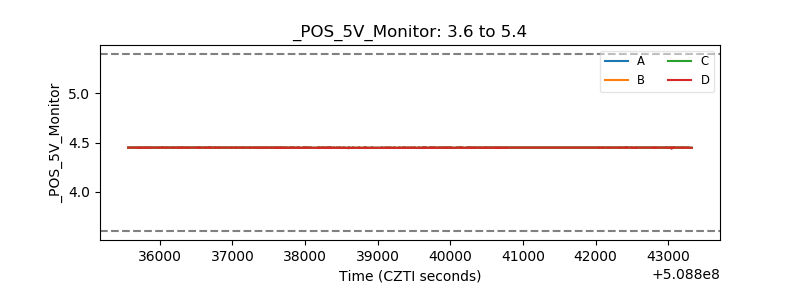 |
| _ROLL_ROT |  |
| _Roll_DEC |  |
| _Roll_RA |  |
| Veto Counter |  |