| Param | Original file | Final file |
|---|---|---|
| Filename | modeM0/AS1A14_083T04_9000006550_56187cztM0_level2.fits | modeM0/AS1A14_083T04_9000006550_56187cztM0_level2_quad_clean.evt |
| Size (bytes) | 560,488,320 | 100,949,760 |
| Size | 534.5 MB | 96.3 MB |
| Events in quadrant A | 7,691,857 | 601,566 |
| Events in quadrant B | 3,847,382 | 737,407 |
| Events in quadrant C | 4,639,876 | 624,665 |
| Events in quadrant D | 4,039,267 | 617,889 |
| Mode SS | |||
|---|---|---|---|
| Quadrant | BADHDUFLAG | Total packets | Discarded packets |
| A | 0 | 140 | 0 |
| B | 0 | 140 | 0 |
| C | 0 | 140 | 0 |
| D | 0 | 140 | 0 |
| Mode M9 | |||
|---|---|---|---|
| Quadrant | BADHDUFLAG | Total packets | Discarded packets |
| A | 0 | 17 | 0 |
| B | 0 | 18 | 0 |
| C | 0 | 18 | 0 |
| D | 0 | 18 | 0 |
| Mode M0 | |||
|---|---|---|---|
| Quadrant | BADHDUFLAG | Total packets | Discarded packets |
| A | 0 | 27515 | 4 |
| B | 0 | 15978 | 2 |
| C | 0 | 18607 | 2 |
| D | 0 | 16569 | 2 |
| Quadrant | Total seconds | Saturated seconds | Saturation percentage |
|---|---|---|---|
| A | 6815 | 1178 | 17.285400% |
| B | 6815 | 261 | 3.829787% |
| C | 6815 | 563 | 8.261189% |
| D | 6815 | 201 | 2.949376% |
Noise dominated data is calculated using 1-second bins in cleaned event files. If a bin has >2000 counts, and if more than 50% of those come from <1% of pixels, then it is considered to be noise-dominated and hence unusable.
| Quadrant | # 1 sec bins | Bins with >0 counts | Bins with >2000 counts | High rate bins dominated by noise | Noise dominated (total time) | Noise dominated (detector-on time) | Marked lightcurve |
|---|---|---|---|---|---|---|---|
| A | 7966 | 6817 | 905 | 905 | 11.36% | 13.28% |  |
| B | 7966 | 6817 | 107 | 107 | 1.34% | 1.57% |  |
| C | 7966 | 6817 | 338 | 338 | 4.24% | 4.96% | 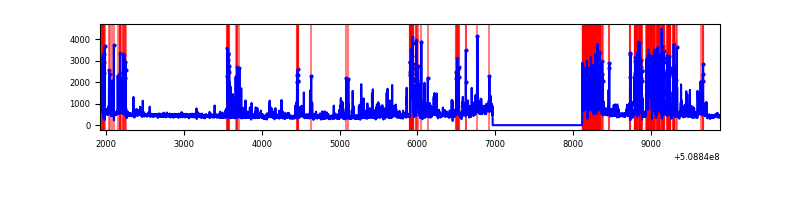 |
| D | 7966 | 6817 | 102 | 102 | 1.28% | 1.50% |  |
Top three noisy pixels from each quadrant. If the there are fewer than three noisy pixels in the level2.evt file, extra rows are filled as -1
| Pixel properties | Quadrant properties | ||||||
|---|---|---|---|---|---|---|---|
| Quadrant | DetID | PixID | Counts | Sigma | Mean | Median | Sigma |
| A | 15 | 32 | 2197075 | 12353.59 | 717 | 698 | 177.8 |
| A | 8 | 176 | 1554956 | 8741.97 | 717 | 698 | 177.8 |
| A | 7 | 64 | 382349 | 2146.61 | 717 | 698 | 177.8 |
| B | 4 | 141 | 274614 | 1714.35 | 752 | 725 | 159.8 |
| B | 5 | 185 | 180609 | 1125.94 | 752 | 725 | 159.8 |
| B | 4 | 171 | 103291 | 641.99 | 752 | 725 | 159.8 |
| C | 12 | 254 | 1442351 | 7299.13 | 715 | 707 | 197.5 |
| C | 6 | 223 | 187063 | 943.53 | 715 | 707 | 197.5 |
| C | 12 | 252 | 133741 | 673.56 | 715 | 707 | 197.5 |
| D | 11 | 129 | 196673 | 931.59 | 741 | 707 | 210.4 |
| D | 2 | 249 | 168216 | 796.31 | 741 | 707 | 210.4 |
| D | 8 | 129 | 154241 | 729.88 | 741 | 707 | 210.4 |
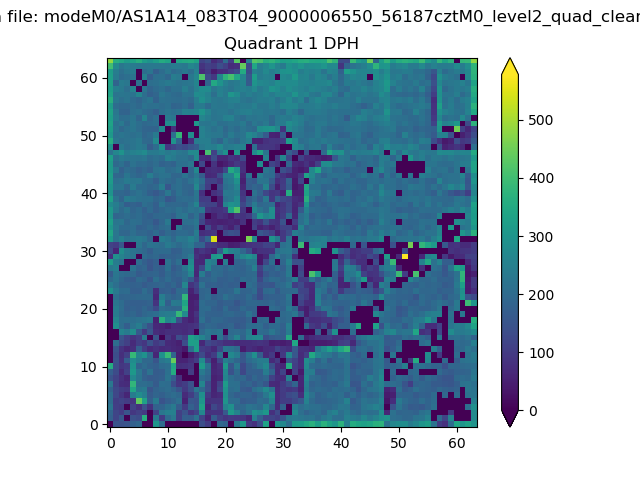
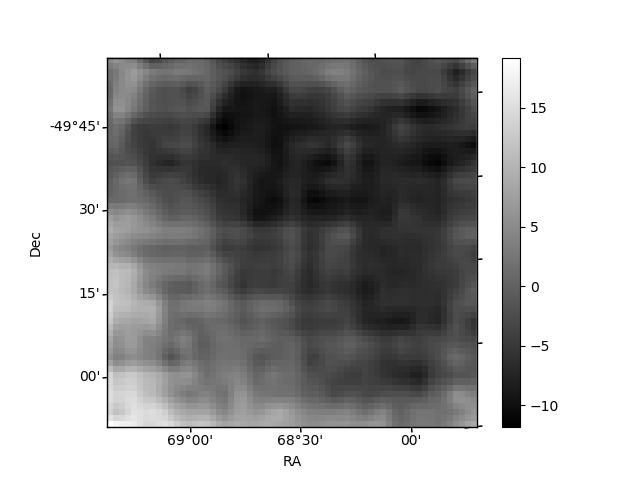
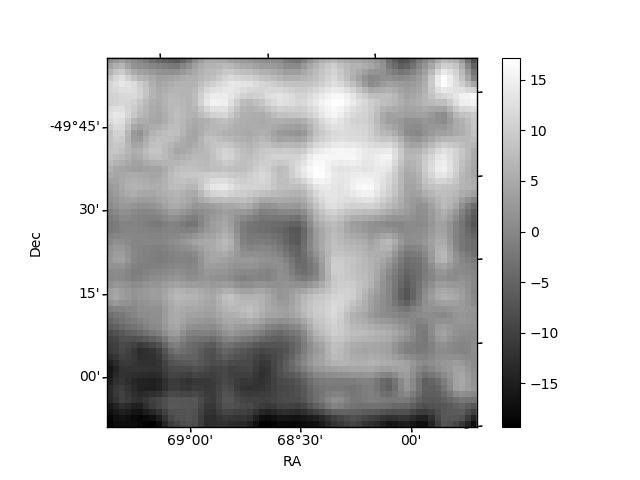
Histogram calculated using DETX and DETY for each event in the final _common_clean file
| Quadrant A |  |
 |
Quadrant B |
|---|---|---|---|
| Quadrant D |  |
 |
Quadrant C |
| Plot type | Count rate plots | Images |
|---|---|---|
| Comparison with Poisson distribution Blue bars denote a histogram of data divided into 1 sec bins. Red curve is a Poisson curve with rate = median count rate of data. |
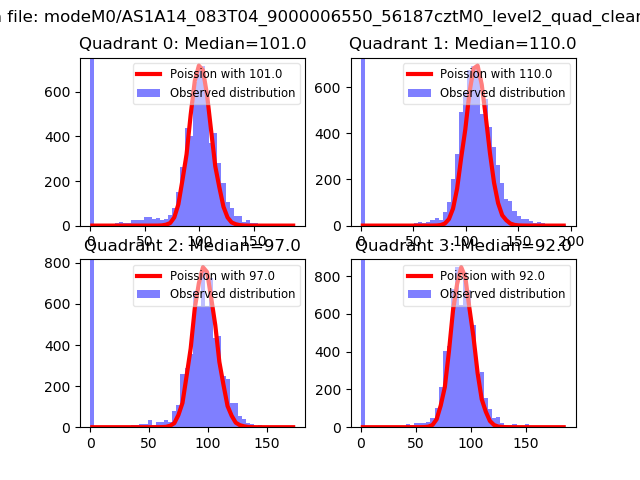 |
 |
| Quadrant-wise count rates Data is divided into 100 sec bins |
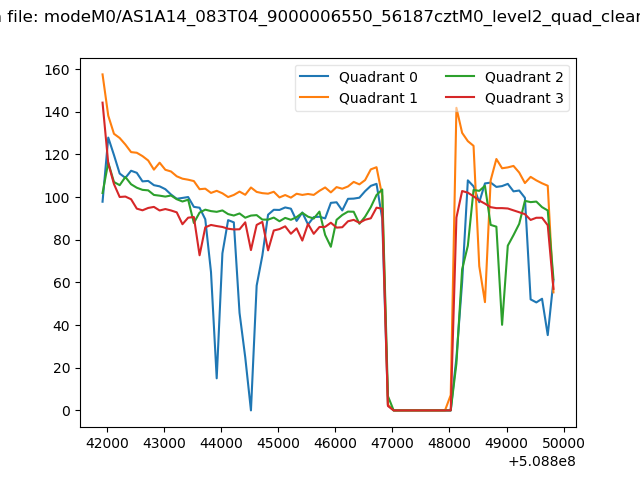 |
|
| Module-wise count rates for Quadrant A Data is divided into 100 sec bins |
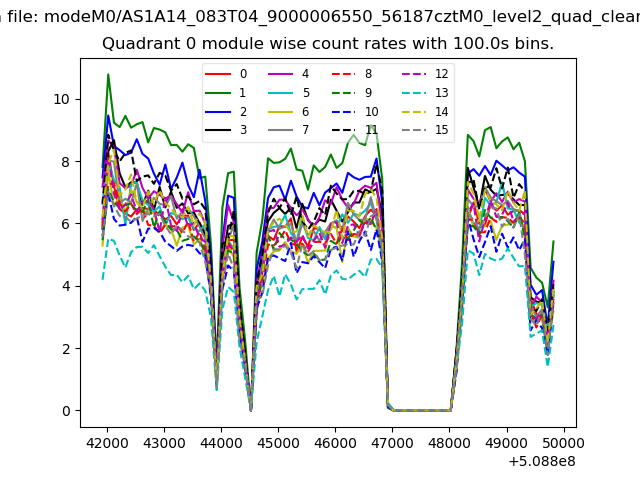 |
 |
| Module-wise count rates for Quadrant B Data is divided into 100 sec bins |
 |
 |
| Module-wise count rates for Quadrant C Data is divided into 100 sec bins |
 |
 |
| Module-wise count rates for Quadrant D Data is divided into 100 sec bins |
 |
 |
| Parameter | Plot |
|---|---|
| CZT HV Monitor | 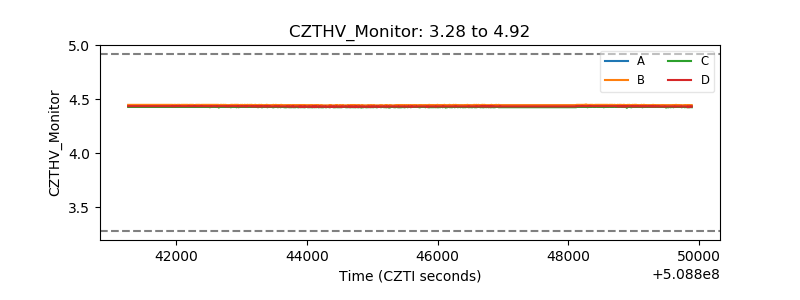 |
| D_VDD | 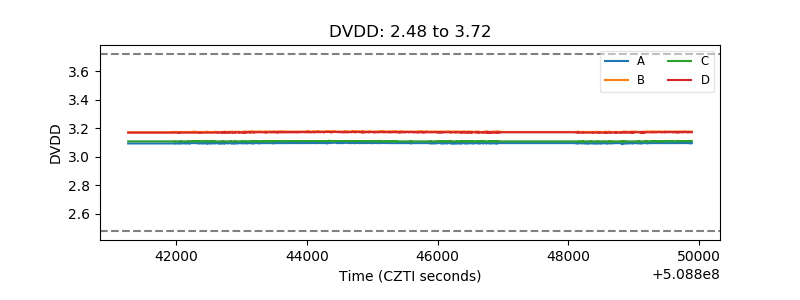 |
| Temperature 1 | 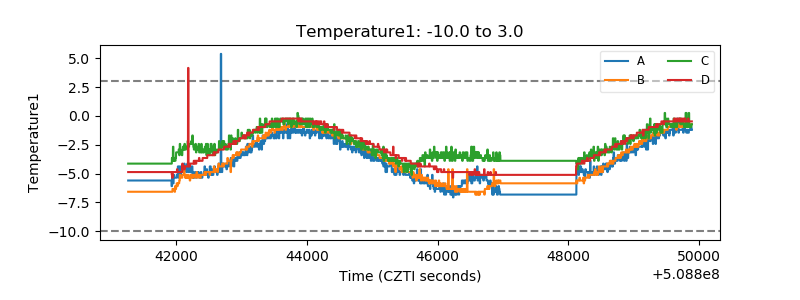 |
| Veto HV Monitor |  |
| Veto LLD | 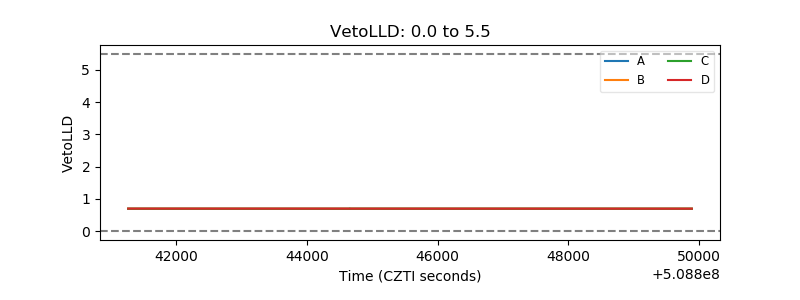 |
| Alpha Counter | 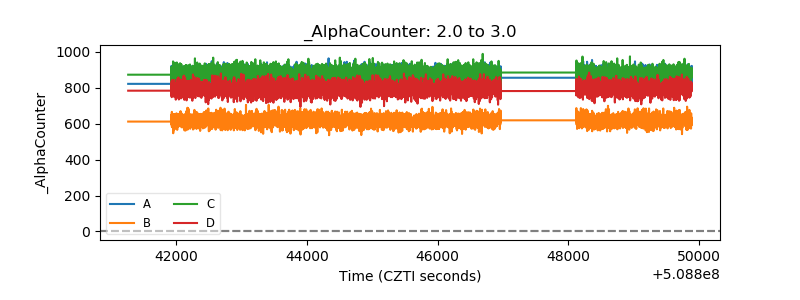 |
| _CPM_Rate | 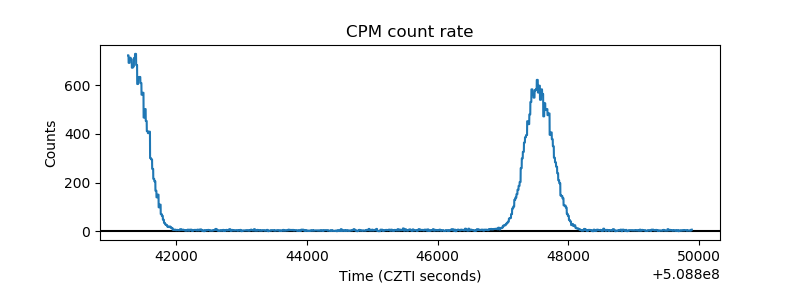 |
| CZT Counter | 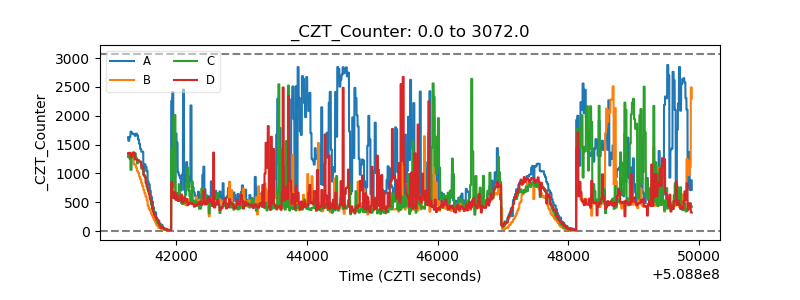 |
| +2.5 Volts monitor | 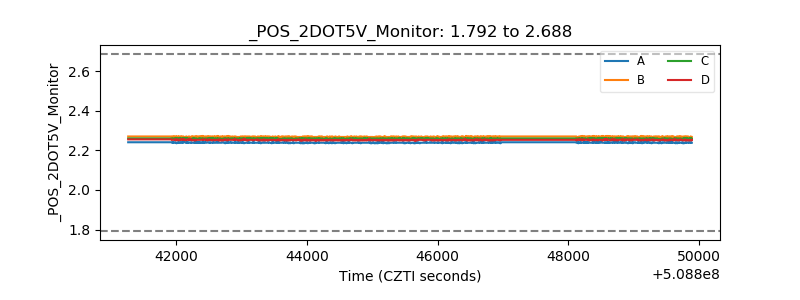 |
| +5 Volts monitor |  |
| _ROLL_ROT |  |
| _Roll_DEC |  |
| _Roll_RA |  |
| Veto Counter |  |