| Param | Original file | Final file |
|---|---|---|
| Filename | modeM0/AS1A14_083T04_9000006550_56190cztM0_level2.fits | modeM0/AS1A14_083T04_9000006550_56190cztM0_level2_quad_clean.evt |
| Size (bytes) | 576,512,640 | 87,318,720 |
| Size | 549.8 MB | 83.3 MB |
| Events in quadrant A | 9,129,464 | 475,901 |
| Events in quadrant B | 3,553,507 | 639,253 |
| Events in quadrant C | 4,121,276 | 556,297 |
| Events in quadrant D | 4,041,077 | 527,088 |
| Mode SS | |||
|---|---|---|---|
| Quadrant | BADHDUFLAG | Total packets | Discarded packets |
| A | 0 | 128 | 0 |
| B | 0 | 128 | 0 |
| C | 0 | 128 | 0 |
| D | 0 | 128 | 0 |
| Mode M9 | |||
|---|---|---|---|
| Quadrant | BADHDUFLAG | Total packets | Discarded packets |
| A | 0 | 6 | 0 |
| B | 0 | 6 | 0 |
| C | 0 | 6 | 0 |
| D | 0 | 6 | 0 |
| Mode M0 | |||
|---|---|---|---|
| Quadrant | BADHDUFLAG | Total packets | Discarded packets |
| A | 0 | 31564 | 1 |
| B | 0 | 15274 | 1 |
| C | 0 | 17203 | 1 |
| D | 0 | 16753 | 5 |
| Quadrant | Total seconds | Saturated seconds | Saturation percentage |
|---|---|---|---|
| A | 6383 | 1722 | 26.977910% |
| B | 6384 | 210 | 3.289474% |
| C | 6384 | 326 | 5.106516% |
| D | 6383 | 288 | 4.511985% |
Noise dominated data is calculated using 1-second bins in cleaned event files. If a bin has >2000 counts, and if more than 50% of those come from <1% of pixels, then it is considered to be noise-dominated and hence unusable.
| Quadrant | # 1 sec bins | Bins with >0 counts | Bins with >2000 counts | High rate bins dominated by noise | Noise dominated (total time) | Noise dominated (detector-on time) | Marked lightcurve |
|---|---|---|---|---|---|---|---|
| A | 6968 | 6384 | 1432 | 1432 | 20.55% | 22.43% | 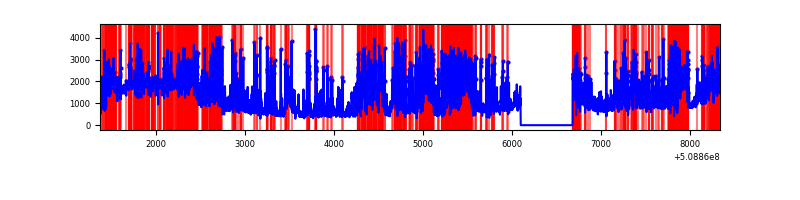 |
| B | 6969 | 6385 | 99 | 99 | 1.42% | 1.55% | 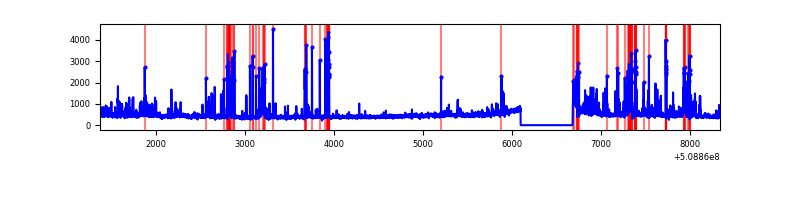 |
| C | 6969 | 6385 | 258 | 258 | 3.70% | 4.04% | 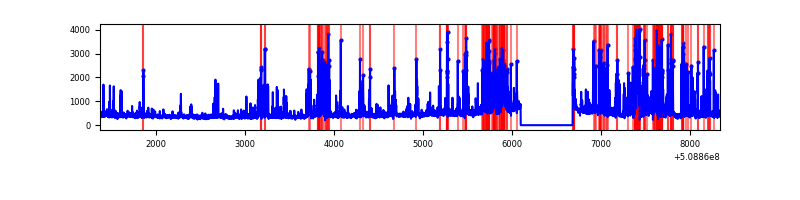 |
| D | 6968 | 6384 | 223 | 223 | 3.20% | 3.49% | 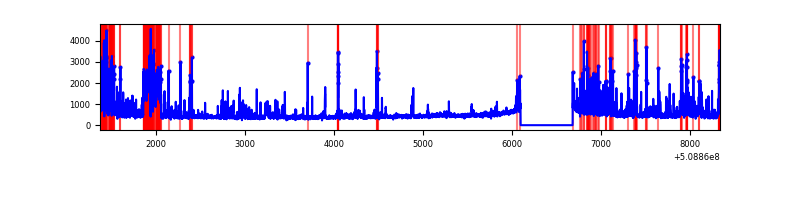 |
Top three noisy pixels from each quadrant. If the there are fewer than three noisy pixels in the level2.evt file, extra rows are filled as -1
| Pixel properties | Quadrant properties | ||||||
|---|---|---|---|---|---|---|---|
| Quadrant | DetID | PixID | Counts | Sigma | Mean | Median | Sigma |
| A | 8 | 176 | 2469930 | 16248.16 | 607 | 593 | 152.0 |
| A | 15 | 32 | 1940568 | 12764.98 | 607 | 593 | 152.0 |
| A | 7 | 64 | 962411 | 6328.73 | 607 | 593 | 152.0 |
| B | 4 | 171 | 232564 | 1628.64 | 663 | 639 | 142.4 |
| B | 10 | 247 | 157392 | 1100.76 | 663 | 639 | 142.4 |
| B | 5 | 185 | 112358 | 784.52 | 663 | 639 | 142.4 |
| C | 12 | 254 | 1362419 | 7784.3 | 637 | 632 | 174.9 |
| C | 12 | 252 | 175449 | 999.3 | 637 | 632 | 174.9 |
| C | 14 | 254 | 40591 | 228.42 | 637 | 632 | 174.9 |
| D | 2 | 249 | 479257 | 2686.09 | 634 | 606 | 178.2 |
| D | 11 | 129 | 465642 | 2609.69 | 634 | 606 | 178.2 |
| D | 6 | 239 | 233466 | 1306.76 | 634 | 606 | 178.2 |
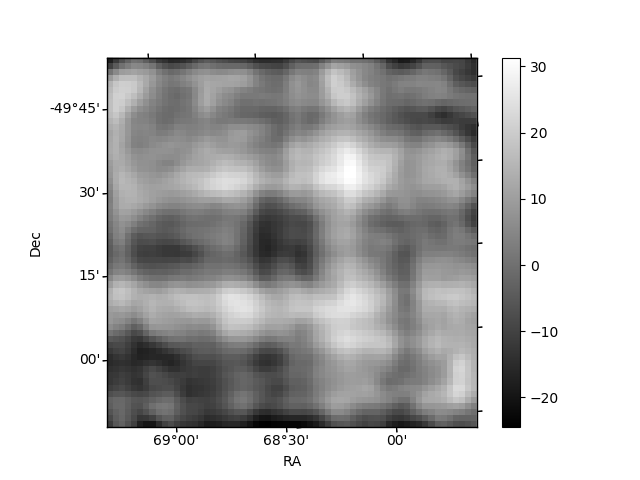
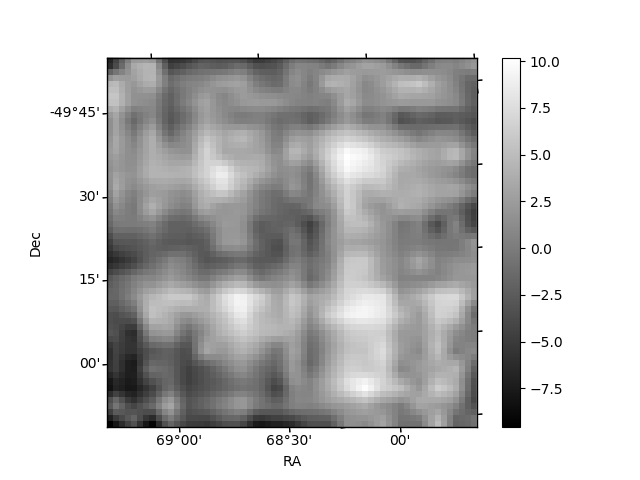
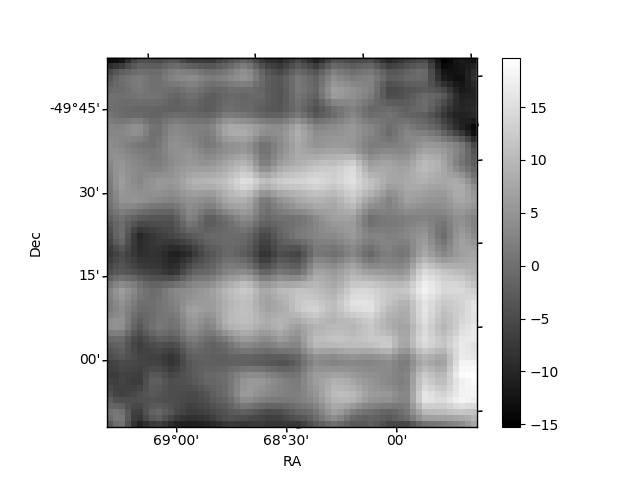
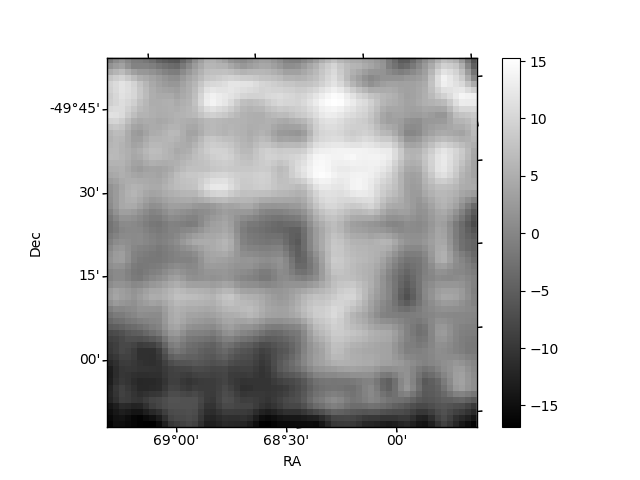
Histogram calculated using DETX and DETY for each event in the final _common_clean file
| Quadrant A | 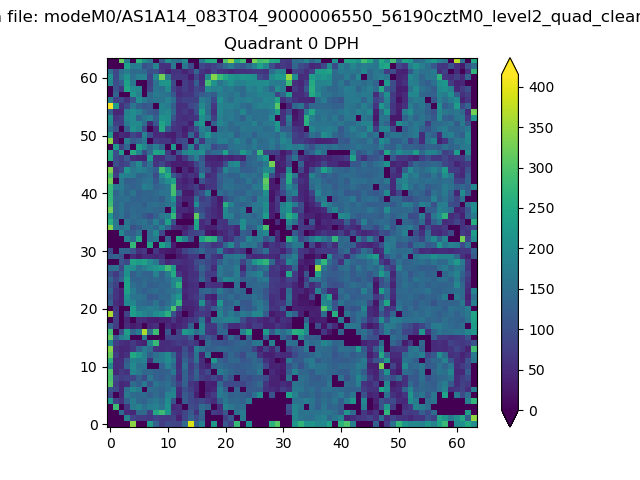 |
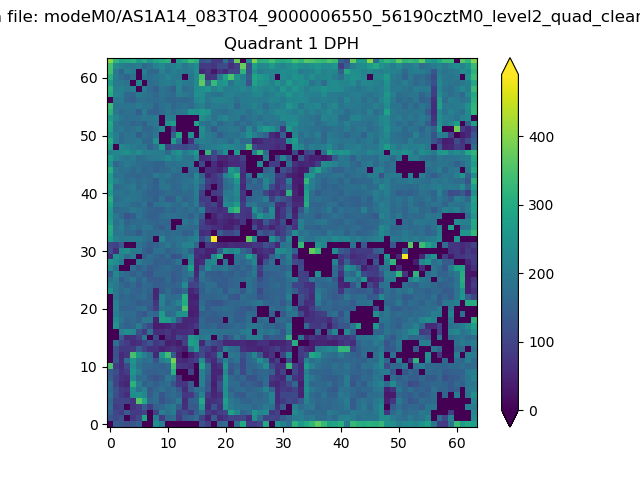 |
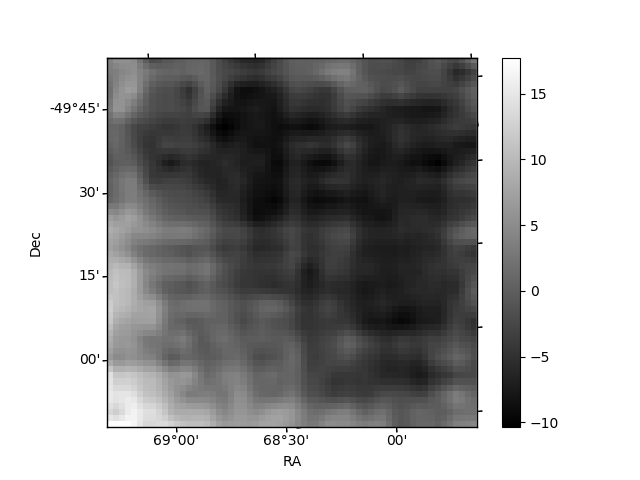
Quadrant B |
|---|---|---|---|
| Quadrant D | 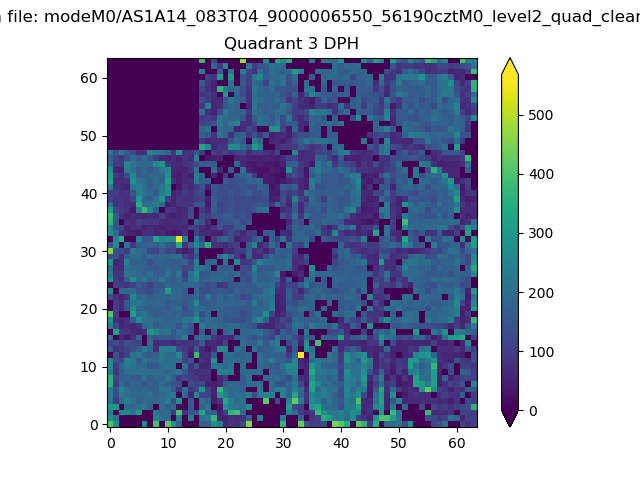 |
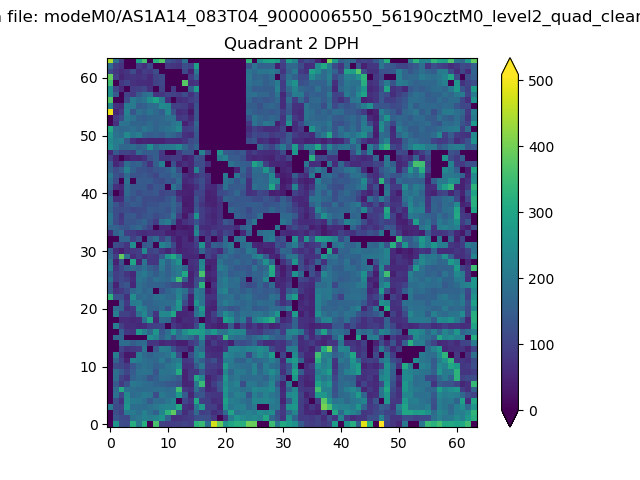 |
Quadrant C |
| Plot type | Count rate plots | Images |
|---|---|---|
| Comparison with Poisson distribution Blue bars denote a histogram of data divided into 1 sec bins. Red curve is a Poisson curve with rate = median count rate of data. |
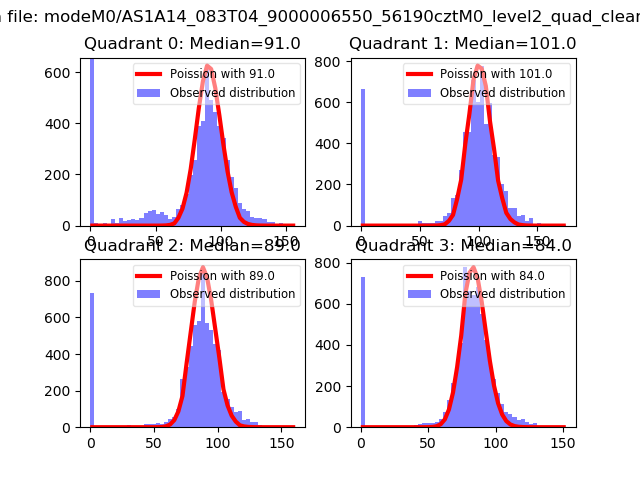 |
 |
| Quadrant-wise count rates Data is divided into 100 sec bins |
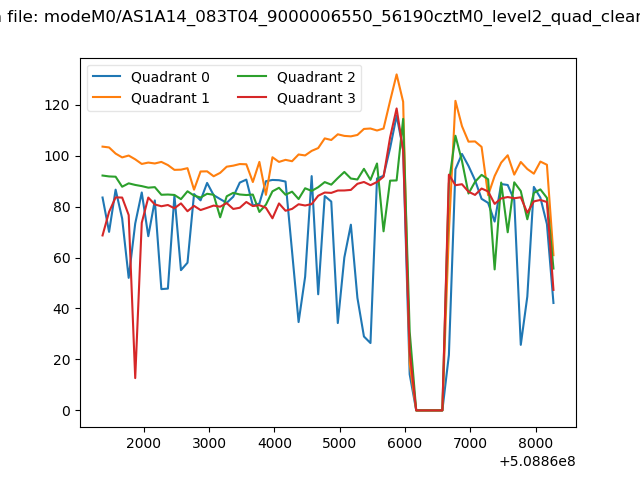 |
|
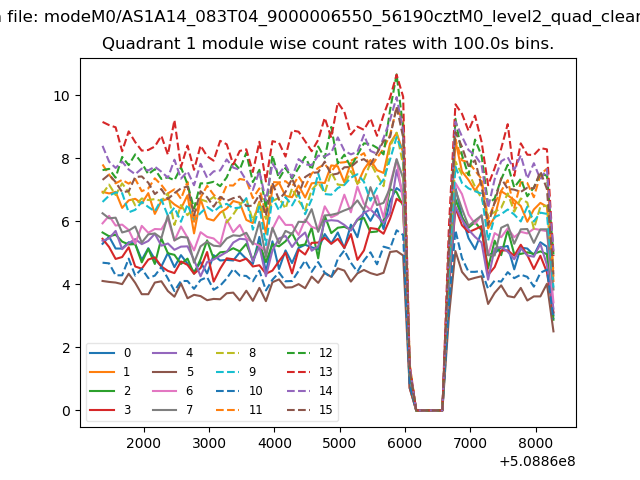
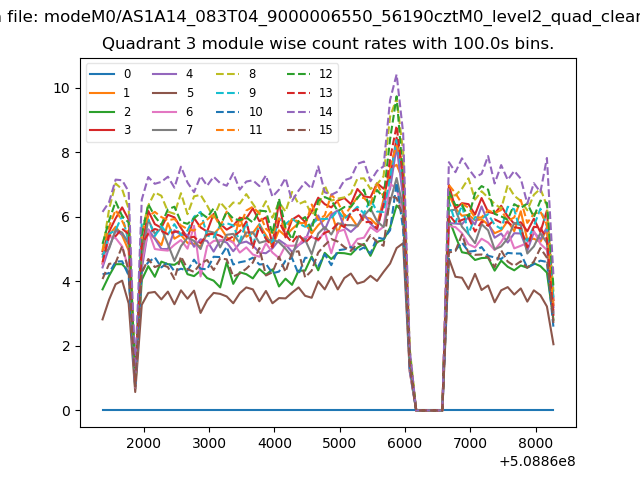
| Module-wise count rates for Quadrant A Data is divided into 100 sec bins |
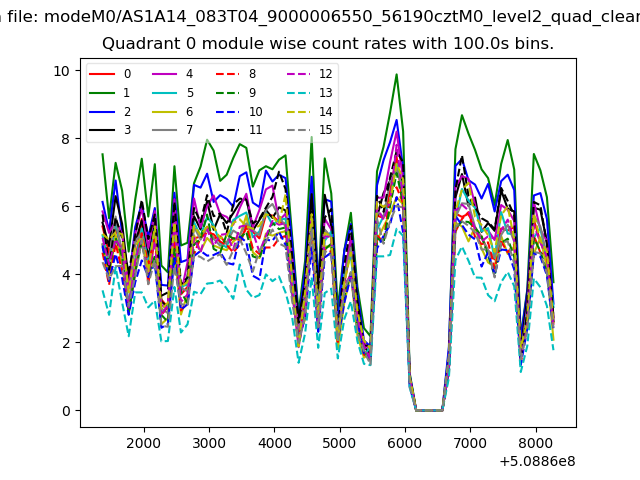 |
 |
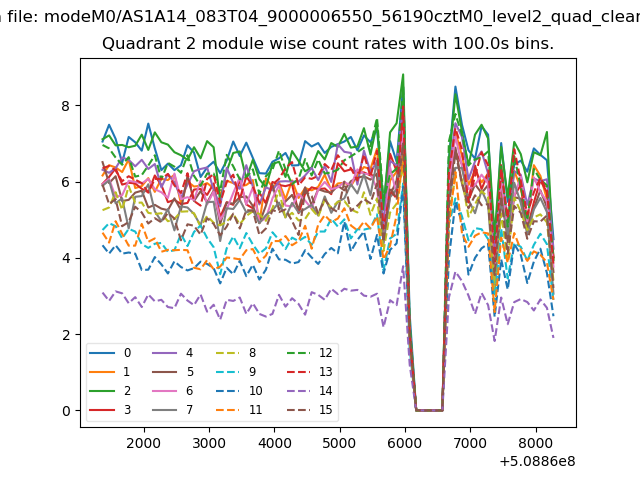
| Module-wise count rates for Quadrant B Data is divided into 100 sec bins |
 |
 |
| Module-wise count rates for Quadrant C Data is divided into 100 sec bins |
 |
 |
| Module-wise count rates for Quadrant D Data is divided into 100 sec bins |
 |
 |
| Parameter | Plot |
|---|---|
| CZT HV Monitor | 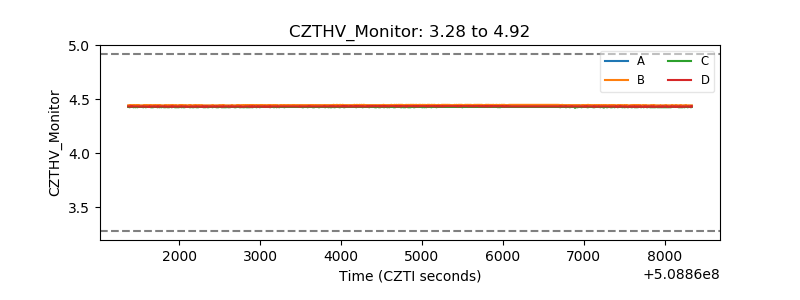 |
| D_VDD | 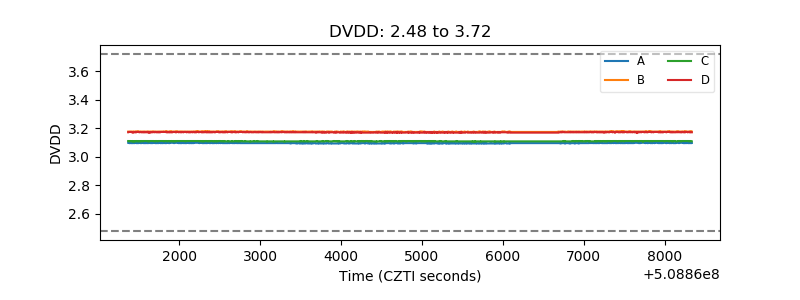 |
| Temperature 1 | 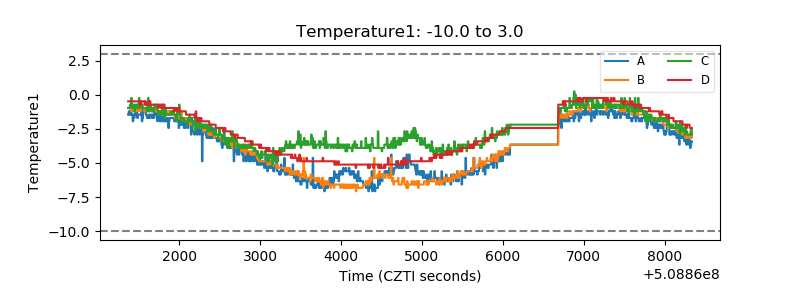 |
| Veto HV Monitor | 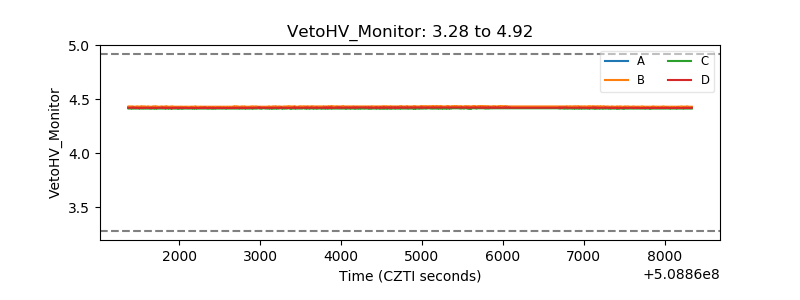 |
| Veto LLD | 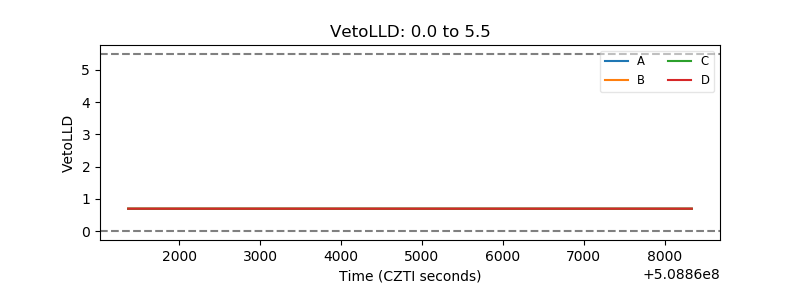 |
| Alpha Counter | 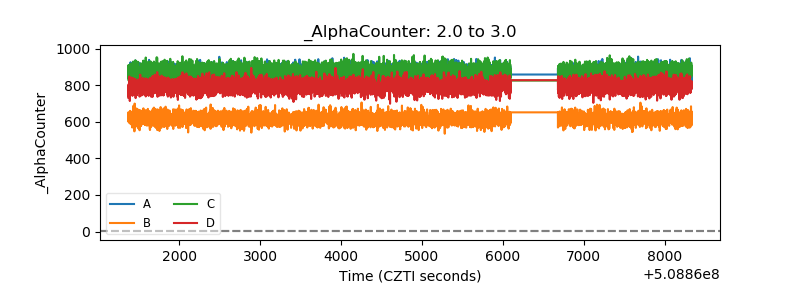 |
| _CPM_Rate | 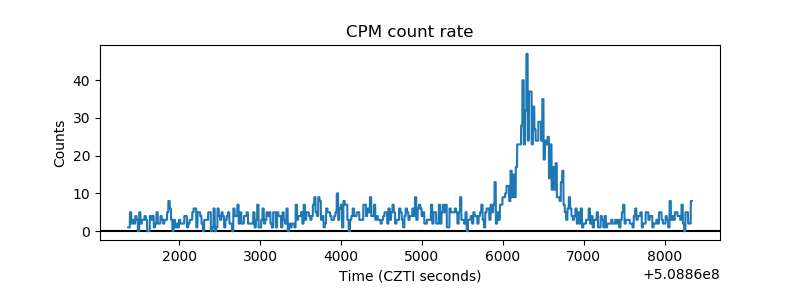 |
| CZT Counter | 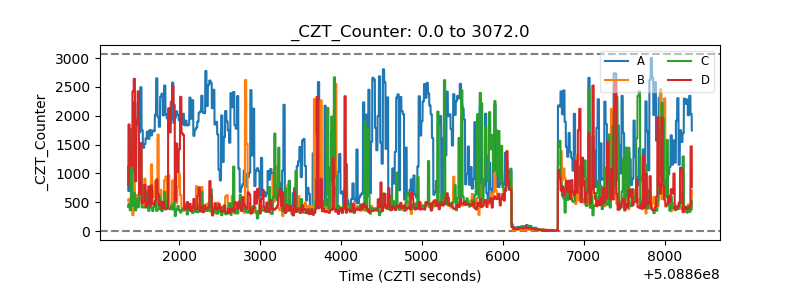 |
| +2.5 Volts monitor | 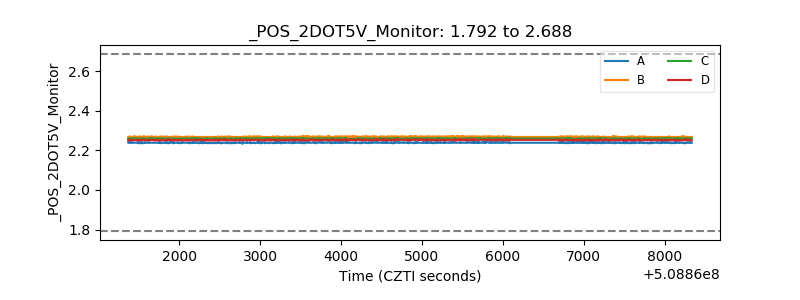 |
| +5 Volts monitor | 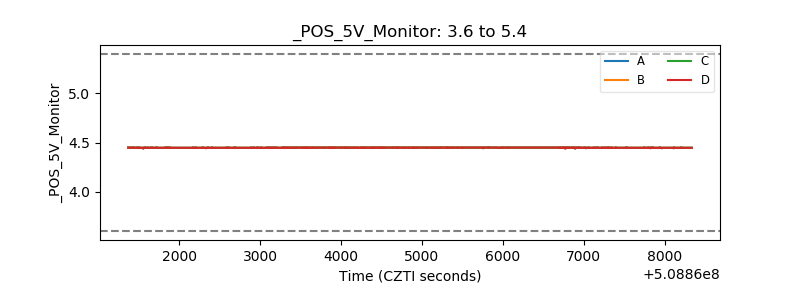 |
| _ROLL_ROT | 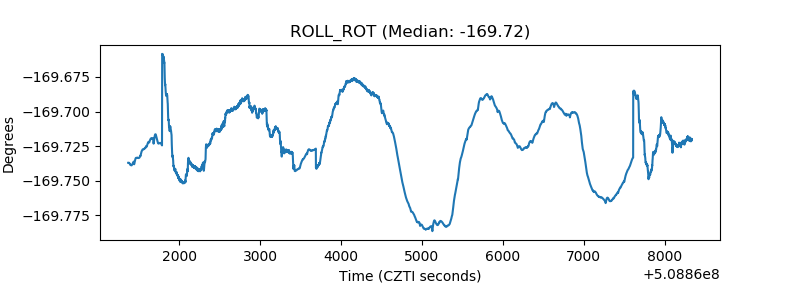 |
| _Roll_DEC | 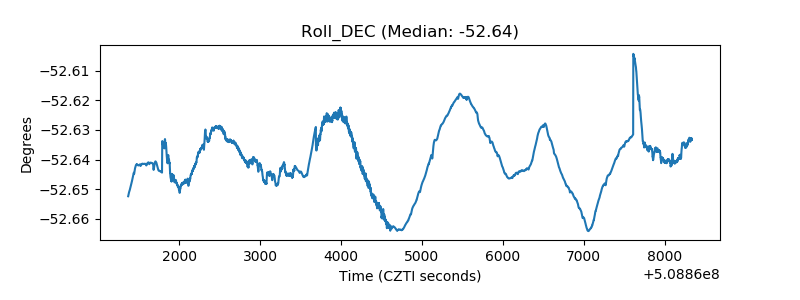 |
| _Roll_RA | 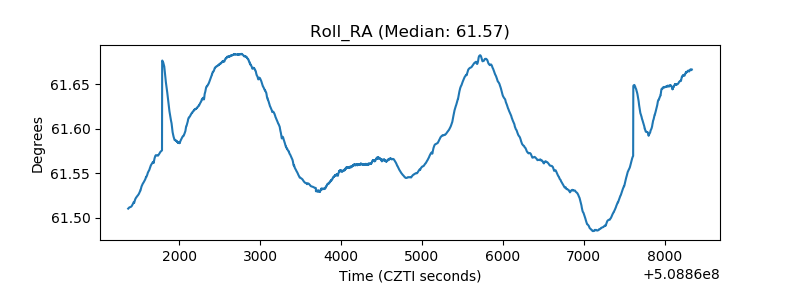 |
| Veto Counter | 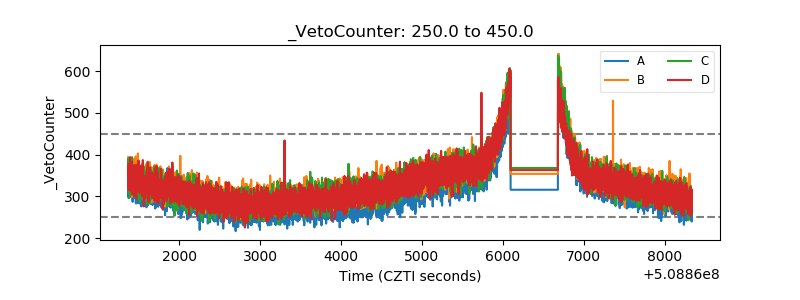 |