| Param | Original file | Final file |
|---|---|---|
| Filename | modeM0/AS1A14_083T04_9000006550_56191cztM0_level2.fits | modeM0/AS1A14_083T04_9000006550_56191cztM0_level2_quad_clean.evt |
| Size (bytes) | 769,302,720 | 99,679,680 |
| Size | 733.7 MB | 95.1 MB |
| Events in quadrant A | 10,124,259 | 545,435 |
| Events in quadrant B | 4,290,291 | 753,450 |
| Events in quadrant C | 8,314,166 | 575,161 |
| Events in quadrant D | 5,164,667 | 619,221 |
| Mode SS | |||
|---|---|---|---|
| Quadrant | BADHDUFLAG | Total packets | Discarded packets |
| A | 0 | 150 | 0 |
| B | 0 | 150 | 0 |
| C | 0 | 150 | 0 |
| D | 0 | 150 | 0 |
| Mode M0 | |||
|---|---|---|---|
| Quadrant | BADHDUFLAG | Total packets | Discarded packets |
| A | 0 | 35358 | 0 |
| B | 0 | 18255 | 1 |
| C | 0 | 29982 | 0 |
| D | 0 | 20719 | 0 |
| Quadrant | Total seconds | Saturated seconds | Saturation percentage |
|---|---|---|---|
| A | 7542 | 2041 | 27.061787% |
| B | 7541 | 195 | 2.585864% |
| C | 7541 | 1444 | 19.148654% |
| D | 7541 | 306 | 4.057817% |
Noise dominated data is calculated using 1-second bins in cleaned event files. If a bin has >2000 counts, and if more than 50% of those come from <1% of pixels, then it is considered to be noise-dominated and hence unusable.
| Quadrant | # 1 sec bins | Bins with >0 counts | Bins with >2000 counts | High rate bins dominated by noise | Noise dominated (total time) | Noise dominated (detector-on time) | Marked lightcurve |
|---|---|---|---|---|---|---|---|
| A | 7541 | 7541 | 1807 | 1807 | 23.96% | 23.96% | 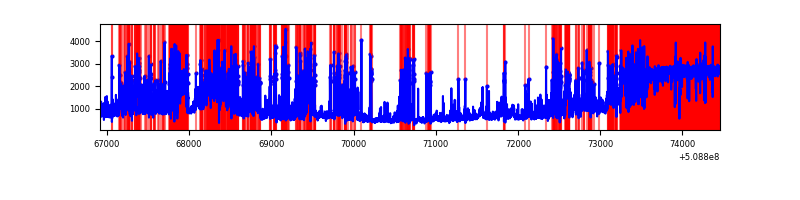 |
| B | 7541 | 7541 | 97 | 97 | 1.29% | 1.29% | 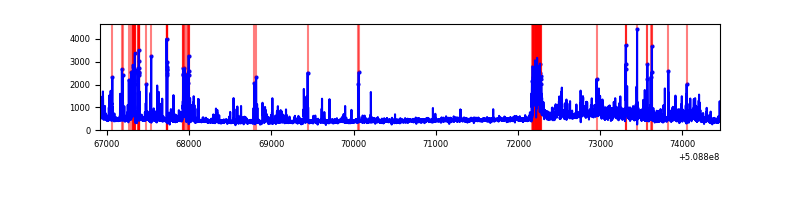 |
| C | 7541 | 7541 | 1231 | 1231 | 16.32% | 16.32% | 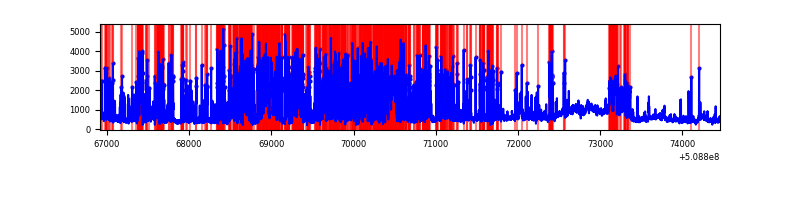 |
| D | 7540 | 7540 | 292 | 292 | 3.87% | 3.87% | 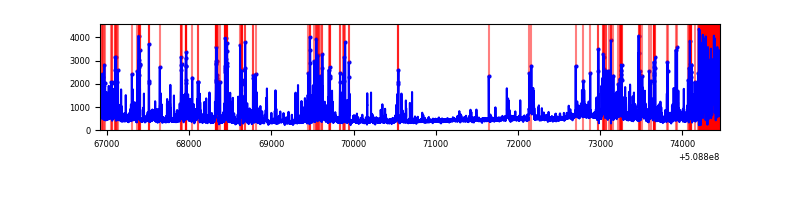 |
Top three noisy pixels from each quadrant. If the there are fewer than three noisy pixels in the level2.evt file, extra rows are filled as -1
| Pixel properties | Quadrant properties | ||||||
|---|---|---|---|---|---|---|---|
| Quadrant | DetID | PixID | Counts | Sigma | Mean | Median | Sigma |
| A | 15 | 32 | 3731926 | 21472.54 | 694 | 676 | 173.8 |
| A | 8 | 176 | 1792224 | 10309.97 | 694 | 676 | 173.8 |
| A | 7 | 64 | 928358 | 5338.61 | 694 | 676 | 173.8 |
| B | 5 | 185 | 291462 | 1733.78 | 792 | 765 | 167.7 |
| B | 10 | 247 | 199058 | 1182.66 | 792 | 765 | 167.7 |
| B | 0 | 213 | 142005 | 842.38 | 792 | 765 | 167.7 |
| C | 12 | 254 | 4463411 | 22835.08 | 710 | 702 | 195.4 |
| C | 9 | 38 | 808943 | 4135.66 | 710 | 702 | 195.4 |
| C | 12 | 252 | 119089 | 605.77 | 710 | 702 | 195.4 |
| D | 6 | 239 | 875507 | 4069.71 | 758 | 725 | 214.9 |
| D | 2 | 249 | 564120 | 2621.06 | 758 | 725 | 214.9 |
| D | 13 | 153 | 249396 | 1156.88 | 758 | 725 | 214.9 |
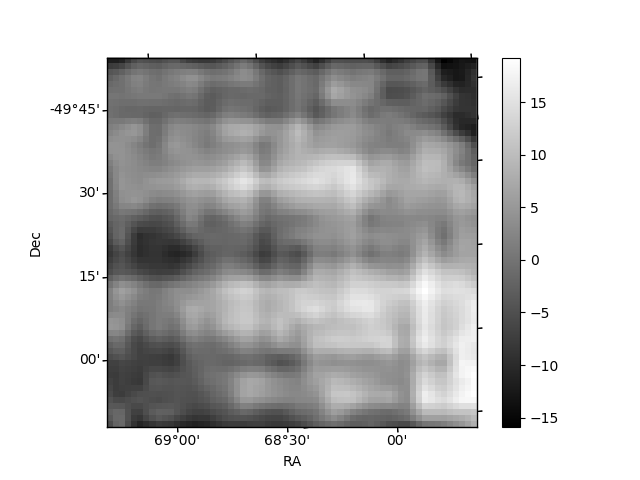
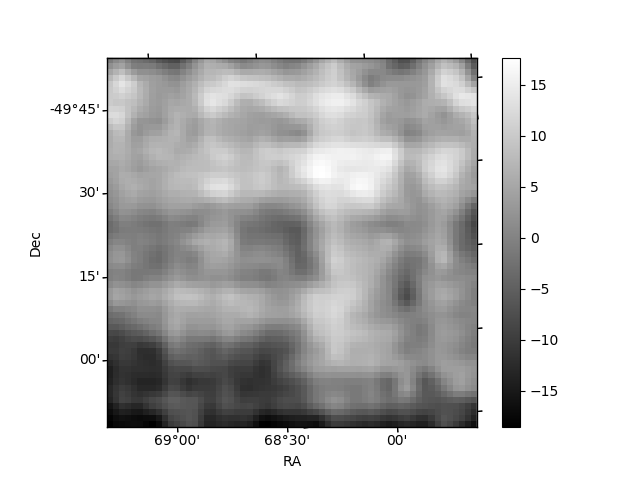
Histogram calculated using DETX and DETY for each event in the final _common_clean file
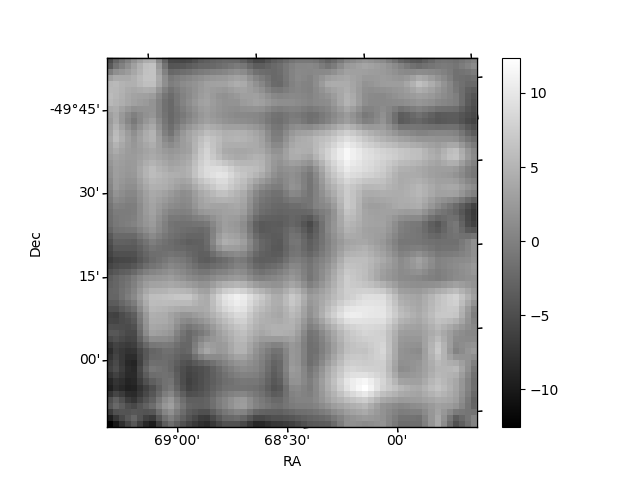
| Quadrant A | 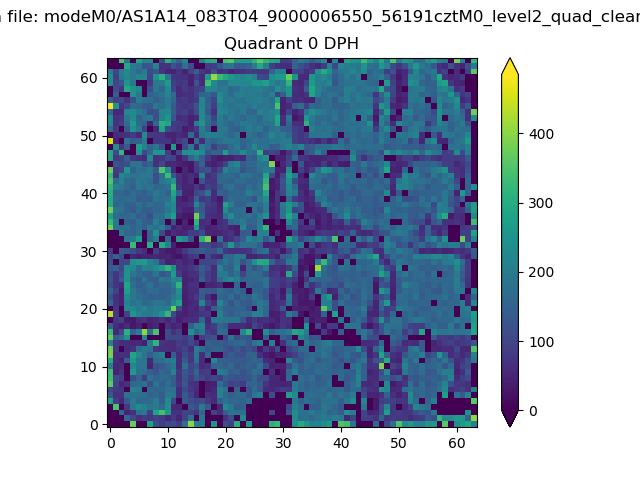 |
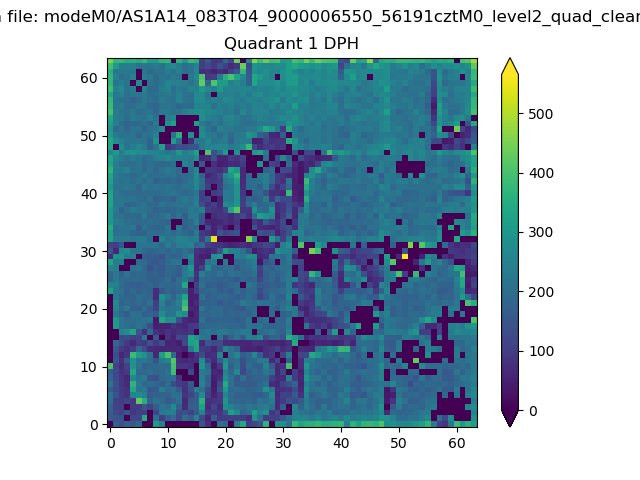 |
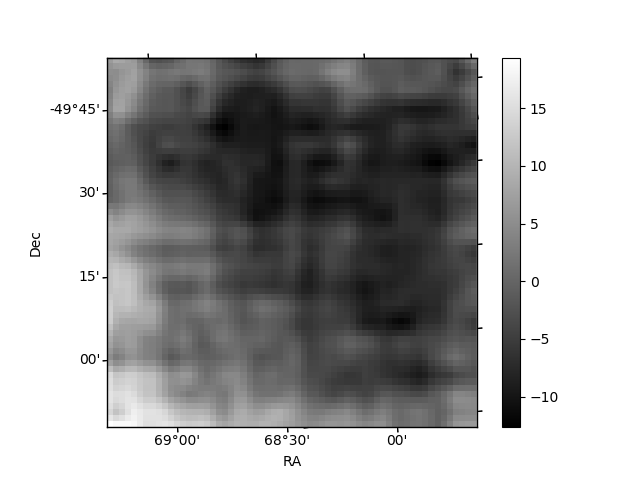
Quadrant B |
|---|---|---|---|
| Quadrant D | 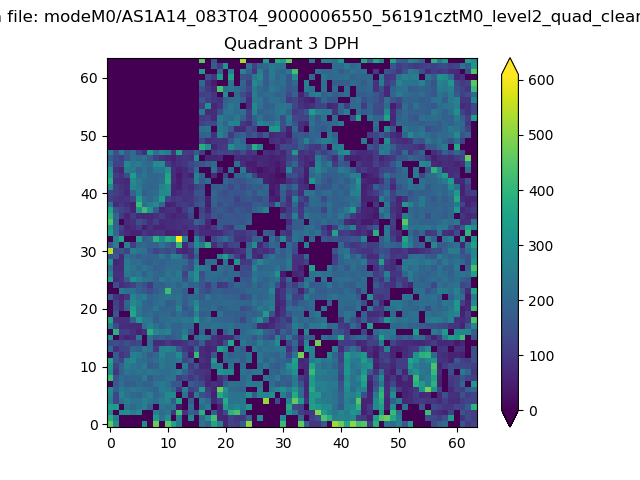 |
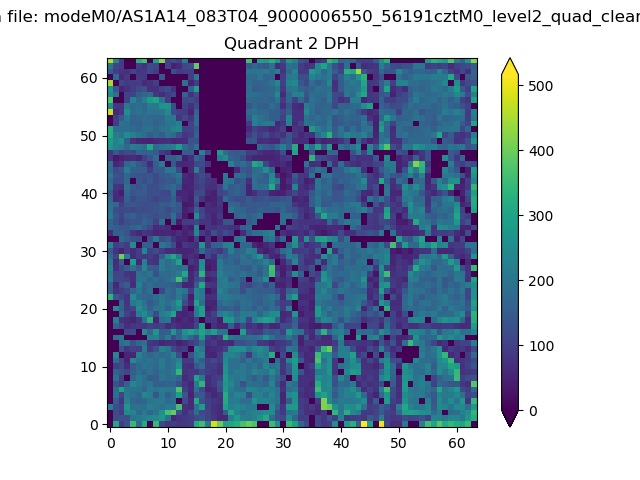 |
Quadrant C |
| Plot type | Count rate plots | Images |
|---|---|---|
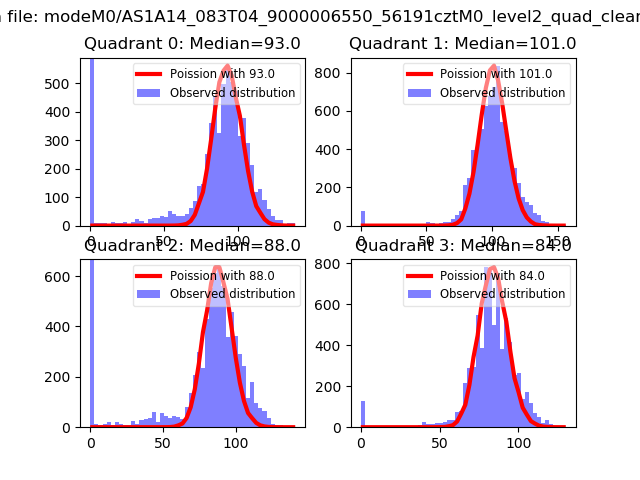
| Comparison with Poisson distribution Blue bars denote a histogram of data divided into 1 sec bins. Red curve is a Poisson curve with rate = median count rate of data. |
 |
 |
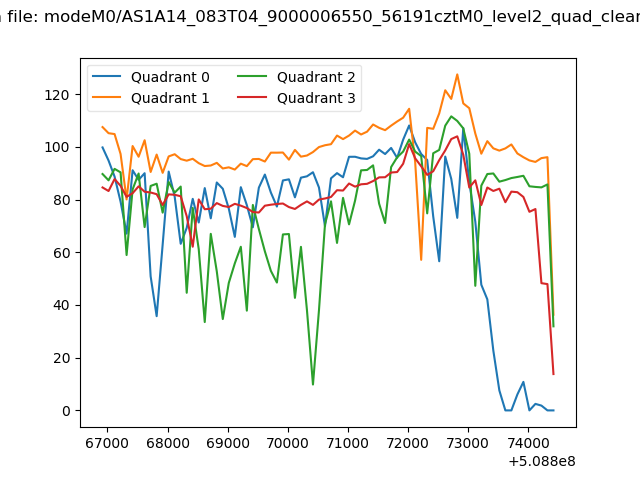
| Quadrant-wise count rates Data is divided into 100 sec bins |
 |
|
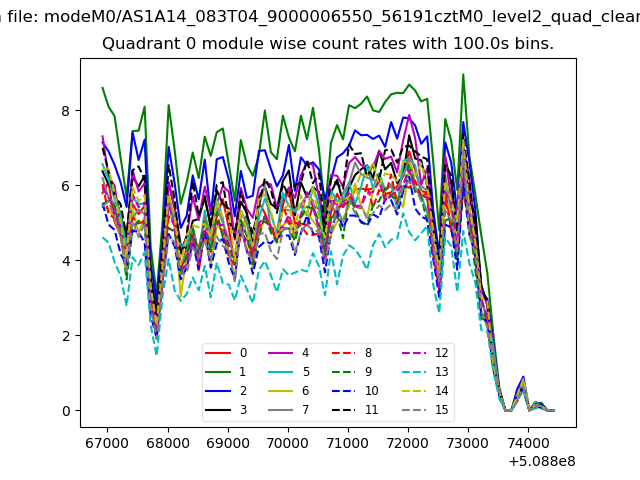
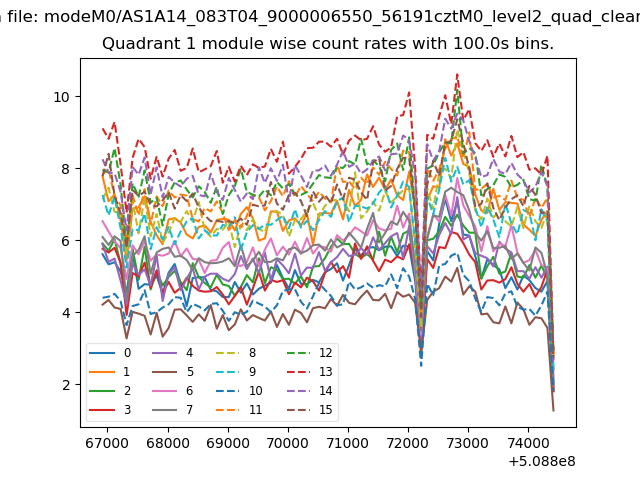
| Module-wise count rates for Quadrant A Data is divided into 100 sec bins |
 |
 |
| Module-wise count rates for Quadrant B Data is divided into 100 sec bins |
 |
 |
| Module-wise count rates for Quadrant C Data is divided into 100 sec bins |
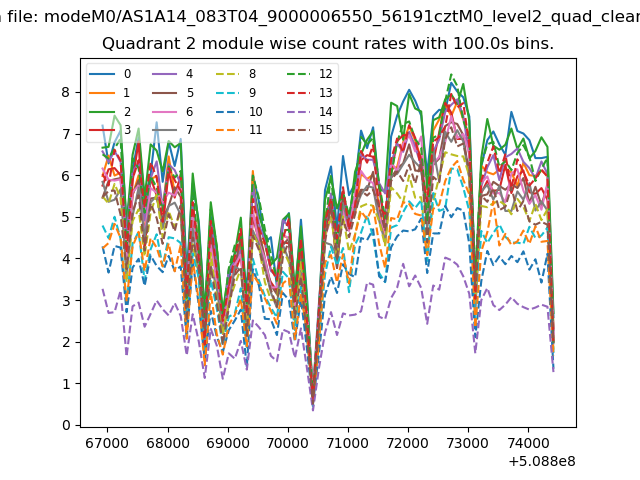 |
 |
| Module-wise count rates for Quadrant D Data is divided into 100 sec bins |
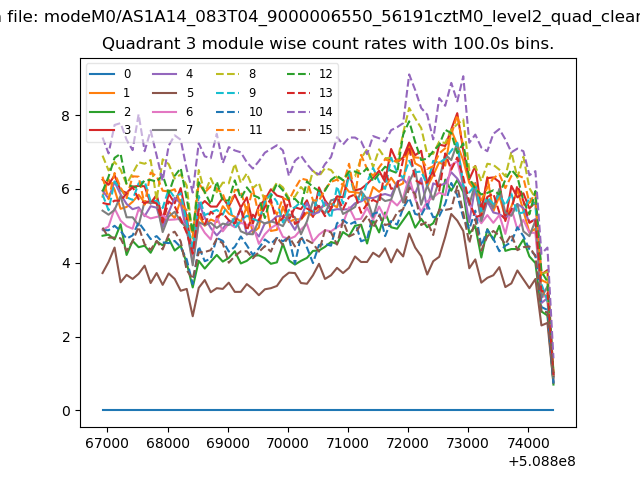 |
 |
| Parameter | Plot |
|---|---|
| CZT HV Monitor | 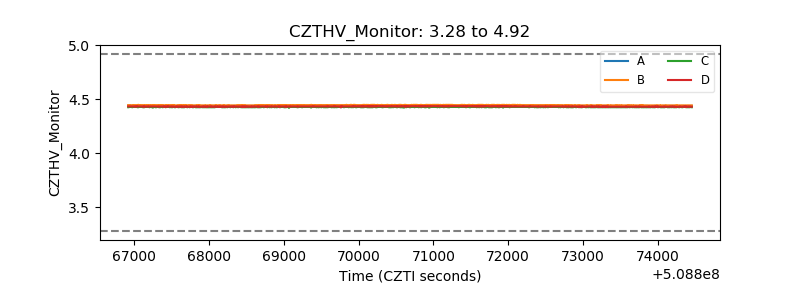 |
| D_VDD | 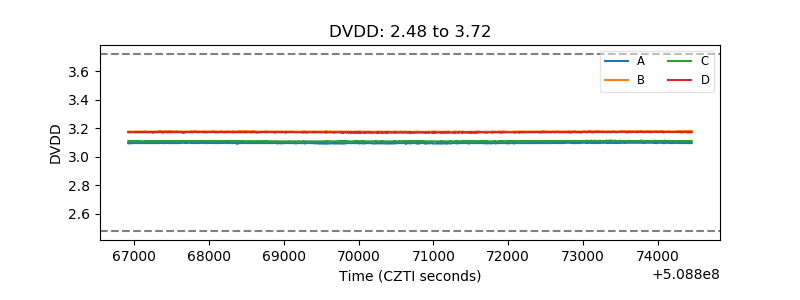 |
| Temperature 1 | 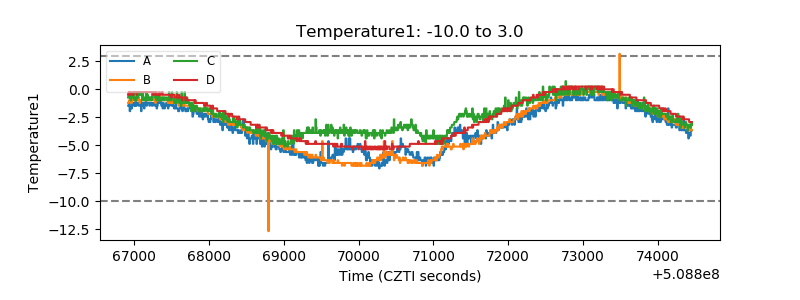 |
| Veto HV Monitor | 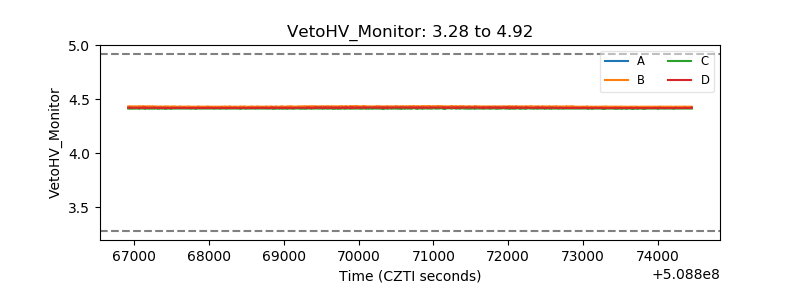 |
| Veto LLD | 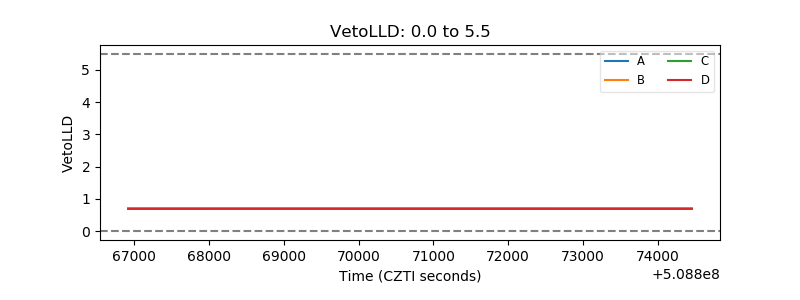 |
| Alpha Counter | 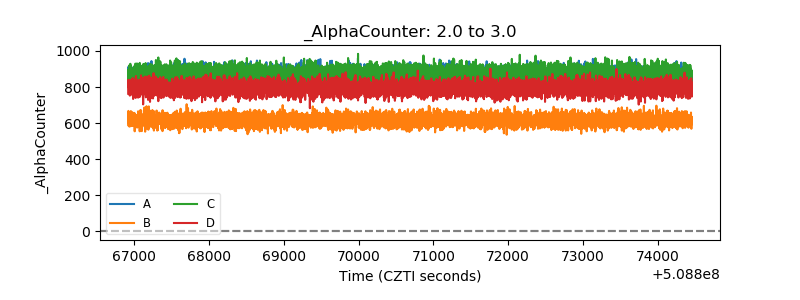 |
| _CPM_Rate | 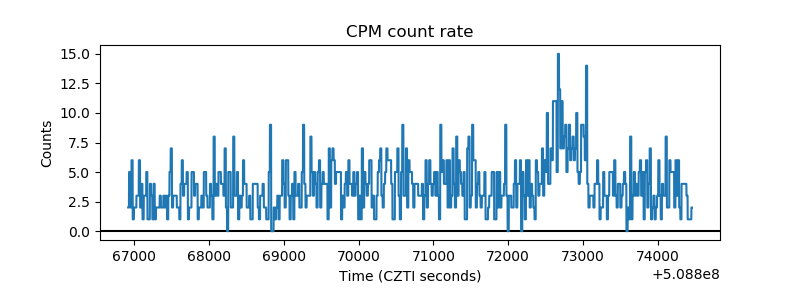 |
| CZT Counter | 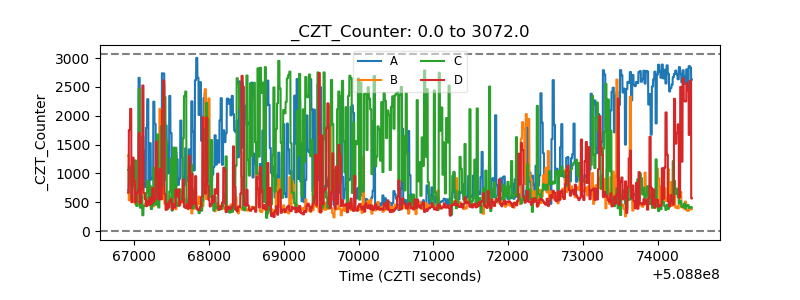 |
| +2.5 Volts monitor |  |
| +5 Volts monitor |  |
| _ROLL_ROT | 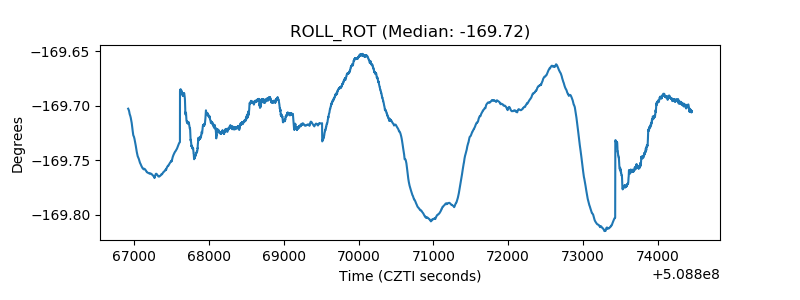 |
| _Roll_DEC | 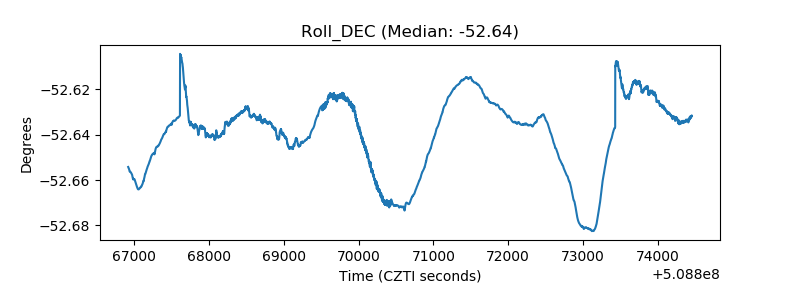 |
| _Roll_RA | 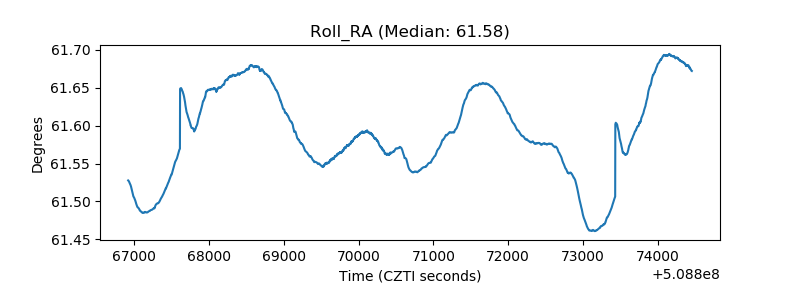 |
| Veto Counter | 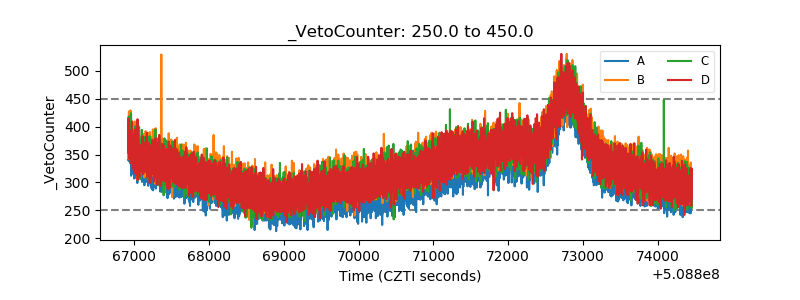 |