| Param | Original file | Final file |
|---|---|---|
| Filename | modeM0/AS1A14_083T04_9000006550_56192cztM0_level2.fits | modeM0/AS1A14_083T04_9000006550_56192cztM0_level2_quad_clean.evt |
| Size (bytes) | 827,760,960 | 90,904,320 |
| Size | 789.4 MB | 86.7 MB |
| Events in quadrant A | 12,637,479 | 432,698 |
| Events in quadrant B | 4,835,012 | 684,203 |
| Events in quadrant C | 5,474,695 | 575,618 |
| Events in quadrant D | 7,078,612 | 506,882 |
| Mode SS | |||
|---|---|---|---|
| Quadrant | BADHDUFLAG | Total packets | Discarded packets |
| A | 0 | 158 | 0 |
| B | 0 | 158 | 0 |
| C | 0 | 158 | 0 |
| D | 0 | 158 | 0 |
| Mode M0 | |||
|---|---|---|---|
| Quadrant | BADHDUFLAG | Total packets | Discarded packets |
| A | 0 | 42992 | 0 |
| B | 0 | 19982 | 0 |
| C | 0 | 21944 | 0 |
| D | 0 | 26648 | 0 |
| Quadrant | Total seconds | Saturated seconds | Saturation percentage |
|---|---|---|---|
| A | 7948 | 3294 | 41.444389% |
| B | 7948 | 239 | 3.007046% |
| C | 7949 | 613 | 7.711662% |
| D | 7949 | 819 | 10.303183% |
Noise dominated data is calculated using 1-second bins in cleaned event files. If a bin has >2000 counts, and if more than 50% of those come from <1% of pixels, then it is considered to be noise-dominated and hence unusable.
| Quadrant | # 1 sec bins | Bins with >0 counts | Bins with >2000 counts | High rate bins dominated by noise | Noise dominated (total time) | Noise dominated (detector-on time) | Marked lightcurve |
|---|---|---|---|---|---|---|---|
| A | 8234 | 8232 | 2881 | 2881 | 34.99% | 35.00% | 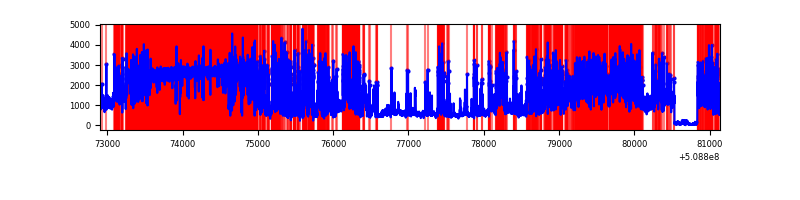 |
| B | 8234 | 8234 | 96 | 96 | 1.17% | 1.17% | 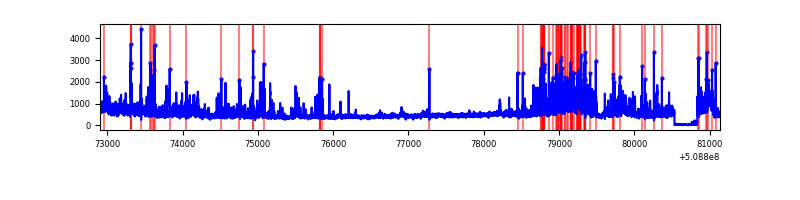 |
| C | 8235 | 8055 | 409 | 409 | 4.97% | 5.08% | 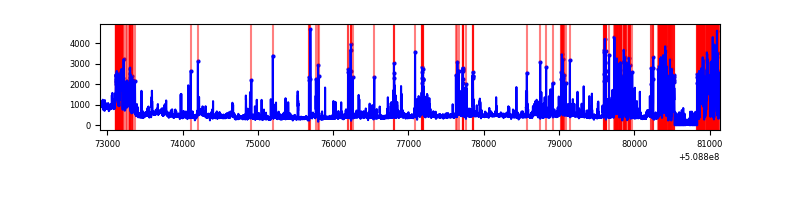 |
| D | 8235 | 8203 | 767 | 767 | 9.31% | 9.35% | 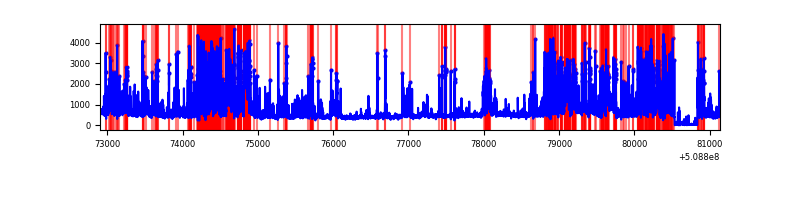 |
Top three noisy pixels from each quadrant. If the there are fewer than three noisy pixels in the level2.evt file, extra rows are filled as -1
| Pixel properties | Quadrant properties | ||||||
|---|---|---|---|---|---|---|---|
| Quadrant | DetID | PixID | Counts | Sigma | Mean | Median | Sigma |
| A | 15 | 32 | 5996048 | 36292.06 | 662 | 647 | 165.2 |
| A | 7 | 64 | 1734635 | 10496.38 | 662 | 647 | 165.2 |
| A | 8 | 176 | 1487394 | 8999.75 | 662 | 647 | 165.2 |
| B | 4 | 171 | 326874 | 1856.03 | 824 | 796 | 175.7 |
| B | 0 | 171 | 279269 | 1585.06 | 824 | 796 | 175.7 |
| B | 0 | 213 | 247823 | 1406.07 | 824 | 796 | 175.7 |
| C | 12 | 254 | 1484610 | 6849.22 | 774 | 765 | 216.6 |
| C | 9 | 38 | 544712 | 2510.78 | 774 | 765 | 216.6 |
| C | 12 | 252 | 283952 | 1307.15 | 774 | 765 | 216.6 |
| D | 6 | 239 | 1409821 | 6481.16 | 768 | 735 | 217.4 |
| D | 8 | 240 | 818395 | 3760.87 | 768 | 735 | 217.4 |
| D | 11 | 129 | 409467 | 1879.98 | 768 | 735 | 217.4 |
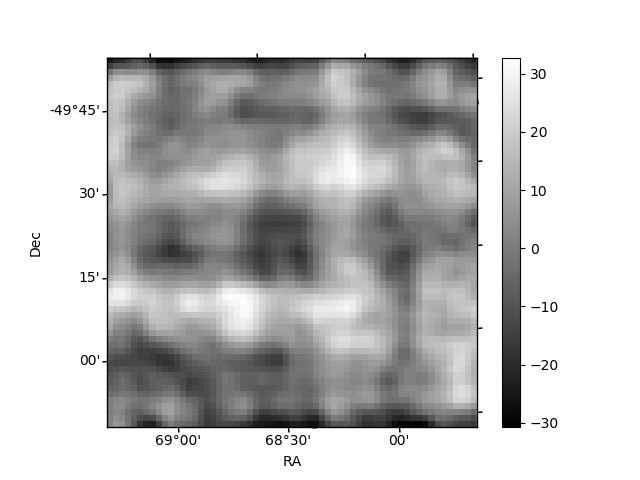
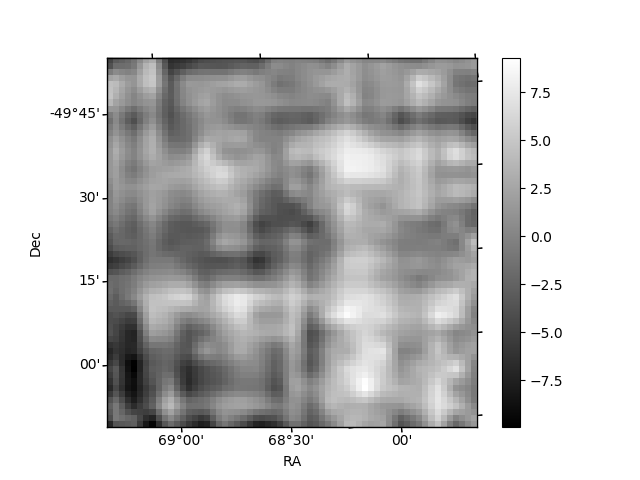
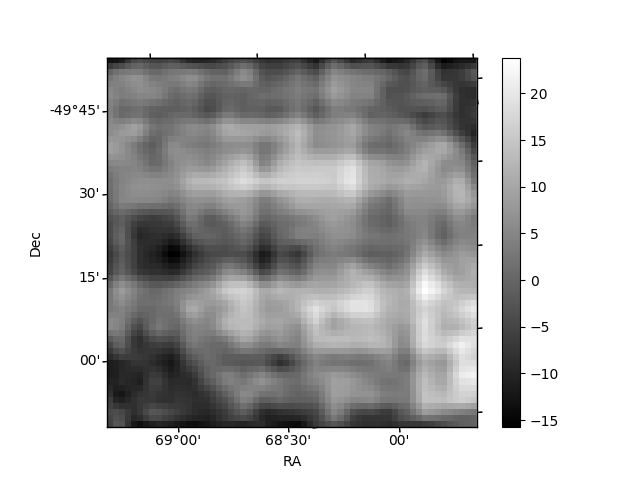
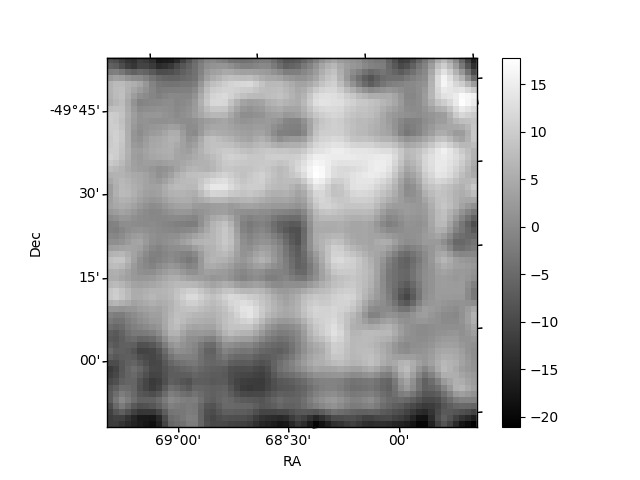
Histogram calculated using DETX and DETY for each event in the final _common_clean file
| Quadrant A | 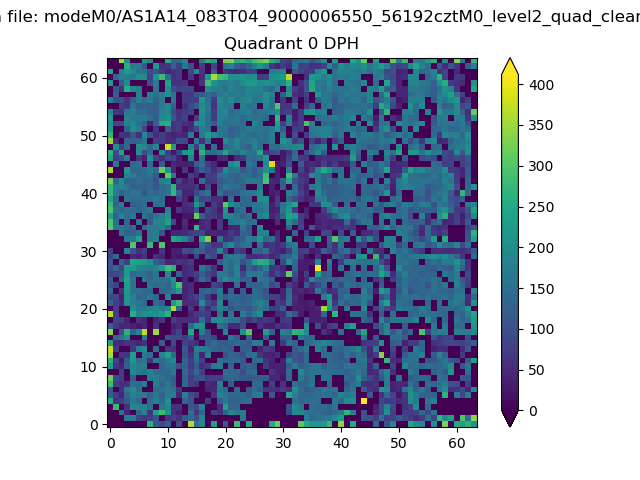 |
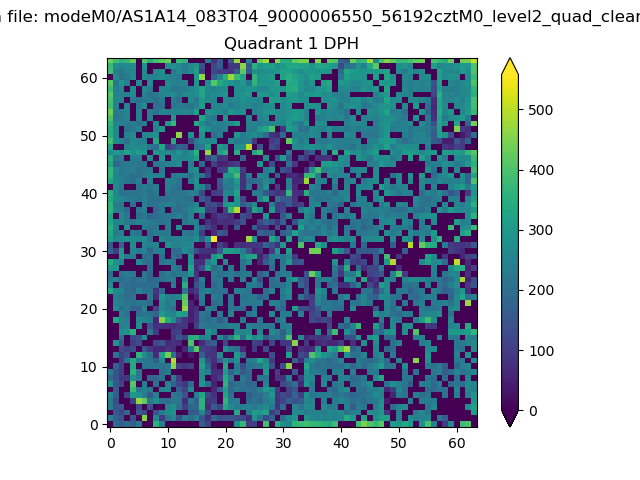 |
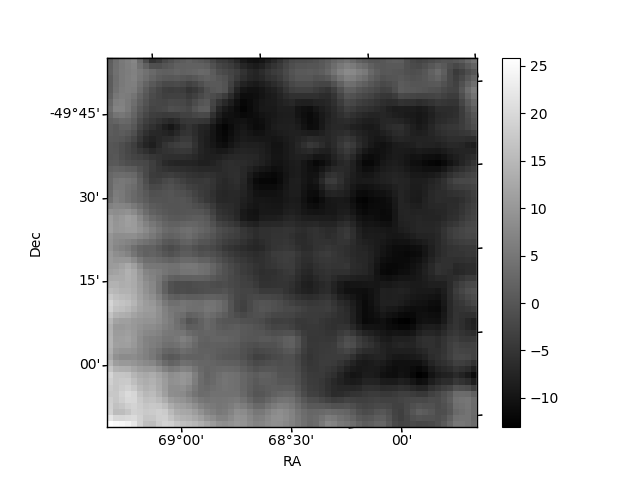
Quadrant B |
|---|---|---|---|
| Quadrant D | 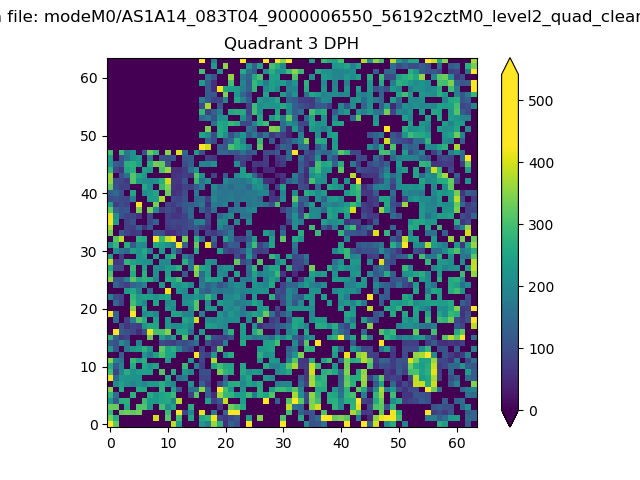 |
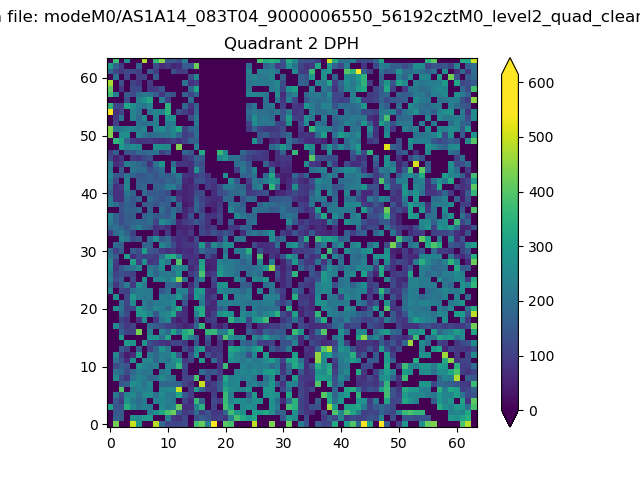 |
Quadrant C |
| Plot type | Count rate plots | Images |
|---|---|---|
| Comparison with Poisson distribution Blue bars denote a histogram of data divided into 1 sec bins. Red curve is a Poisson curve with rate = median count rate of data. |
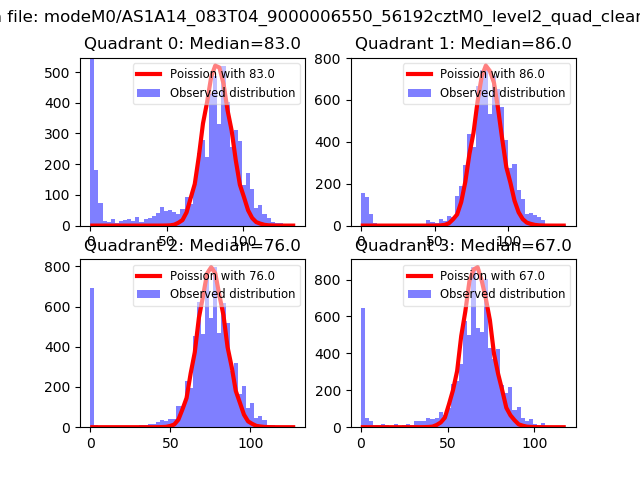 |
 |
| Quadrant-wise count rates Data is divided into 100 sec bins |
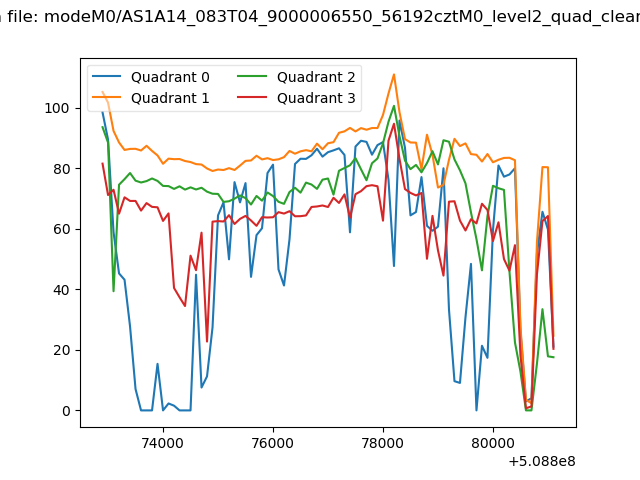 |
|
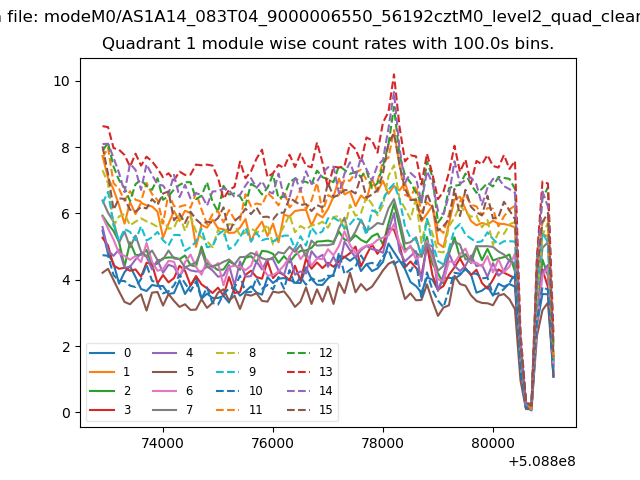
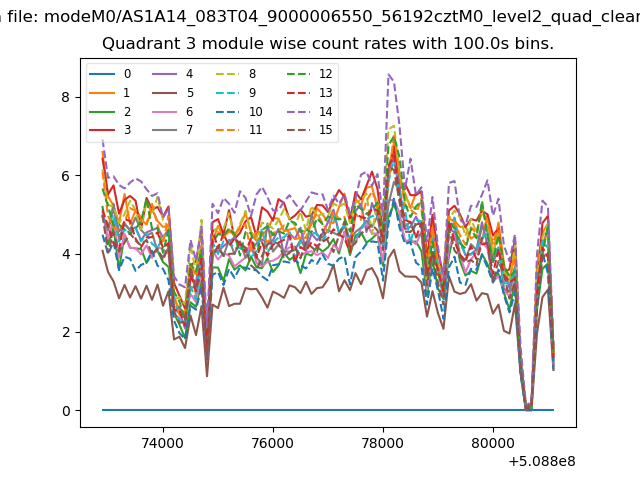
| Module-wise count rates for Quadrant A Data is divided into 100 sec bins |
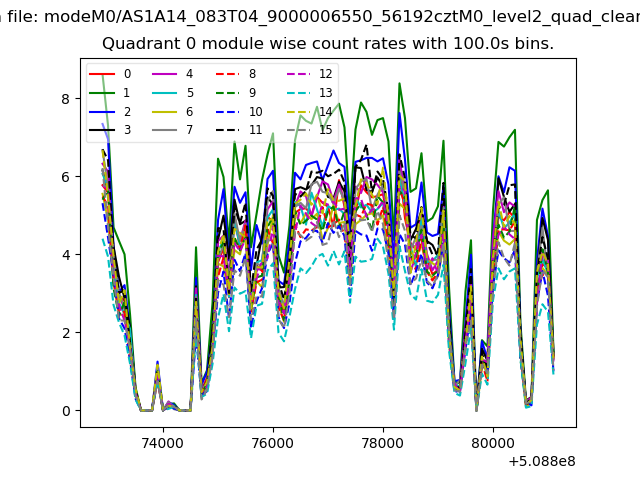 |
 |
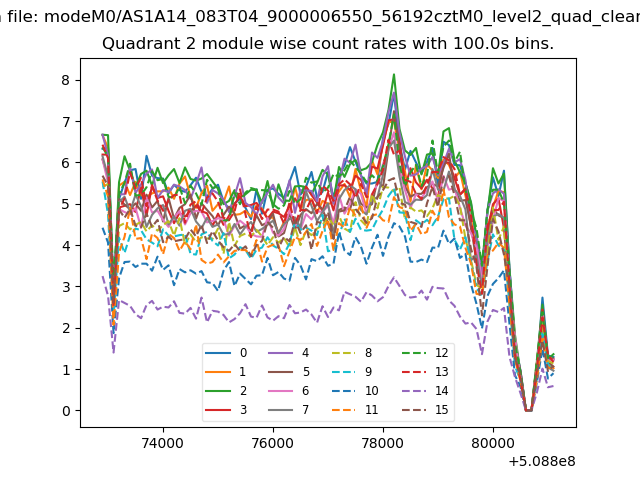
| Module-wise count rates for Quadrant B Data is divided into 100 sec bins |
 |
 |
| Module-wise count rates for Quadrant C Data is divided into 100 sec bins |
 |
 |
| Module-wise count rates for Quadrant D Data is divided into 100 sec bins |
 |
 |
| Parameter | Plot |
|---|---|
| CZT HV Monitor |  |
| D_VDD | 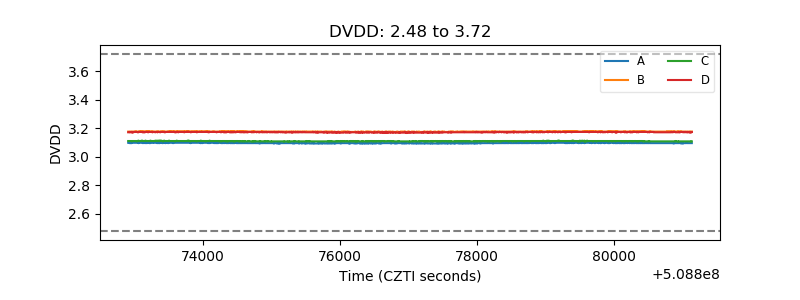 |
| Temperature 1 | 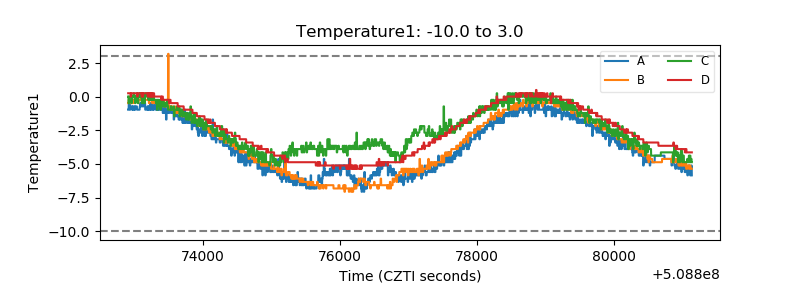 |
| Veto HV Monitor | 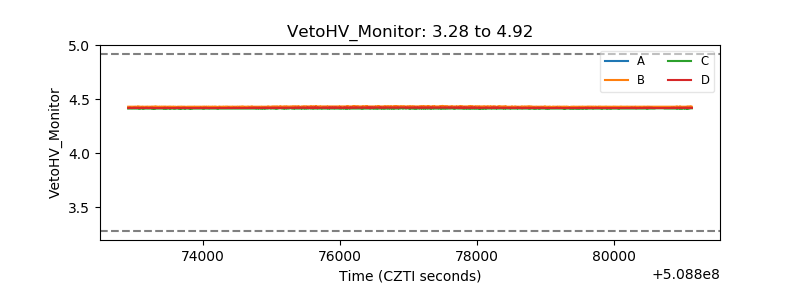 |
| Veto LLD | 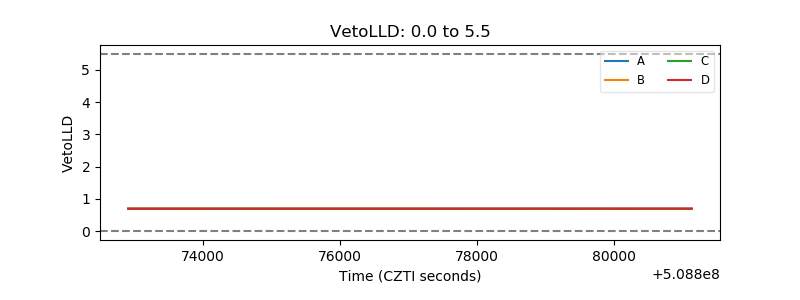 |
| Alpha Counter | 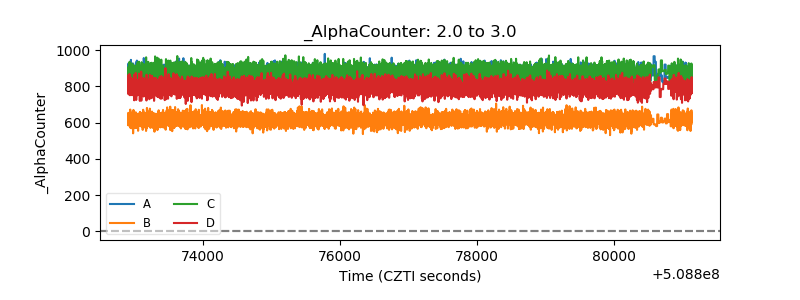 |
| _CPM_Rate | 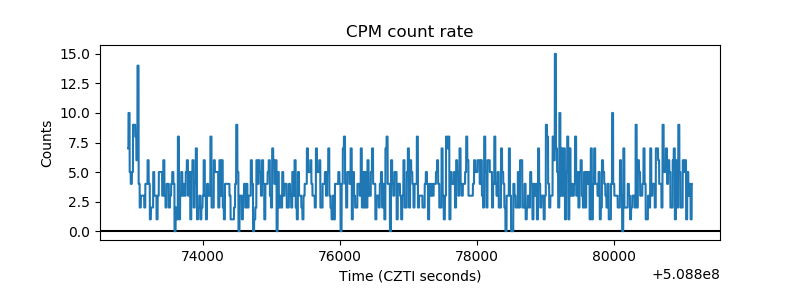 |
| CZT Counter | 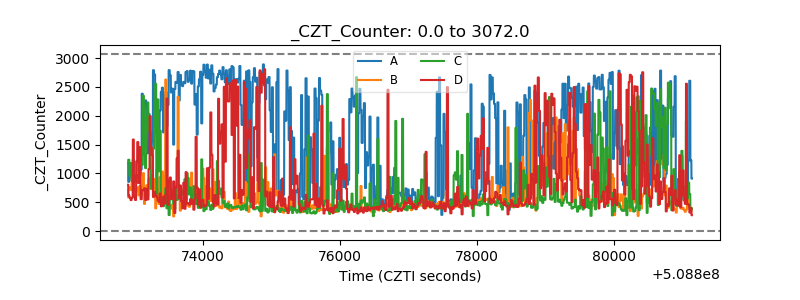 |
| +2.5 Volts monitor | 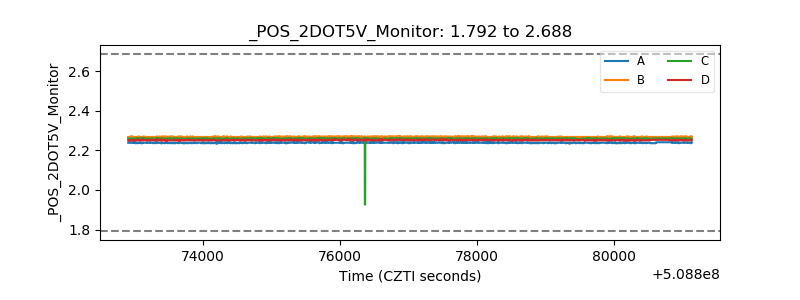 |
| +5 Volts monitor | 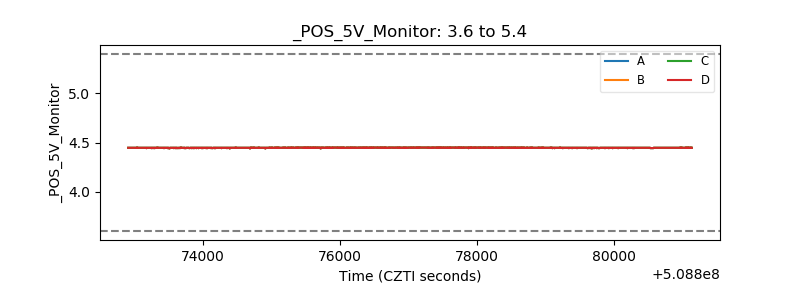 |
| _ROLL_ROT | 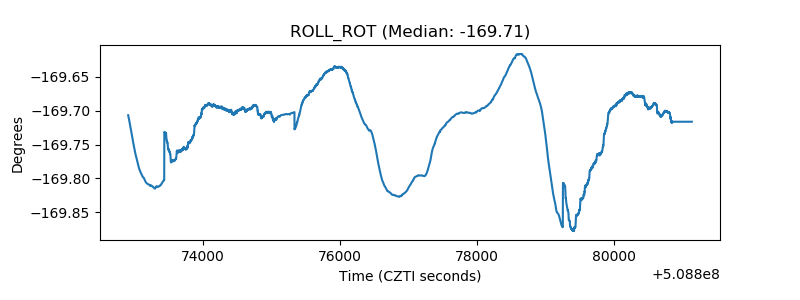 |
| _Roll_DEC | 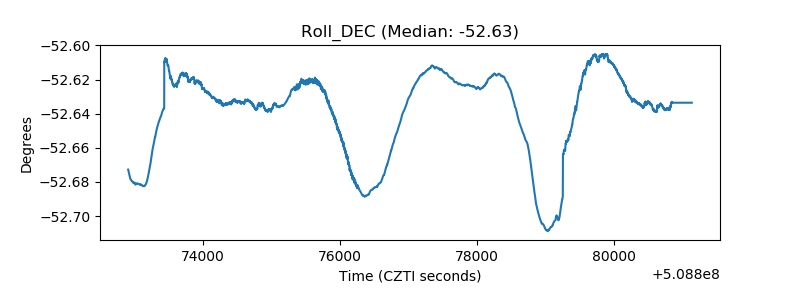 |
| _Roll_RA | 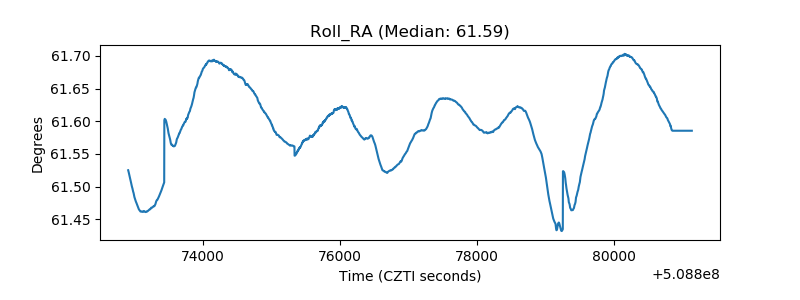 |
| Veto Counter | 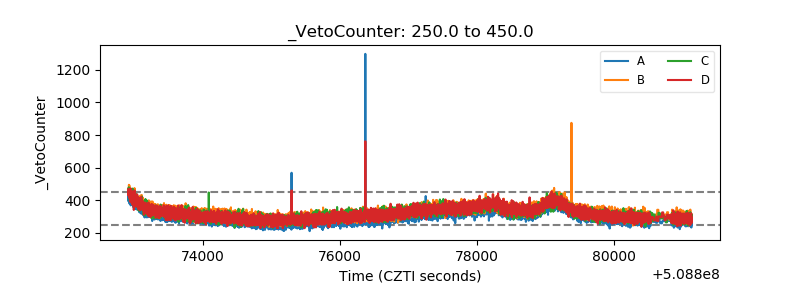 |