| Param | Original file | Final file |
|---|---|---|
| Filename | modeM0/AS1A14_083T04_9000006550_56193cztM0_level2.fits | modeM0/AS1A14_083T04_9000006550_56193cztM0_level2_quad_clean.evt |
| Size (bytes) | 876,202,560 | 80,542,080 |
| Size | 835.6 MB | 76.8 MB |
| Events in quadrant A | 12,533,876 | 374,399 |
| Events in quadrant B | 4,679,643 | 635,519 |
| Events in quadrant C | 8,338,297 | 429,494 |
| Events in quadrant D | 6,294,966 | 470,233 |
| Mode SS | |||
|---|---|---|---|
| Quadrant | BADHDUFLAG | Total packets | Discarded packets |
| A | 0 | 152 | 0 |
| B | 0 | 152 | 0 |
| C | 0 | 152 | 0 |
| D | 0 | 152 | 0 |
| Mode M0 | |||
|---|---|---|---|
| Quadrant | BADHDUFLAG | Total packets | Discarded packets |
| A | 0 | 42431 | 0 |
| B | 0 | 19189 | 0 |
| C | 0 | 30175 | 0 |
| D | 0 | 24112 | 1 |
| Quadrant | Total seconds | Saturated seconds | Saturation percentage |
|---|---|---|---|
| A | 7593 | 3326 | 43.803503% |
| B | 7594 | 206 | 2.712668% |
| C | 7594 | 1881 | 24.769555% |
| D | 7593 | 623 | 8.204926% |
Noise dominated data is calculated using 1-second bins in cleaned event files. If a bin has >2000 counts, and if more than 50% of those come from <1% of pixels, then it is considered to be noise-dominated and hence unusable.
| Quadrant | # 1 sec bins | Bins with >0 counts | Bins with >2000 counts | High rate bins dominated by noise | Noise dominated (total time) | Noise dominated (detector-on time) | Marked lightcurve |
|---|---|---|---|---|---|---|---|
| A | 7871 | 7869 | 2916 | 2916 | 37.05% | 37.06% | 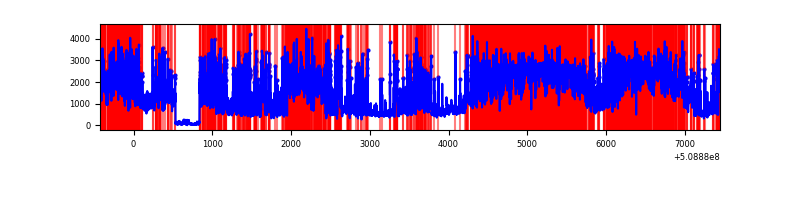 |
| B | 7872 | 7872 | 97 | 97 | 1.23% | 1.23% | 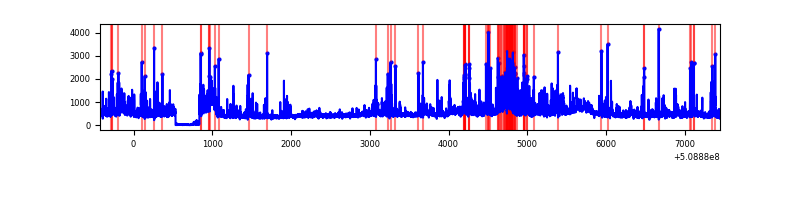 |
| C | 7872 | 7692 | 1431 | 1431 | 18.18% | 18.60% | 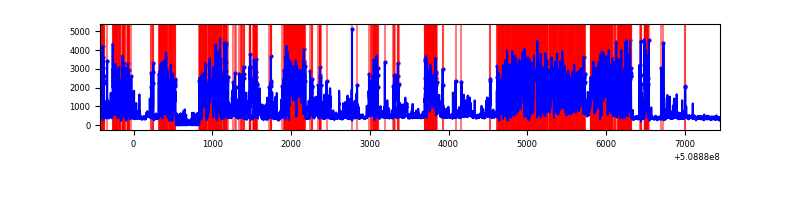 |
| D | 7871 | 7839 | 581 | 581 | 7.38% | 7.41% | 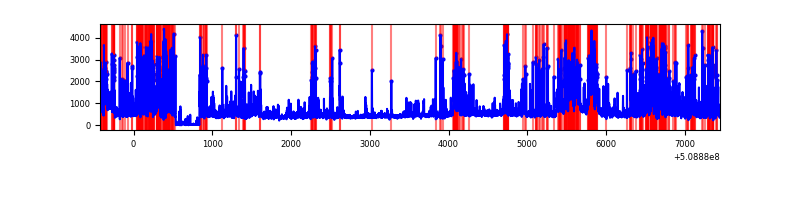 |
Top three noisy pixels from each quadrant. If the there are fewer than three noisy pixels in the level2.evt file, extra rows are filled as -1
| Pixel properties | Quadrant properties | ||||||
|---|---|---|---|---|---|---|---|
| Quadrant | DetID | PixID | Counts | Sigma | Mean | Median | Sigma |
| A | 15 | 32 | 5986574 | 37786.58 | 628 | 611 | 158.4 |
| A | 8 | 176 | 1452698 | 9166.34 | 628 | 611 | 158.4 |
| A | 7 | 64 | 1415138 | 8929.25 | 628 | 611 | 158.4 |
| B | 5 | 185 | 397189 | 2352.4 | 782 | 754 | 168.5 |
| B | 0 | 213 | 375922 | 2226.21 | 782 | 754 | 168.5 |
| B | 0 | 171 | 191518 | 1131.97 | 782 | 754 | 168.5 |
| C | 12 | 254 | 5215560 | 27774.47 | 670 | 664 | 187.8 |
| C | 12 | 252 | 292530 | 1554.47 | 670 | 664 | 187.8 |
| C | 6 | 223 | 50201 | 263.83 | 670 | 664 | 187.8 |
| D | 6 | 239 | 1007726 | 4847.85 | 732 | 699 | 207.7 |
| D | 11 | 129 | 502495 | 2415.66 | 732 | 699 | 207.7 |
| D | 8 | 129 | 330810 | 1589.16 | 732 | 699 | 207.7 |
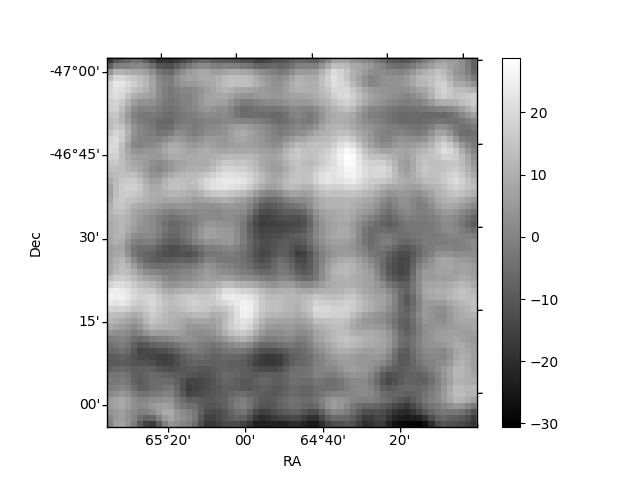
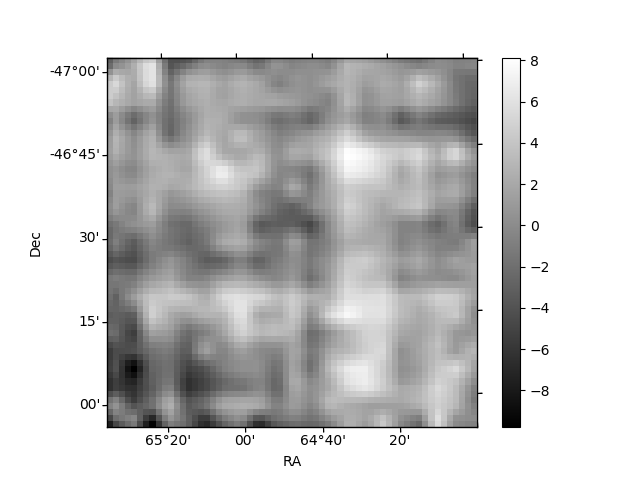
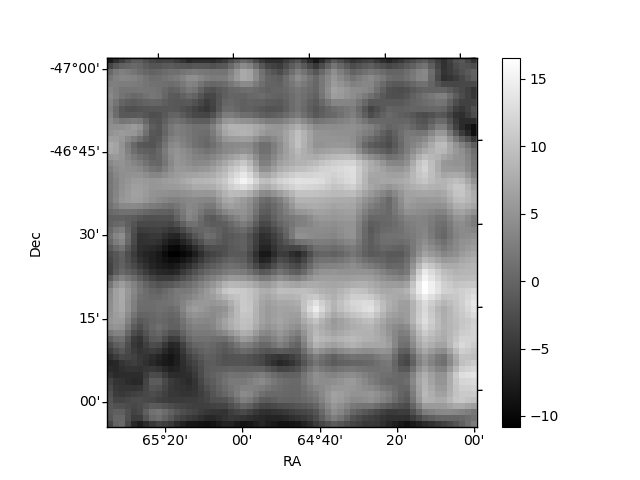
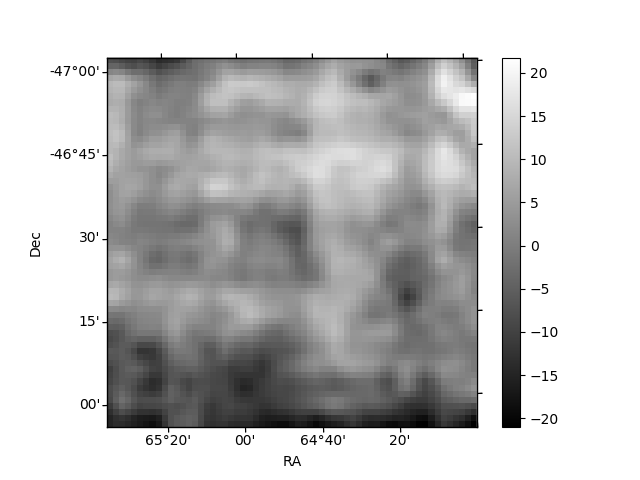
Histogram calculated using DETX and DETY for each event in the final _common_clean file
| Quadrant A | 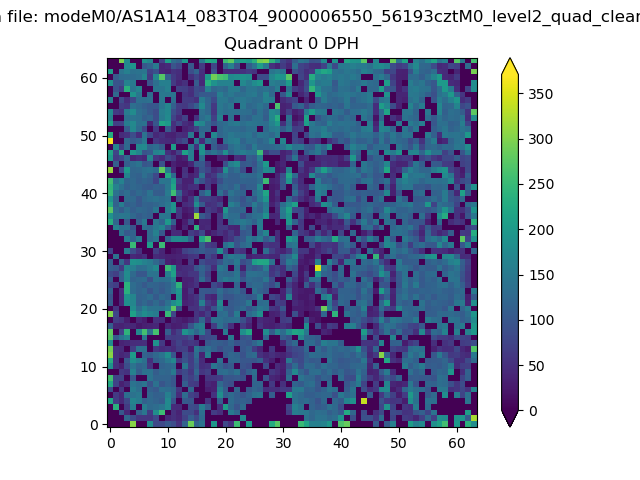 |
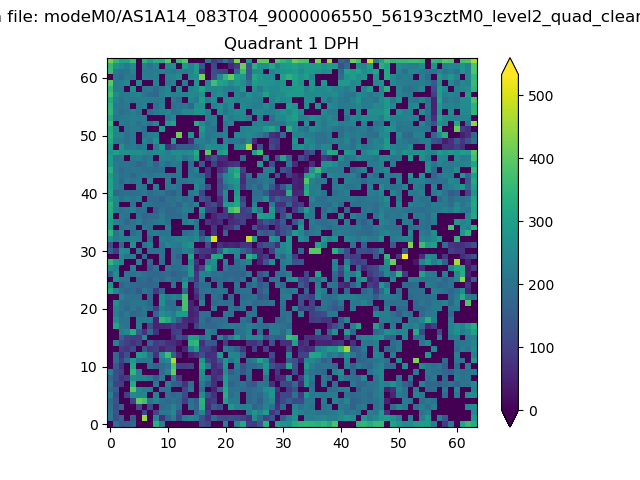 |
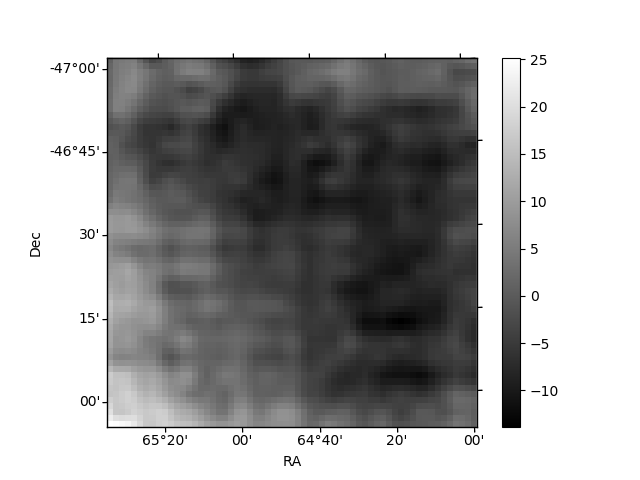
Quadrant B |
|---|---|---|---|
| Quadrant D | 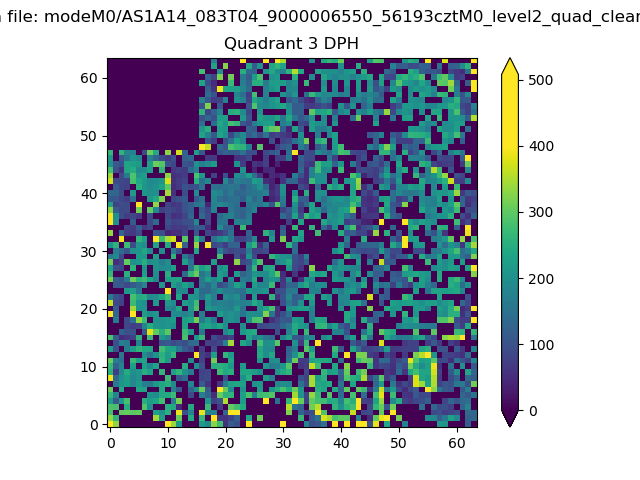 |
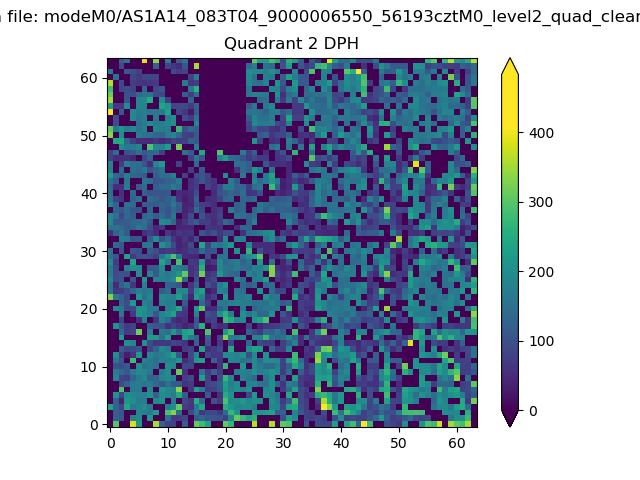 |
Quadrant C |
| Plot type | Count rate plots | Images |
|---|---|---|
| Comparison with Poisson distribution Blue bars denote a histogram of data divided into 1 sec bins. Red curve is a Poisson curve with rate = median count rate of data. |
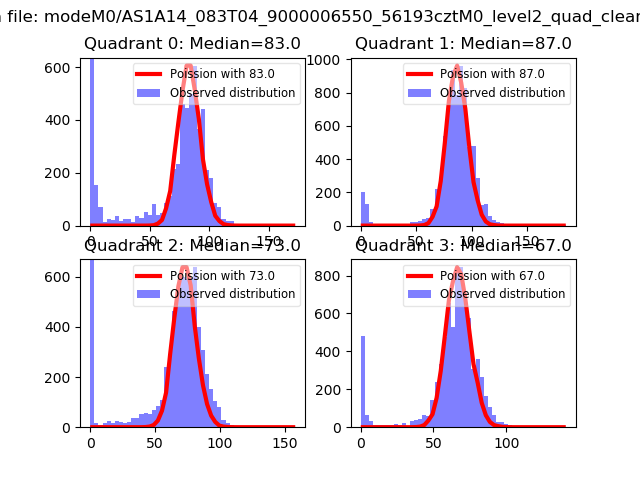 |
 |
| Quadrant-wise count rates Data is divided into 100 sec bins |
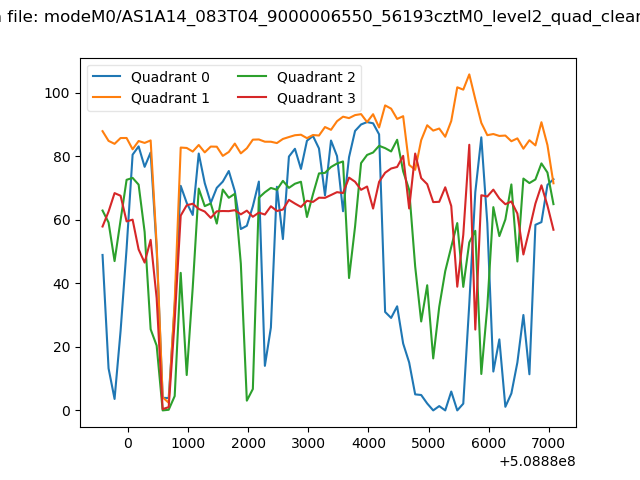 |
|
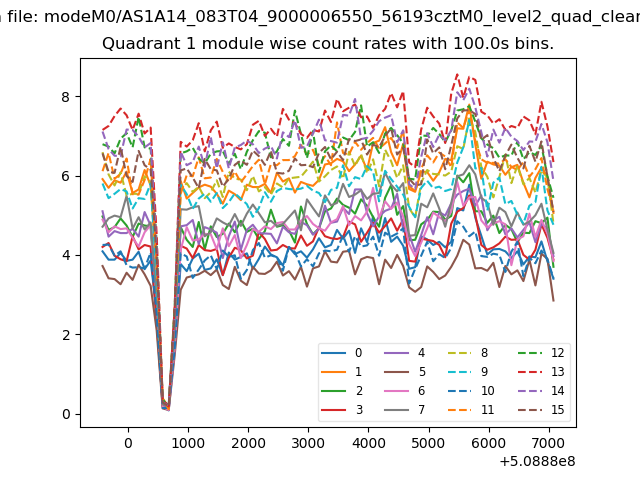
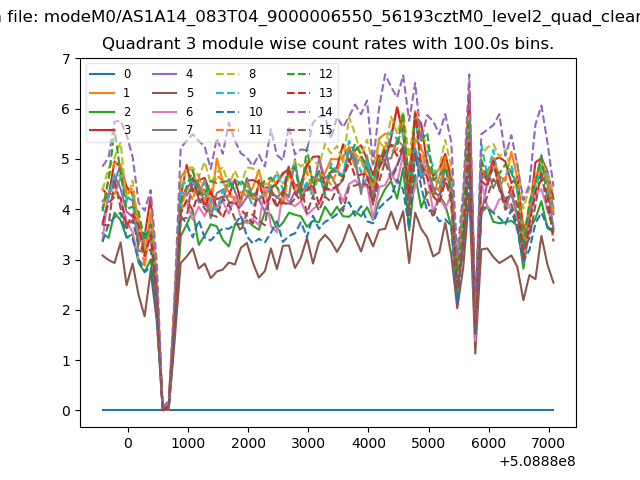
| Module-wise count rates for Quadrant A Data is divided into 100 sec bins |
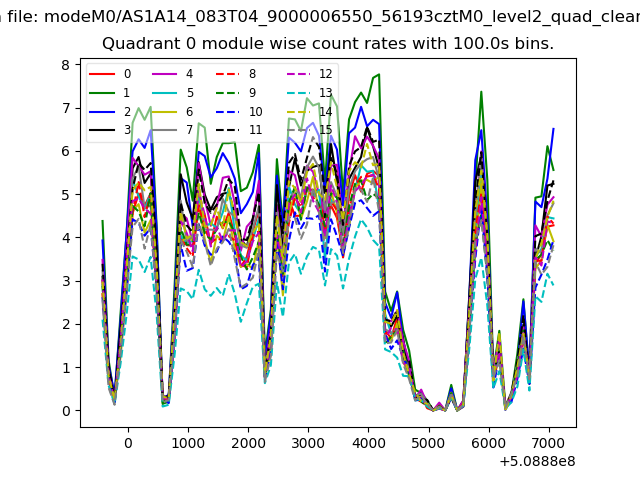 |
 |
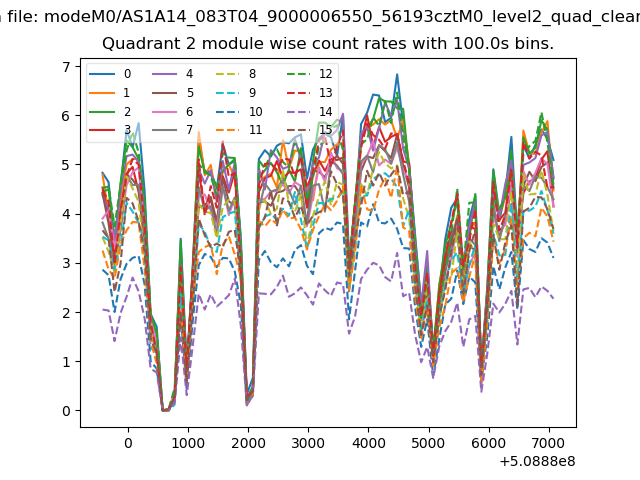
| Module-wise count rates for Quadrant B Data is divided into 100 sec bins |
 |
 |
| Module-wise count rates for Quadrant C Data is divided into 100 sec bins |
 |
 |
| Module-wise count rates for Quadrant D Data is divided into 100 sec bins |
 |
 |
| Parameter | Plot |
|---|---|
| CZT HV Monitor | 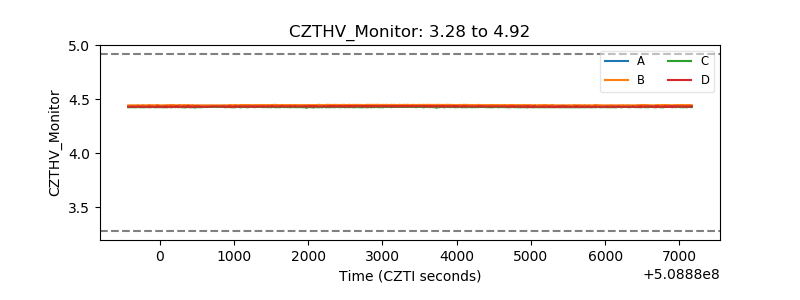 |
| D_VDD | 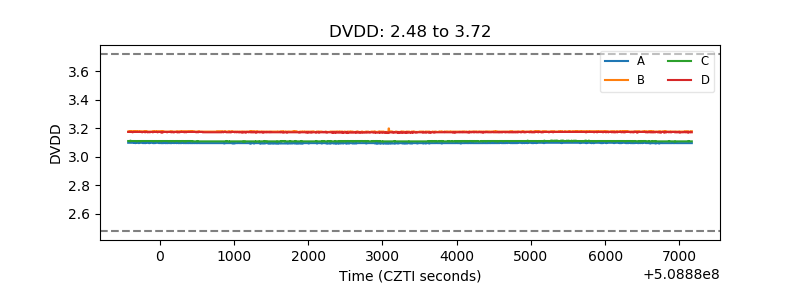 |
| Temperature 1 | 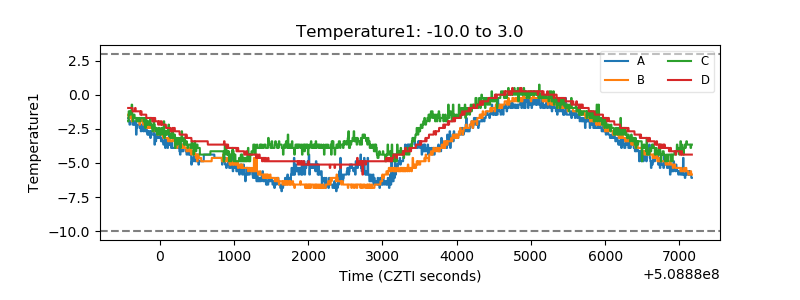 |
| Veto HV Monitor | 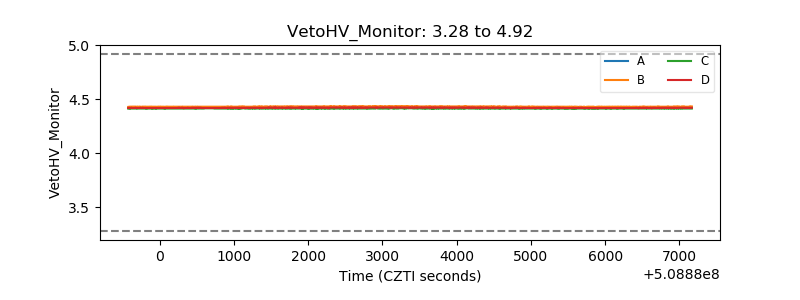 |
| Veto LLD | 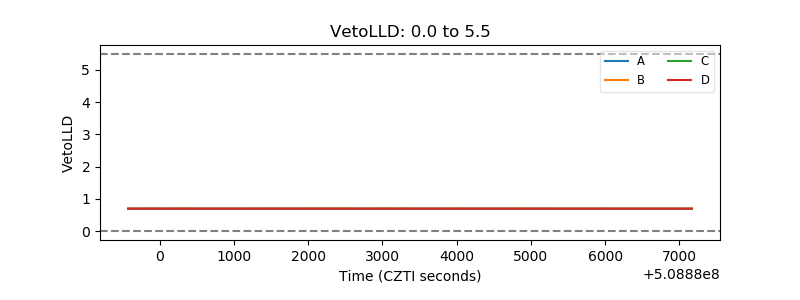 |
| Alpha Counter | 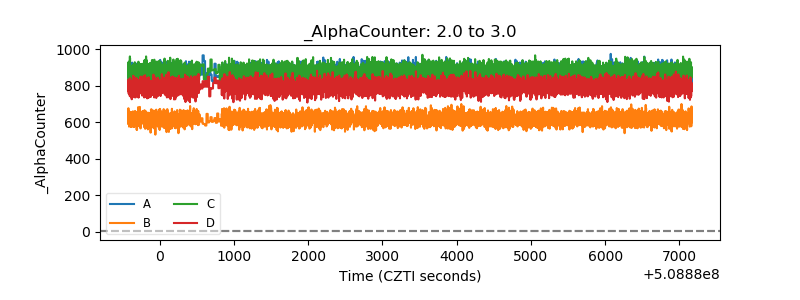 |
| _CPM_Rate | 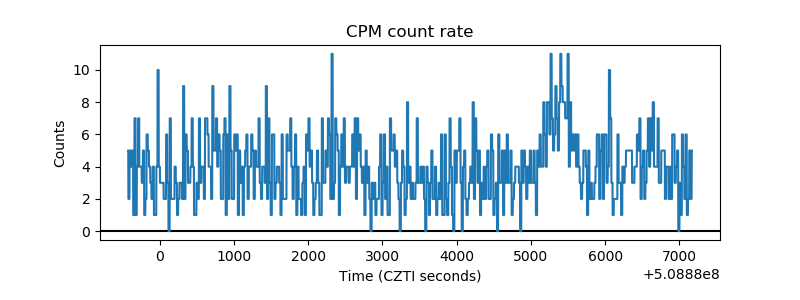 |
| CZT Counter | 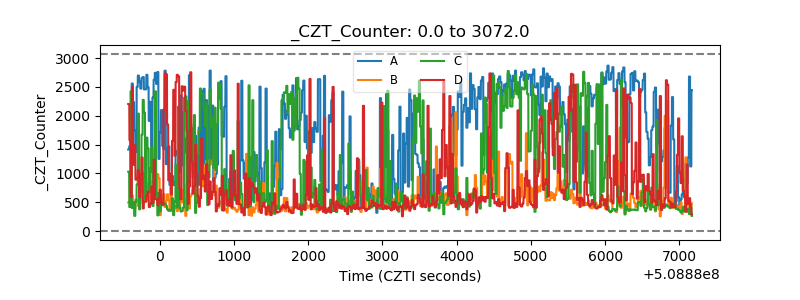 |
| +2.5 Volts monitor | 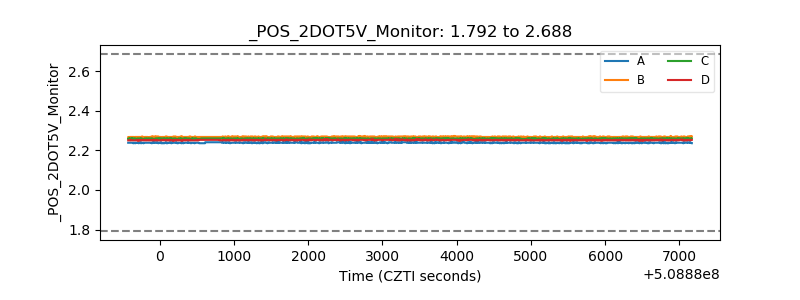 |
| +5 Volts monitor | 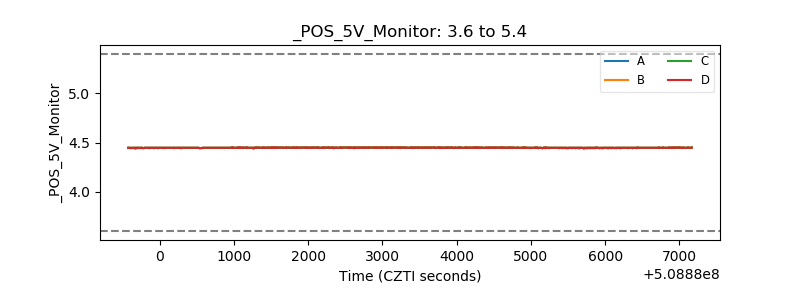 |
| _ROLL_ROT | 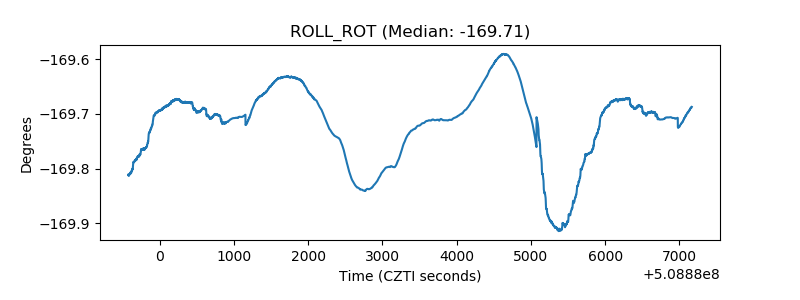 |
| _Roll_DEC | 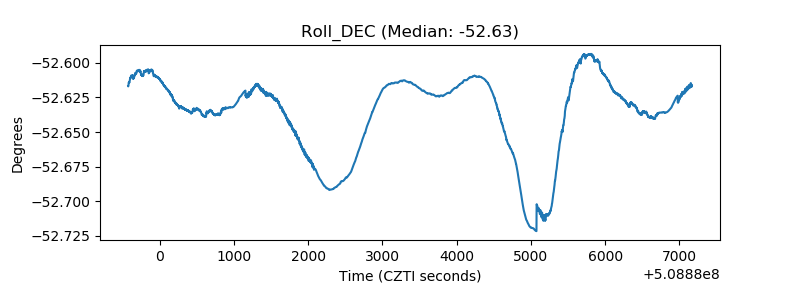 |
| _Roll_RA | 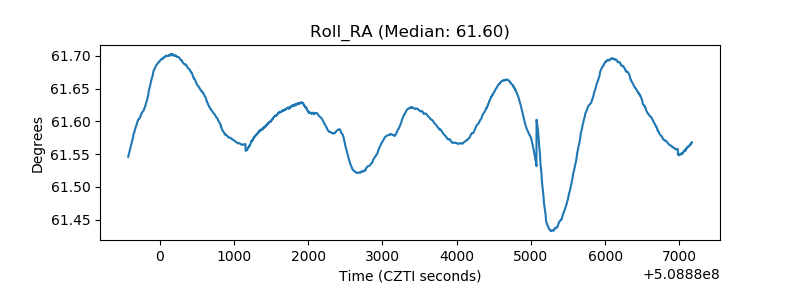 |
| Veto Counter | 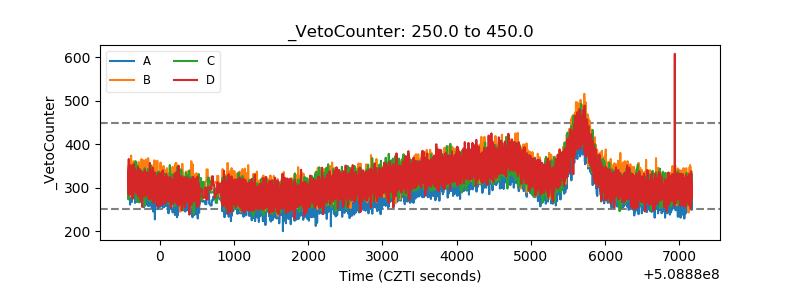 |