| Param | Original file | Final file |
|---|---|---|
| Filename | modeM0/AS1A14_083T04_9000006550_56196cztM0_level2.fits | modeM0/AS1A14_083T04_9000006550_56196cztM0_level2_quad_clean.evt |
| Size (bytes) | 1,558,212,480 | 208,765,440 |
| Size | 1.5 GB | 199.1 MB |
| Events in quadrant A | 18,918,278 | 1,162,551 |
| Events in quadrant B | 10,949,688 | 1,438,670 |
| Events in quadrant C | 11,046,455 | 1,276,652 |
| Events in quadrant D | 15,289,284 | 1,124,837 |
| Mode SS | |||
|---|---|---|---|
| Quadrant | BADHDUFLAG | Total packets | Discarded packets |
| A | 0 | 388 | 0 |
| B | 0 | 388 | 0 |
| C | 0 | 388 | 0 |
| D | 0 | 388 | 0 |
| Mode M9 | |||
|---|---|---|---|
| Quadrant | BADHDUFLAG | Total packets | Discarded packets |
| A | 0 | 14 | 0 |
| B | 0 | 14 | 0 |
| C | 0 | 14 | 0 |
| D | 0 | 14 | 0 |
| Mode M0 | |||
|---|---|---|---|
| Quadrant | BADHDUFLAG | Total packets | Discarded packets |
| A | 0 | 69374 | 3 |
| B | 0 | 45982 | 3 |
| C | 0 | 47128 | 3 |
| D | 0 | 59008 | 4 |
| Quadrant | Total seconds | Saturated seconds | Saturation percentage |
|---|---|---|---|
| A | 19105 | 3062 | 16.027218% |
| B | 19105 | 712 | 3.726773% |
| C | 19105 | 848 | 4.438629% |
| D | 19104 | 1352 | 7.077052% |
Noise dominated data is calculated using 1-second bins in cleaned event files. If a bin has >2000 counts, and if more than 50% of those come from <1% of pixels, then it is considered to be noise-dominated and hence unusable.
| Quadrant | # 1 sec bins | Bins with >0 counts | Bins with >2000 counts | High rate bins dominated by noise | Noise dominated (total time) | Noise dominated (detector-on time) | Marked lightcurve |
|---|---|---|---|---|---|---|---|
| A | 20823 | 19389 | 2483 | 2483 | 11.92% | 12.81% | 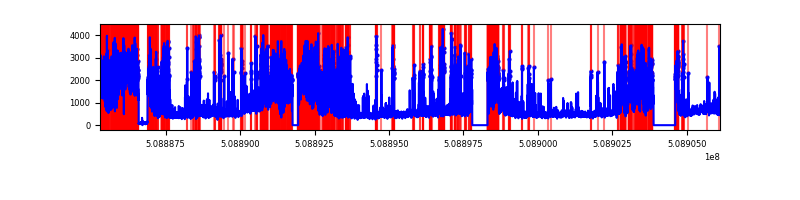 |
| B | 20823 | 19391 | 334 | 334 | 1.60% | 1.72% | 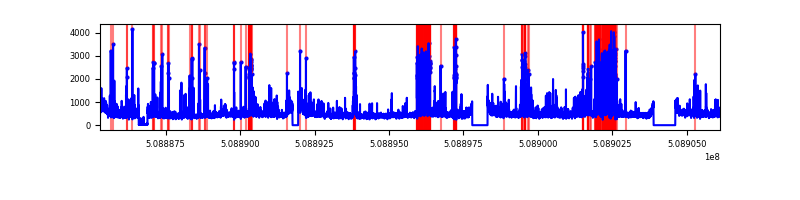 |
| C | 20823 | 19384 | 584 | 584 | 2.80% | 3.01% | 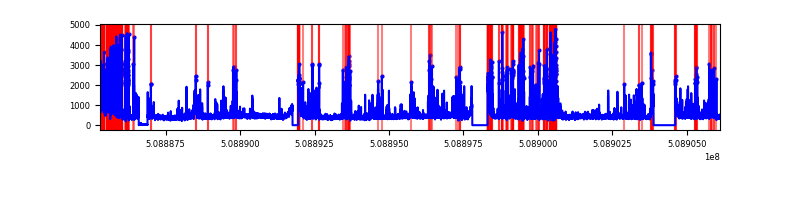 |
| D | 20822 | 19389 | 1149 | 1149 | 5.52% | 5.93% | 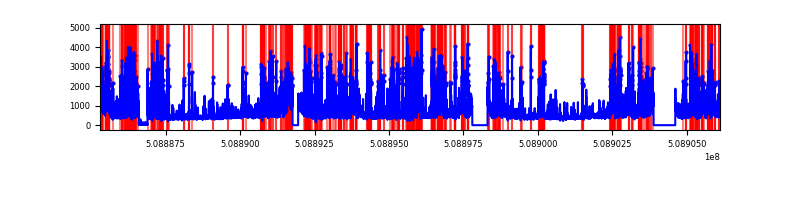 |
Top three noisy pixels from each quadrant. If the there are fewer than three noisy pixels in the level2.evt file, extra rows are filled as -1
| Pixel properties | Quadrant properties | ||||||
|---|---|---|---|---|---|---|---|
| Quadrant | DetID | PixID | Counts | Sigma | Mean | Median | Sigma |
| A | 15 | 32 | 3935814 | 8473.3 | 1888 | 1841 | 464.3 |
| A | 7 | 64 | 2671203 | 5749.48 | 1888 | 1841 | 464.3 |
| A | 8 | 176 | 2593120 | 5581.3 | 1888 | 1841 | 464.3 |
| B | 5 | 185 | 1512234 | 3527.52 | 2001 | 1921 | 428.2 |
| B | 0 | 171 | 316048 | 733.68 | 2001 | 1921 | 428.2 |
| B | 0 | 213 | 230490 | 533.85 | 2001 | 1921 | 428.2 |
| C | 12 | 254 | 1536375 | 2858.66 | 1939 | 1922 | 536.8 |
| C | 12 | 252 | 865461 | 1608.76 | 1939 | 1922 | 536.8 |
| C | 15 | 234 | 627140 | 1164.77 | 1939 | 1922 | 536.8 |
| D | 11 | 129 | 4382384 | 8219.91 | 1903 | 1819 | 532.9 |
| D | 6 | 239 | 979819 | 1835.17 | 1903 | 1819 | 532.9 |
| D | 8 | 129 | 508324 | 950.43 | 1903 | 1819 | 532.9 |
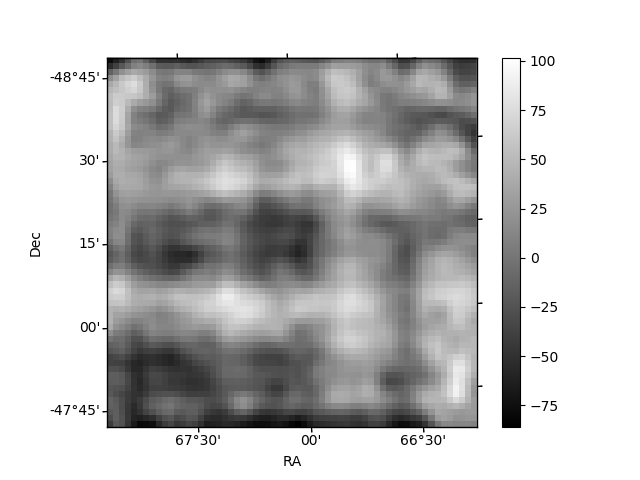
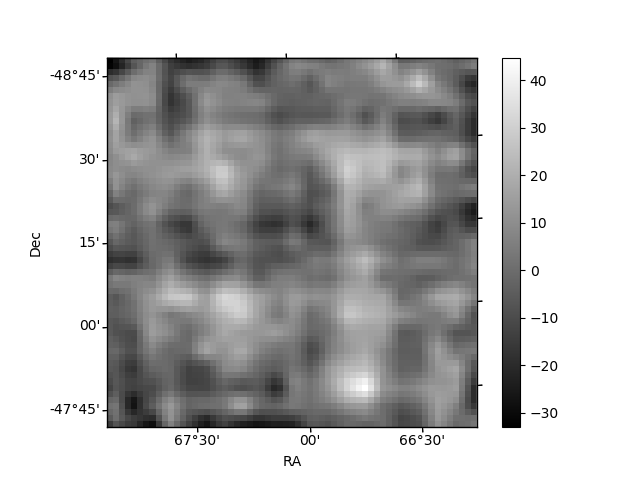
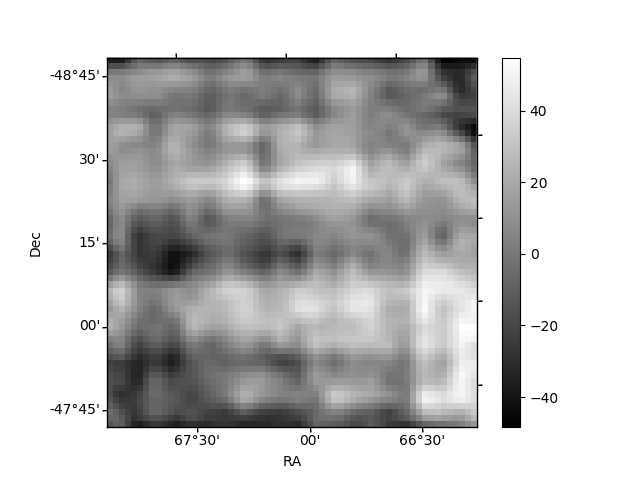
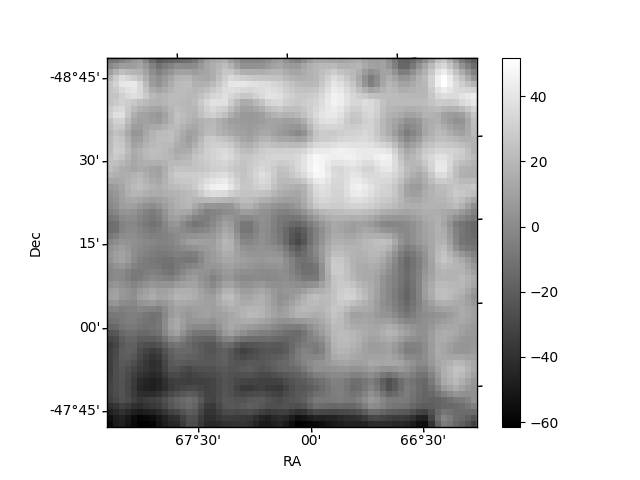
Histogram calculated using DETX and DETY for each event in the final _common_clean file
| Quadrant A | 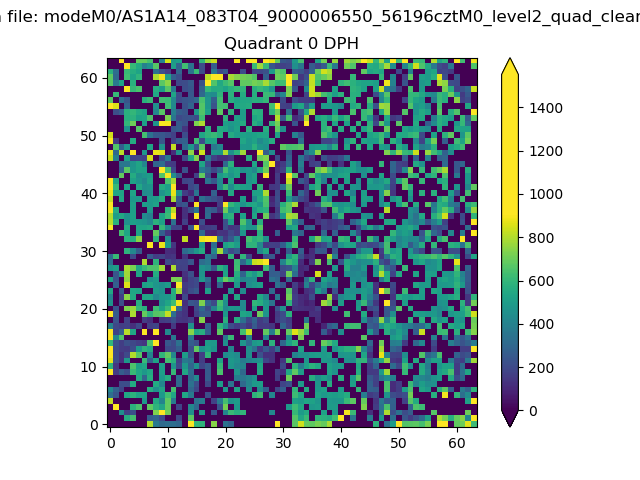 |
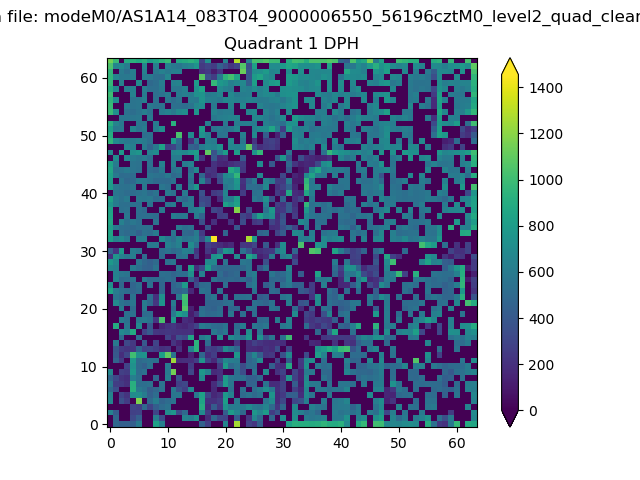 |
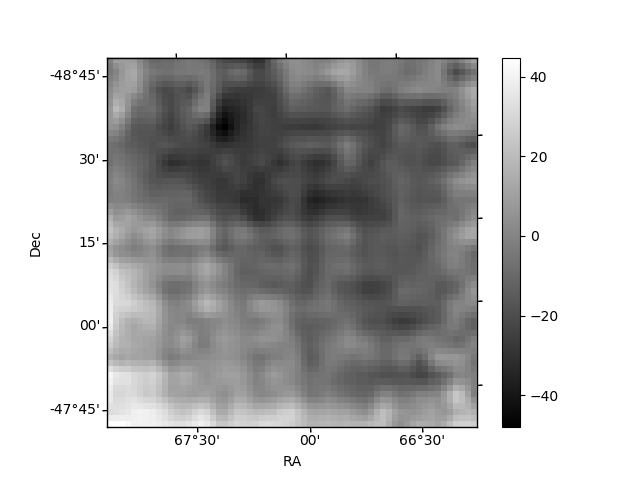
Quadrant B |
|---|---|---|---|
| Quadrant D | 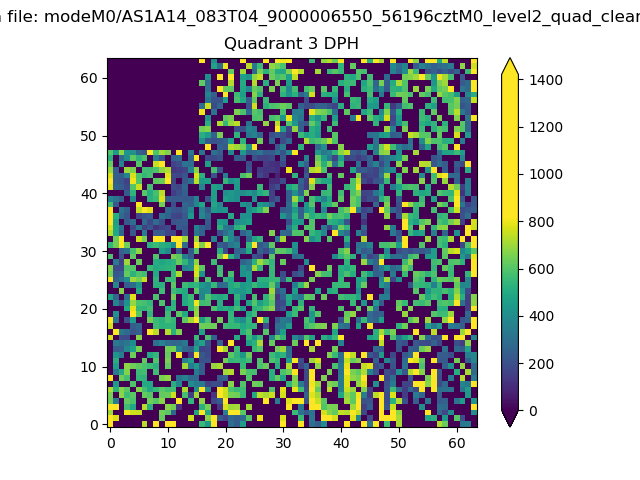 |
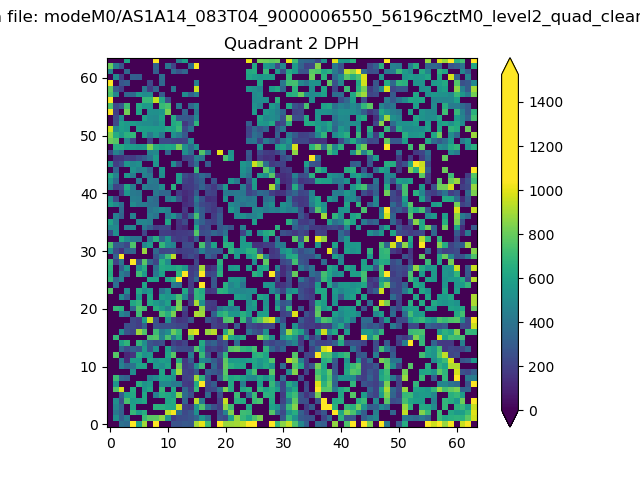 |
Quadrant C |
| Plot type | Count rate plots | Images |
|---|---|---|
| Comparison with Poisson distribution Blue bars denote a histogram of data divided into 1 sec bins. Red curve is a Poisson curve with rate = median count rate of data. |
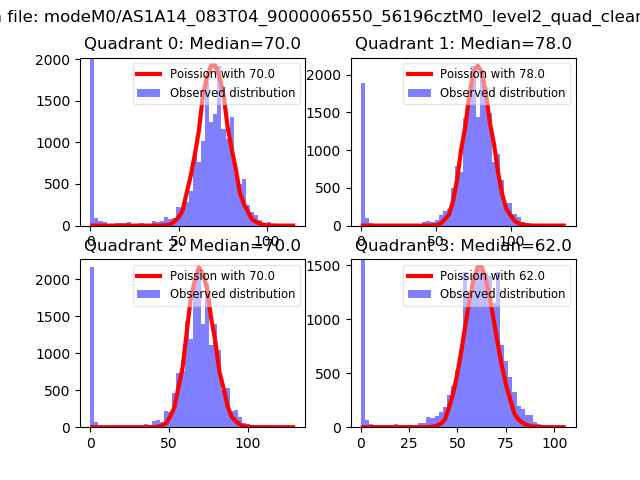 |
 |
| Quadrant-wise count rates Data is divided into 100 sec bins |
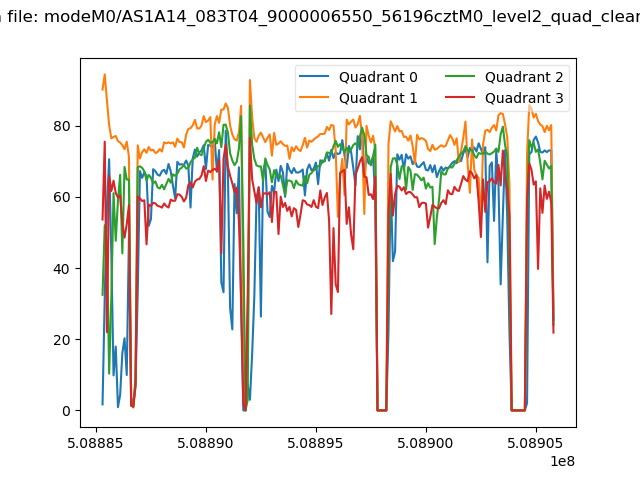 |
|
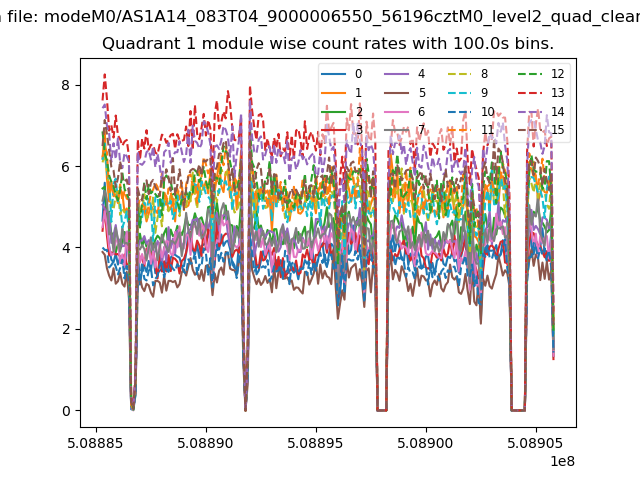
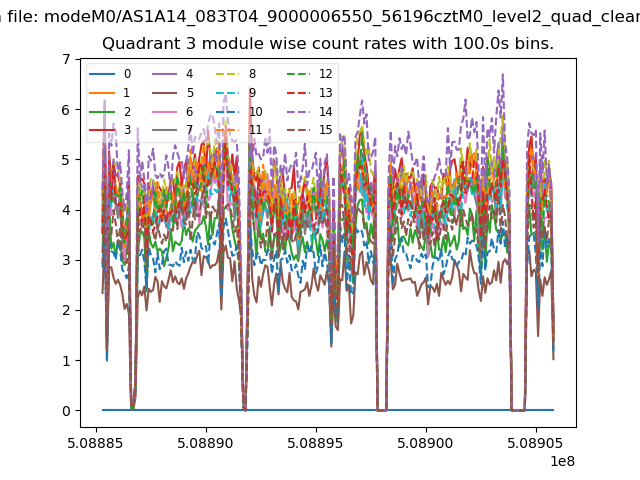
| Module-wise count rates for Quadrant A Data is divided into 100 sec bins |
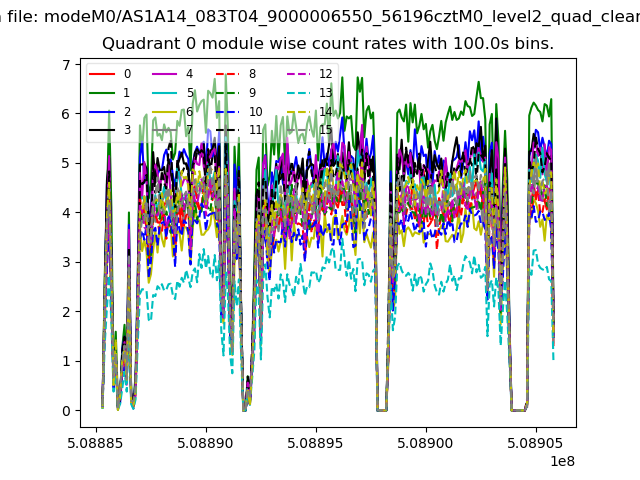 |
 |
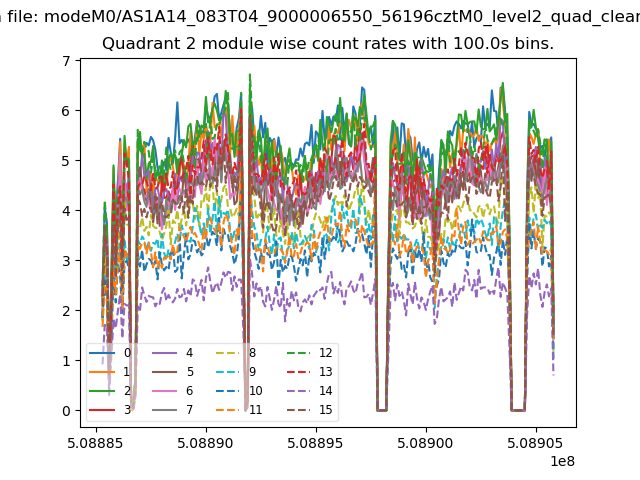
| Module-wise count rates for Quadrant B Data is divided into 100 sec bins |
 |
 |
| Module-wise count rates for Quadrant C Data is divided into 100 sec bins |
 |
 |
| Module-wise count rates for Quadrant D Data is divided into 100 sec bins |
 |
 |
| Parameter | Plot |
|---|---|
| CZT HV Monitor | 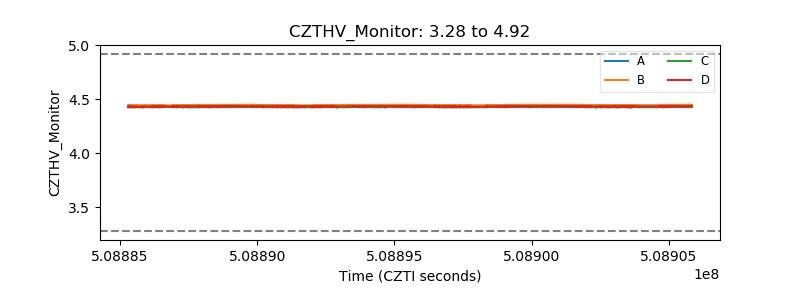 |
| D_VDD | 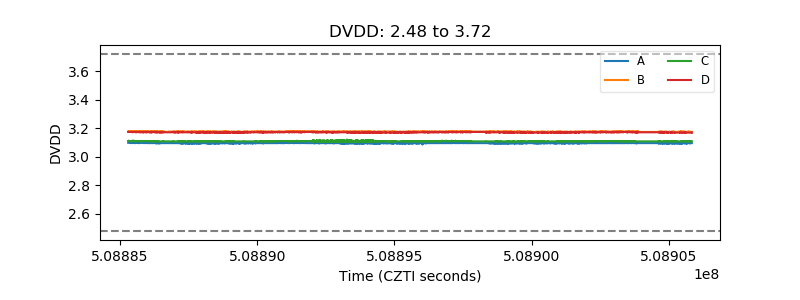 |
| Temperature 1 | 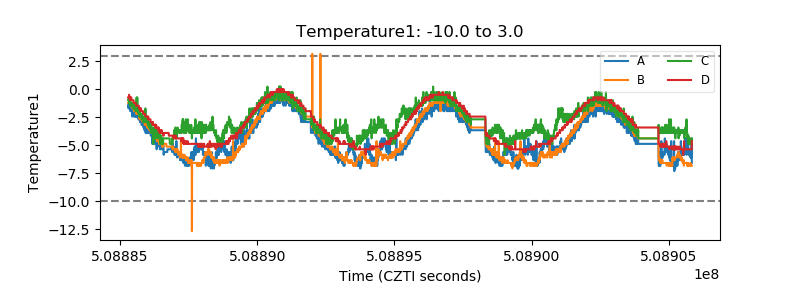 |
| Veto HV Monitor |  |
| Veto LLD | 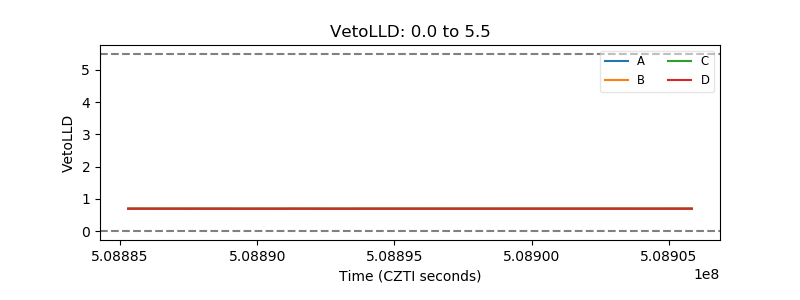 |
| Alpha Counter | 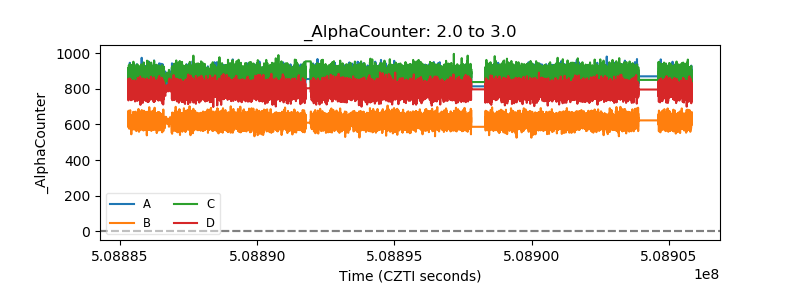 |
| _CPM_Rate | 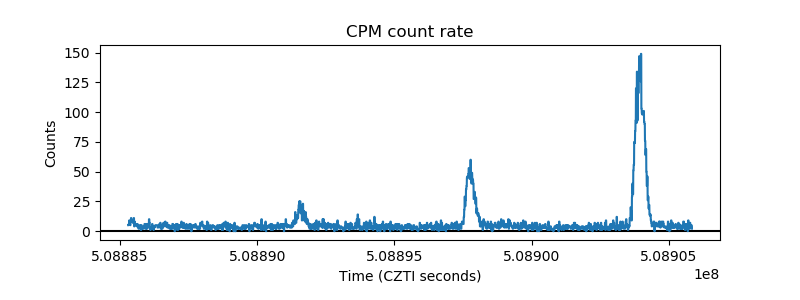 |
| CZT Counter | 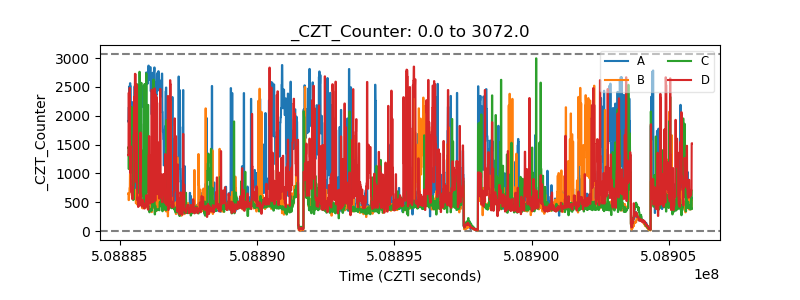 |
| +2.5 Volts monitor | 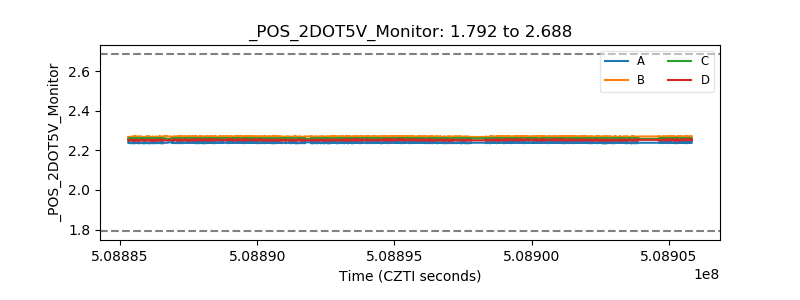 |
| +5 Volts monitor | 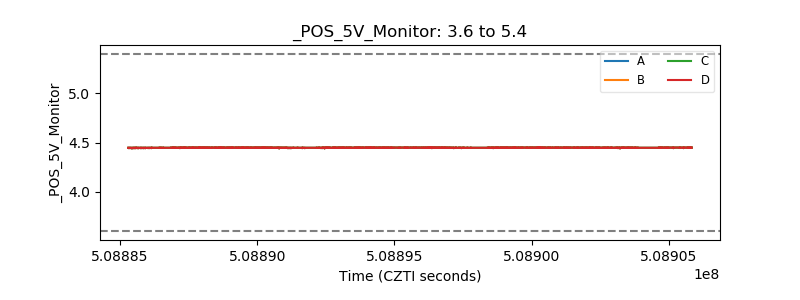 |
| _ROLL_ROT | 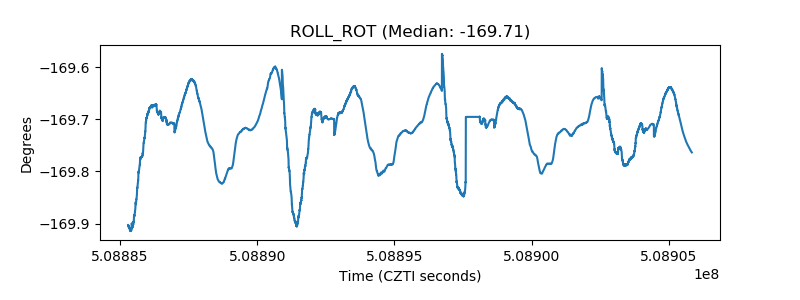 |
| _Roll_DEC | 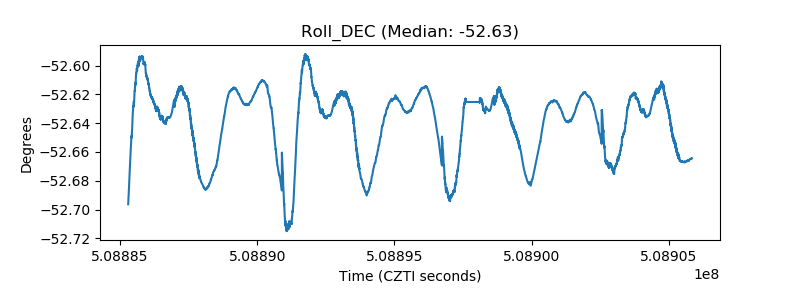 |
| _Roll_RA | 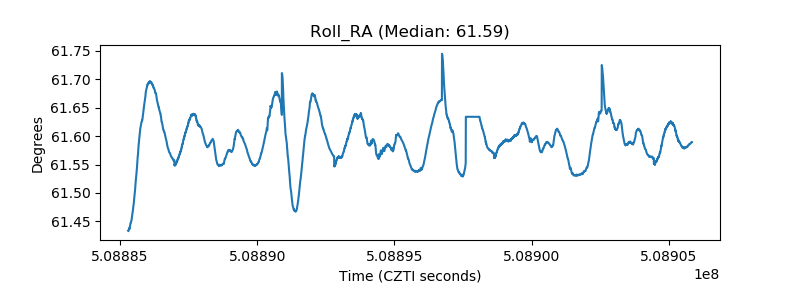 |
| Veto Counter | 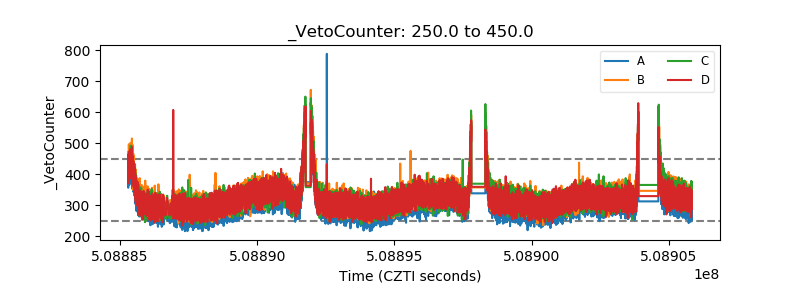 |