| Param | Original file | Final file |
|---|---|---|
| Filename | modeM0/AS1A14_083T04_9000006550_56197cztM0_level2.fits | modeM0/AS1A14_083T04_9000006550_56197cztM0_level2_quad_clean.evt |
| Size (bytes) | 686,312,640 | 85,311,360 |
| Size | 654.5 MB | 81.4 MB |
| Events in quadrant A | 10,352,913 | 371,489 |
| Events in quadrant B | 3,326,678 | 674,902 |
| Events in quadrant C | 5,624,780 | 540,985 |
| Events in quadrant D | 5,577,019 | 525,298 |
| Mode SS | |||
|---|---|---|---|
| Quadrant | BADHDUFLAG | Total packets | Discarded packets |
| A | 0 | 136 | 0 |
| B | 0 | 136 | 0 |
| C | 0 | 136 | 0 |
| D | 0 | 136 | 0 |
| Mode M9 | |||
|---|---|---|---|
| Quadrant | BADHDUFLAG | Total packets | Discarded packets |
| A | 0 | 11 | 0 |
| B | 0 | 11 | 0 |
| C | 0 | 12 | 0 |
| D | 0 | 12 | 0 |
| Mode M0 | |||
|---|---|---|---|
| Quadrant | BADHDUFLAG | Total packets | Discarded packets |
| A | 0 | 35454 | 3 |
| B | 0 | 14693 | 2 |
| C | 0 | 21487 | 2 |
| D | 0 | 21361 | 2 |
| Quadrant | Total seconds | Saturated seconds | Saturation percentage |
|---|---|---|---|
| A | 6748 | 2845 | 42.160640% |
| B | 6748 | 146 | 2.163604% |
| C | 6748 | 850 | 12.596325% |
| D | 6748 | 641 | 9.499111% |
Noise dominated data is calculated using 1-second bins in cleaned event files. If a bin has >2000 counts, and if more than 50% of those come from <1% of pixels, then it is considered to be noise-dominated and hence unusable.
| Quadrant | # 1 sec bins | Bins with >0 counts | Bins with >2000 counts | High rate bins dominated by noise | Noise dominated (total time) | Noise dominated (detector-on time) | Marked lightcurve |
|---|---|---|---|---|---|---|---|
| A | 7598 | 6748 | 2665 | 2665 | 35.08% | 39.49% |  |
| B | 7598 | 6748 | 24 | 24 | 0.32% | 0.36% |  |
| C | 7598 | 6748 | 608 | 608 | 8.00% | 9.01% |  |
| D | 7598 | 6749 | 520 | 520 | 6.84% | 7.70% |  |
Top three noisy pixels from each quadrant. If the there are fewer than three noisy pixels in the level2.evt file, extra rows are filled as -1
| Pixel properties | Quadrant properties | ||||||
|---|---|---|---|---|---|---|---|
| Quadrant | DetID | PixID | Counts | Sigma | Mean | Median | Sigma |
| A | 12 | 115 | 5896264 | 42416.45 | 558 | 545 | 139.0 |
| A | 15 | 32 | 970392 | 6977.51 | 558 | 545 | 139.0 |
| A | 8 | 176 | 428938 | 3082.05 | 558 | 545 | 139.0 |
| B | 5 | 185 | 135126 | 862.92 | 717 | 690 | 155.8 |
| B | 0 | 213 | 56416 | 357.69 | 717 | 690 | 155.8 |
| B | 0 | 63 | 46589 | 294.62 | 717 | 690 | 155.8 |
| C | 12 | 254 | 2362898 | 12790.85 | 673 | 665 | 184.7 |
| C | 12 | 252 | 285418 | 1541.86 | 673 | 665 | 184.7 |
| C | 15 | 234 | 112227 | 604.08 | 673 | 665 | 184.7 |
| D | 11 | 129 | 937764 | 4950.8 | 676 | 643 | 189.3 |
| D | 13 | 153 | 730822 | 3857.53 | 676 | 643 | 189.3 |
| D | 8 | 240 | 528347 | 2787.85 | 676 | 643 | 189.3 |
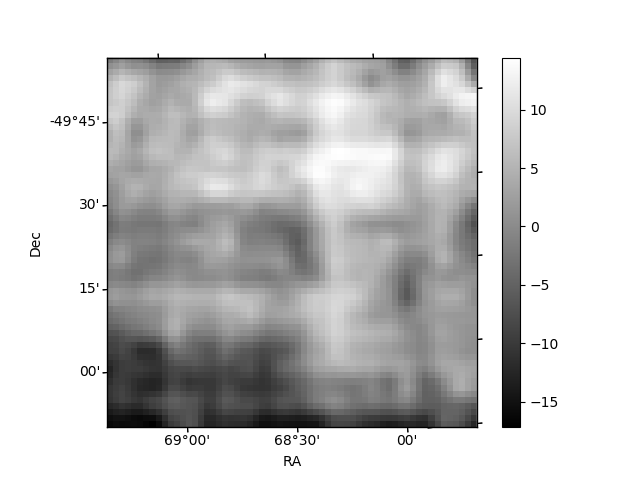
Histogram calculated using DETX and DETY for each event in the final _common_clean file
| Quadrant A | 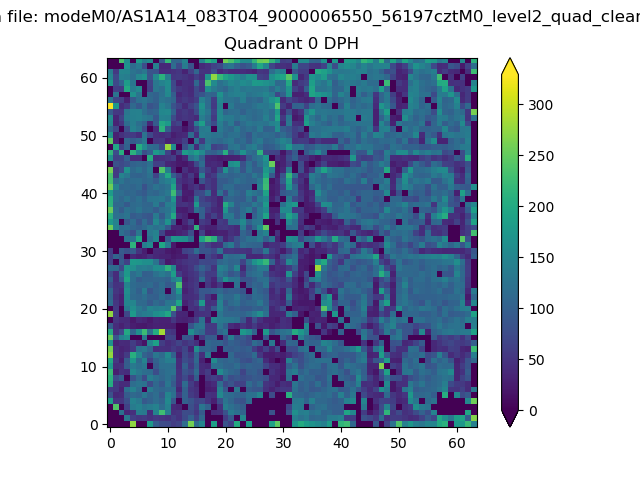 |
 |
Quadrant B |
|---|---|---|---|
| Quadrant D | 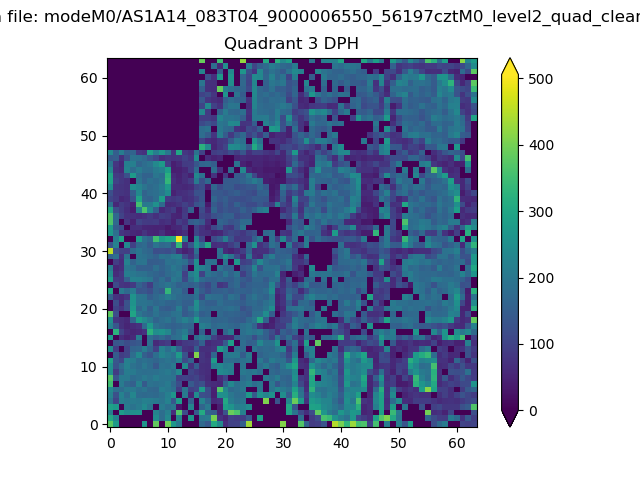 |
 |
Quadrant C |
| Plot type | Count rate plots | Images |
|---|---|---|
| Comparison with Poisson distribution Blue bars denote a histogram of data divided into 1 sec bins. Red curve is a Poisson curve with rate = median count rate of data. |
 |
 |
| Quadrant-wise count rates Data is divided into 100 sec bins |
 |
|
| Module-wise count rates for Quadrant A Data is divided into 100 sec bins |
 |
 |
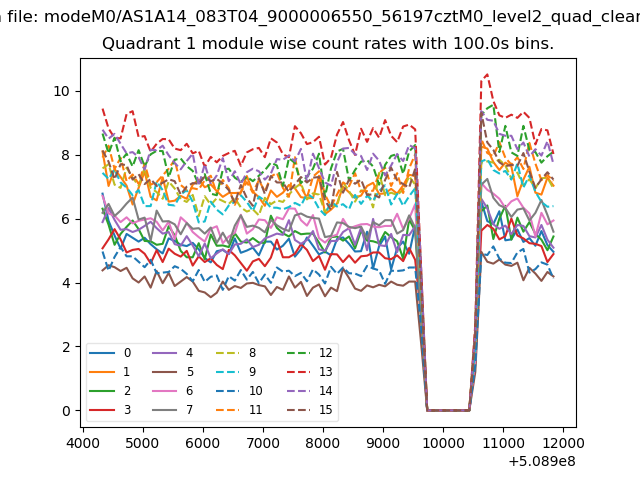
| Module-wise count rates for Quadrant B Data is divided into 100 sec bins |
 |
 |
| Module-wise count rates for Quadrant C Data is divided into 100 sec bins |
 |
 |
| Module-wise count rates for Quadrant D Data is divided into 100 sec bins |
 |
 |
| Parameter | Plot |
|---|---|
| CZT HV Monitor | 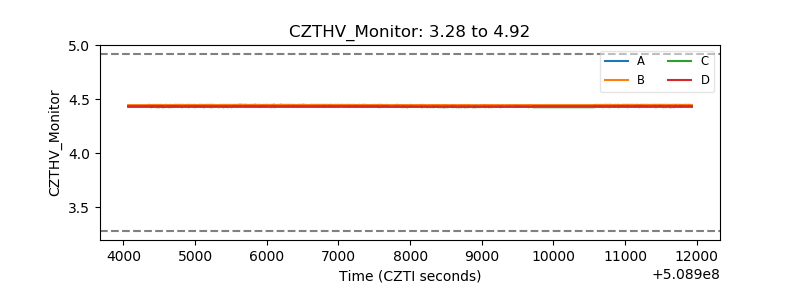 |
| D_VDD |  |
| Temperature 1 | 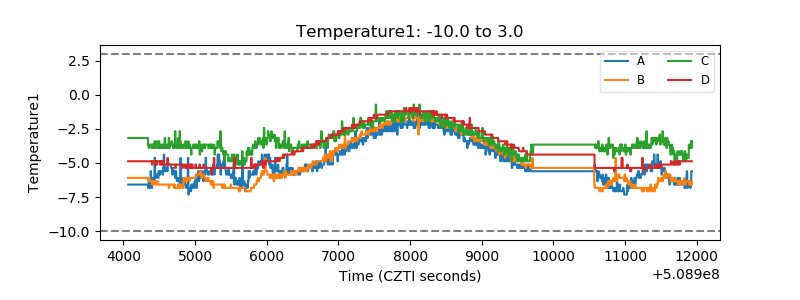 |
| Veto HV Monitor |  |
| Veto LLD |  |
| Alpha Counter | 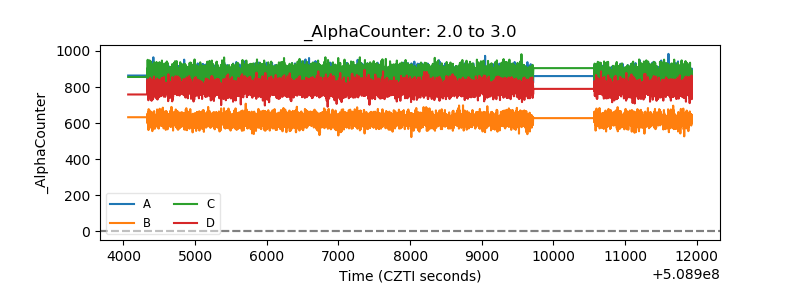 |
| _CPM_Rate | 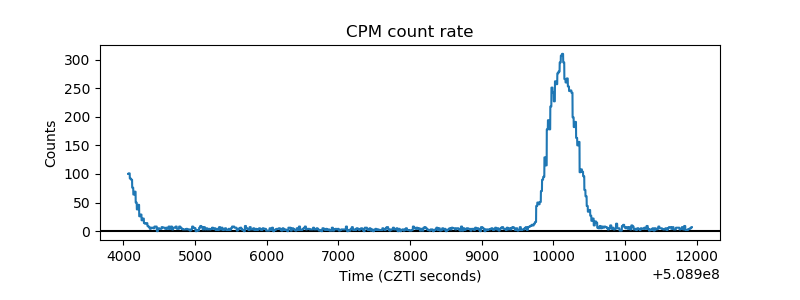 |
| CZT Counter | 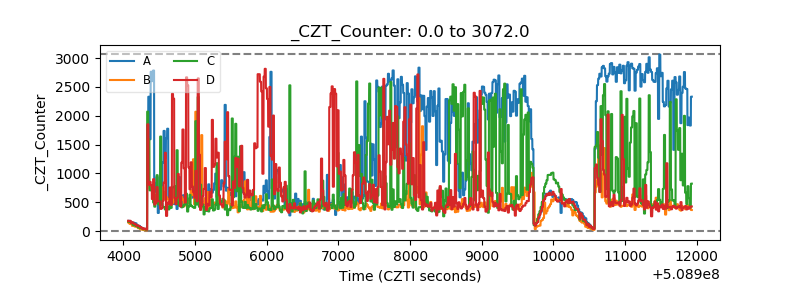 |
| +2.5 Volts monitor | 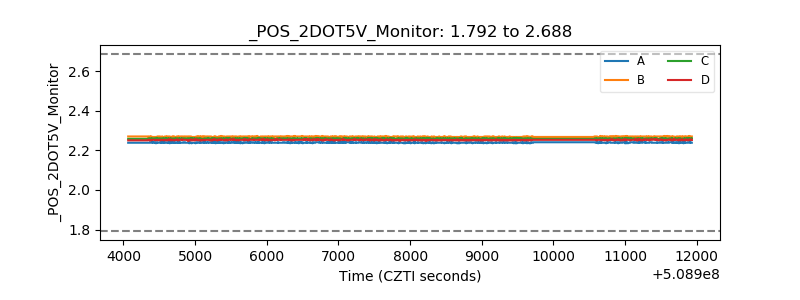 |
| +5 Volts monitor |  |
| _ROLL_ROT |  |
| _Roll_DEC |  |
| _Roll_RA |  |
| Veto Counter |  |