| Param | Original file | Final file |
|---|---|---|
| Filename | modeM0/AS1A14_083T04_9000006550_56199cztM0_level2.fits | modeM0/AS1A14_083T04_9000006550_56199cztM0_level2_quad_clean.evt |
| Size (bytes) | 717,739,200 | 81,777,600 |
| Size | 684.5 MB | 78.0 MB |
| Events in quadrant A | 12,003,851 | 293,956 |
| Events in quadrant B | 3,417,327 | 663,640 |
| Events in quadrant C | 6,287,496 | 515,812 |
| Events in quadrant D | 4,353,725 | 547,784 |
| Mode SS | |||
|---|---|---|---|
| Quadrant | BADHDUFLAG | Total packets | Discarded packets |
| A | 0 | 132 | 0 |
| B | 0 | 132 | 0 |
| C | 0 | 132 | 0 |
| D | 0 | 132 | 0 |
| Mode M9 | |||
|---|---|---|---|
| Quadrant | BADHDUFLAG | Total packets | Discarded packets |
| A | 0 | 10 | 0 |
| B | 0 | 10 | 0 |
| C | 0 | 10 | 0 |
| D | 0 | 10 | 0 |
| Mode M0 | |||
|---|---|---|---|
| Quadrant | BADHDUFLAG | Total packets | Discarded packets |
| A | 0 | 40075 | 1 |
| B | 0 | 14705 | 1 |
| C | 0 | 23232 | 1 |
| D | 0 | 17505 | 4 |
| Quadrant | Total seconds | Saturated seconds | Saturation percentage |
|---|---|---|---|
| A | 6519 | 3728 | 57.186685% |
| B | 6520 | 203 | 3.113497% |
| C | 6520 | 1219 | 18.696319% |
| D | 6519 | 284 | 4.356496% |
Noise dominated data is calculated using 1-second bins in cleaned event files. If a bin has >2000 counts, and if more than 50% of those come from <1% of pixels, then it is considered to be noise-dominated and hence unusable.
| Quadrant | # 1 sec bins | Bins with >0 counts | Bins with >2000 counts | High rate bins dominated by noise | Noise dominated (total time) | Noise dominated (detector-on time) | Marked lightcurve |
|---|---|---|---|---|---|---|---|
| A | 7504 | 6519 | 3390 | 3390 | 45.18% | 52.00% | 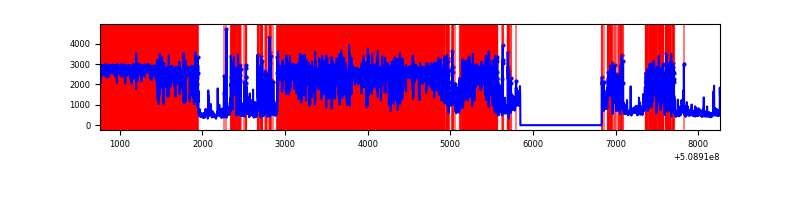 |
| B | 7505 | 6520 | 83 | 83 | 1.11% | 1.27% | 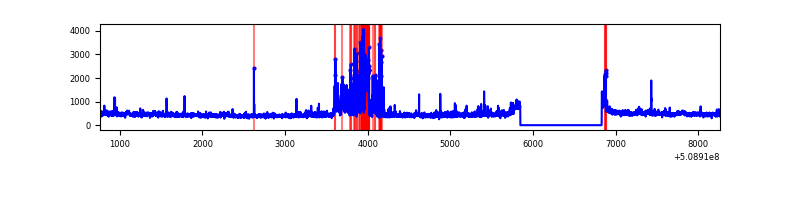 |
| C | 7505 | 6520 | 914 | 914 | 12.18% | 14.02% | 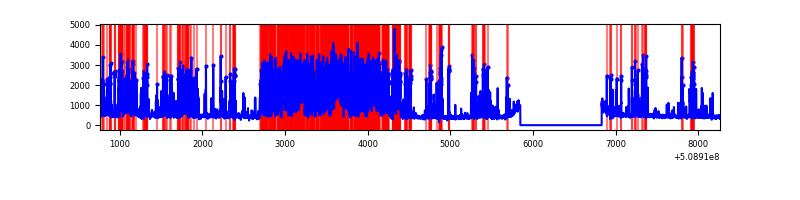 |
| D | 7504 | 6519 | 219 | 219 | 2.92% | 3.36% | 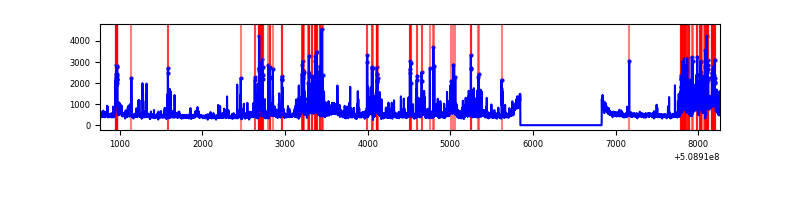 |
Top three noisy pixels from each quadrant. If the there are fewer than three noisy pixels in the level2.evt file, extra rows are filled as -1
| Pixel properties | Quadrant properties | ||||||
|---|---|---|---|---|---|---|---|
| Quadrant | DetID | PixID | Counts | Sigma | Mean | Median | Sigma |
| A | 12 | 115 | 4744471 | 37363.5 | 503 | 489 | 127.0 |
| A | 15 | 32 | 4150335 | 32684.1 | 503 | 489 | 127.0 |
| A | 7 | 64 | 697935 | 5493.07 | 503 | 489 | 127.0 |
| B | 5 | 185 | 406138 | 2725.12 | 692 | 666 | 148.8 |
| B | 4 | 171 | 62235 | 413.79 | 692 | 666 | 148.8 |
| B | 4 | 21 | 39074 | 258.13 | 692 | 666 | 148.8 |
| C | 12 | 254 | 3284587 | 18714.1 | 644 | 637 | 175.5 |
| C | 12 | 252 | 357113 | 2031.43 | 644 | 637 | 175.5 |
| C | 11 | 244 | 29491 | 164.43 | 644 | 637 | 175.5 |
| D | 11 | 129 | 743281 | 3914.81 | 675 | 645 | 189.7 |
| D | 8 | 240 | 330721 | 1740.0 | 675 | 645 | 189.7 |
| D | 14 | 52 | 169603 | 890.66 | 675 | 645 | 189.7 |
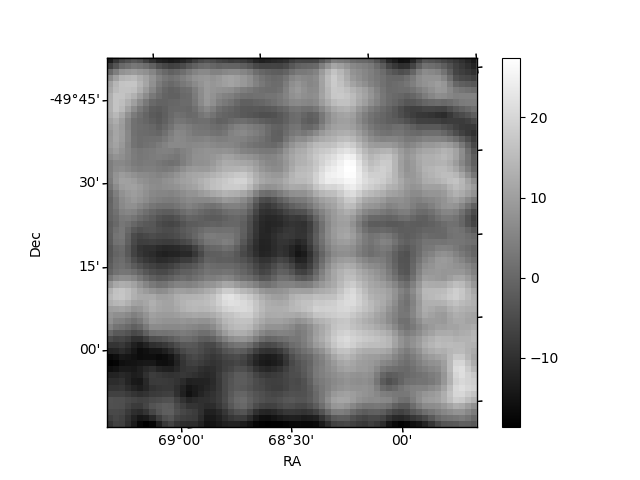
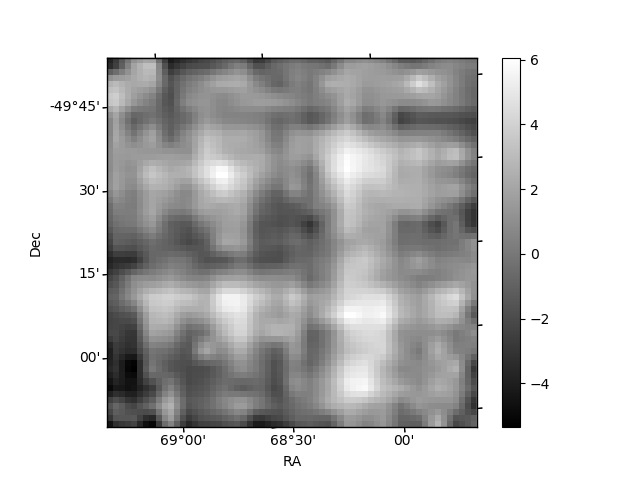
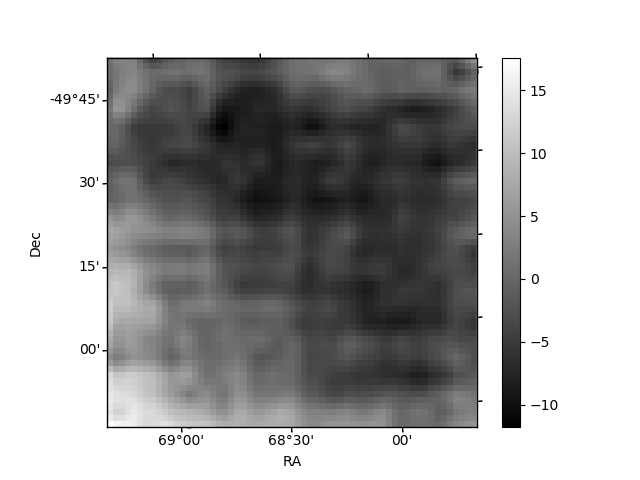
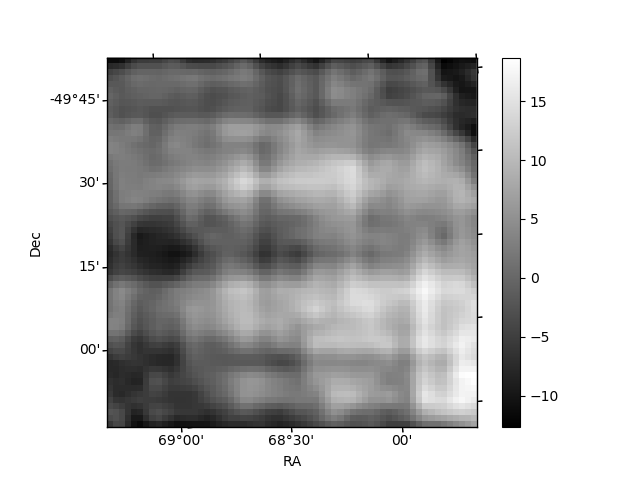
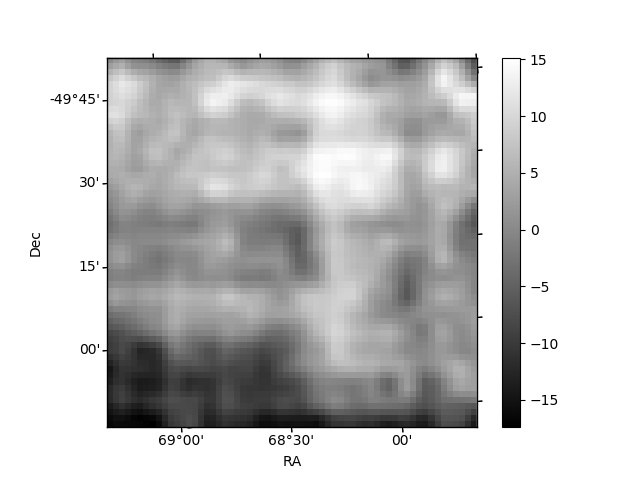
Histogram calculated using DETX and DETY for each event in the final _common_clean file
| Quadrant A | 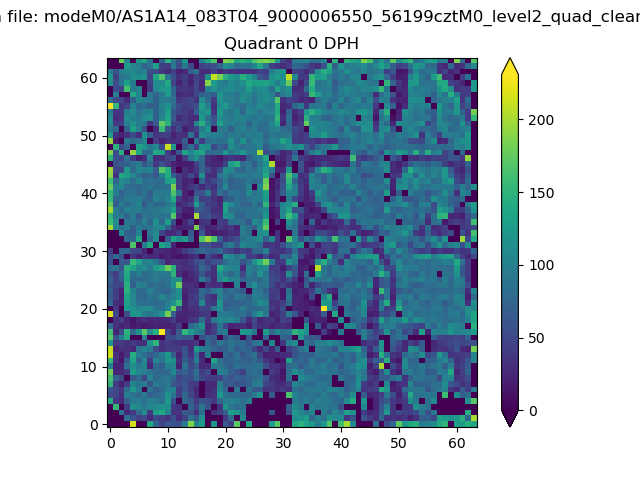 |
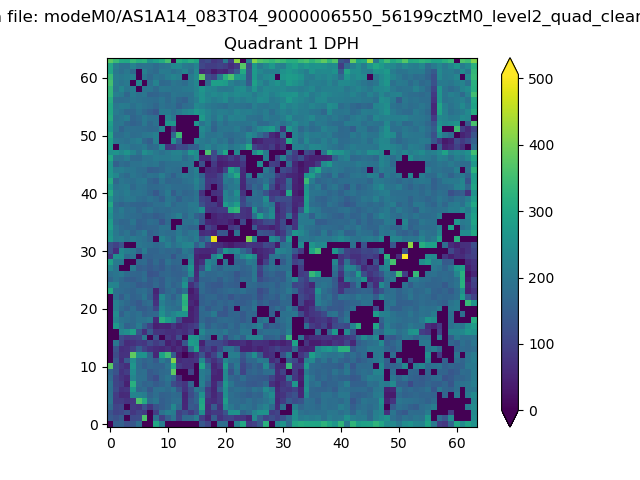 |
Quadrant B |
|---|---|---|---|
| Quadrant D | 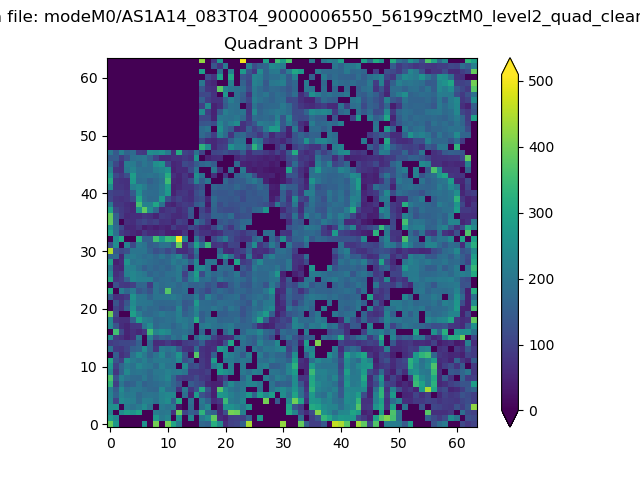 |
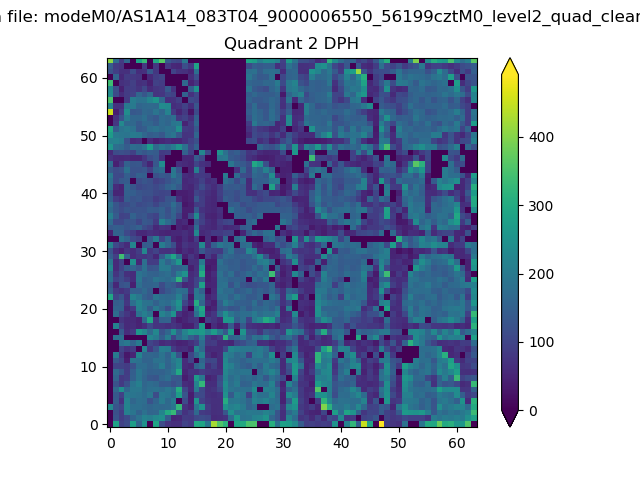 |
Quadrant C |
| Plot type | Count rate plots | Images |
|---|---|---|
| Comparison with Poisson distribution Blue bars denote a histogram of data divided into 1 sec bins. Red curve is a Poisson curve with rate = median count rate of data. |
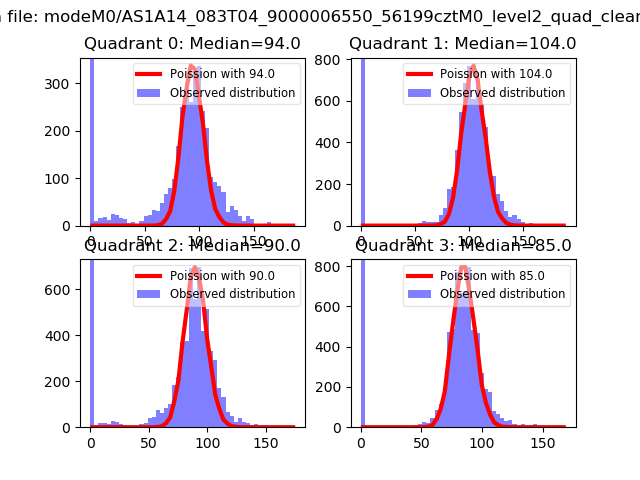 |
 |
| Quadrant-wise count rates Data is divided into 100 sec bins |
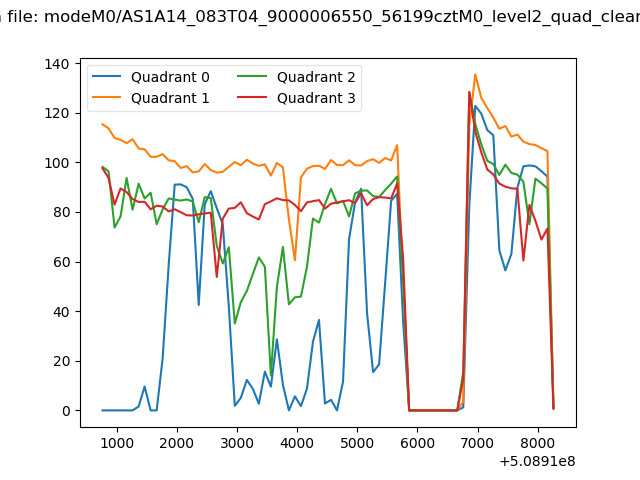 |
|
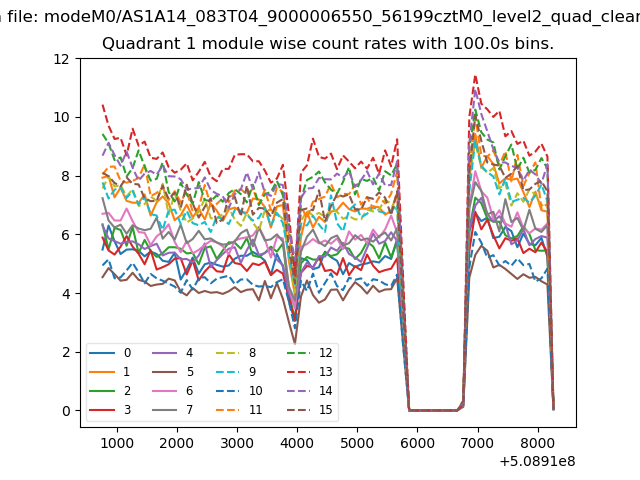
| Module-wise count rates for Quadrant A Data is divided into 100 sec bins |
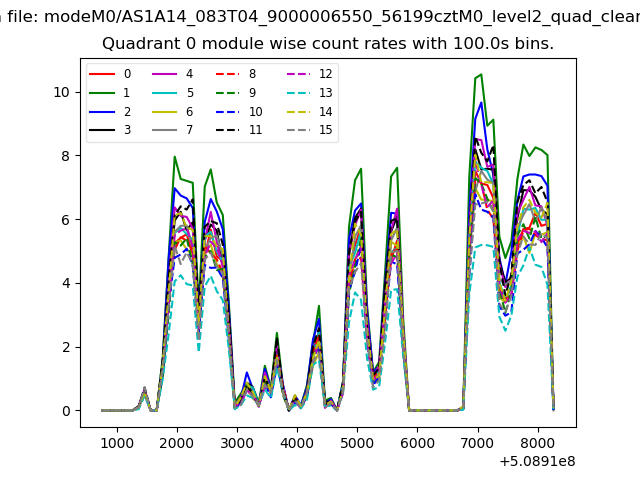 |
 |
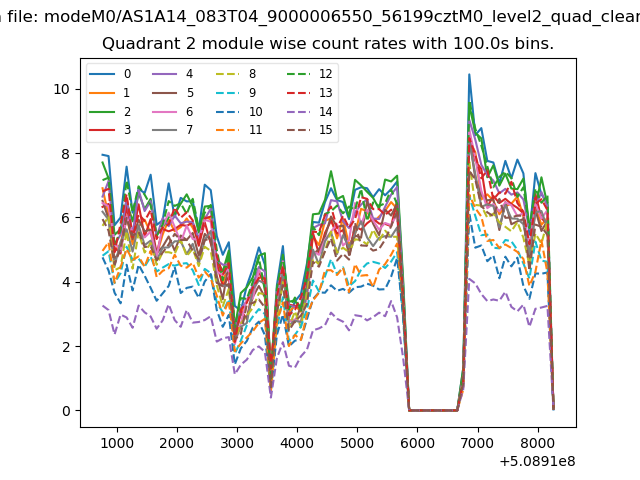
| Module-wise count rates for Quadrant B Data is divided into 100 sec bins |
 |
 |
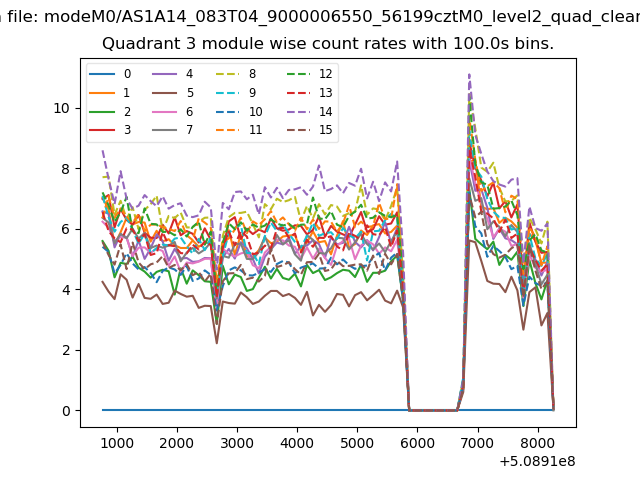
| Module-wise count rates for Quadrant C Data is divided into 100 sec bins |
 |
 |
| Module-wise count rates for Quadrant D Data is divided into 100 sec bins |
 |
 |
| Parameter | Plot |
|---|---|
| CZT HV Monitor | 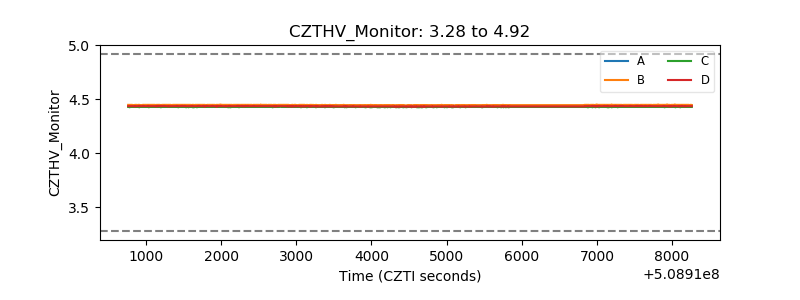 |
| D_VDD | 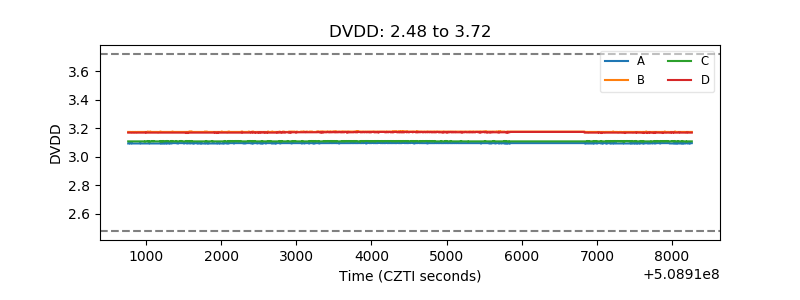 |
| Temperature 1 | 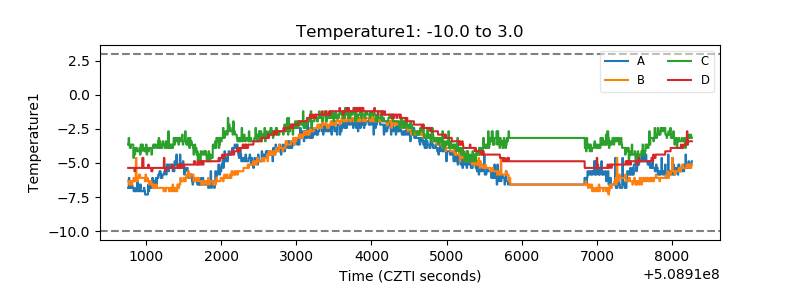 |
| Veto HV Monitor | 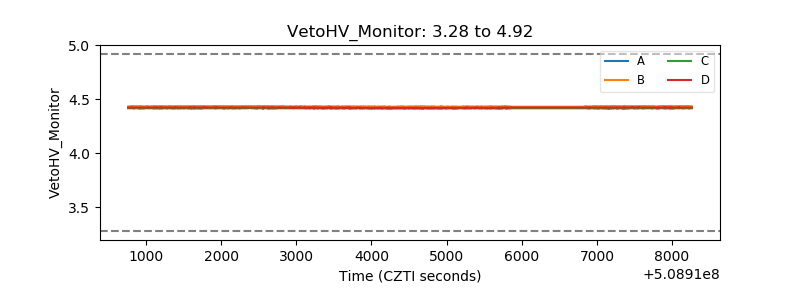 |
| Veto LLD | 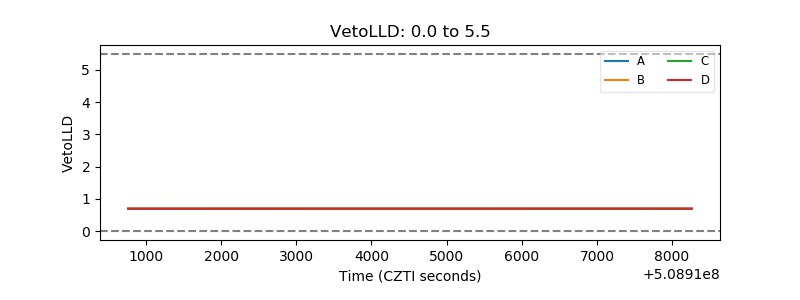 |
| Alpha Counter | 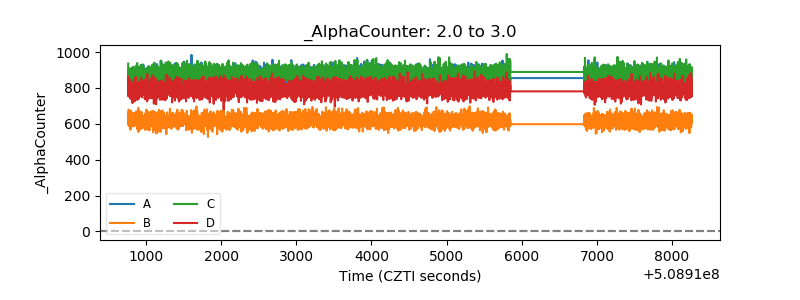 |
| _CPM_Rate | 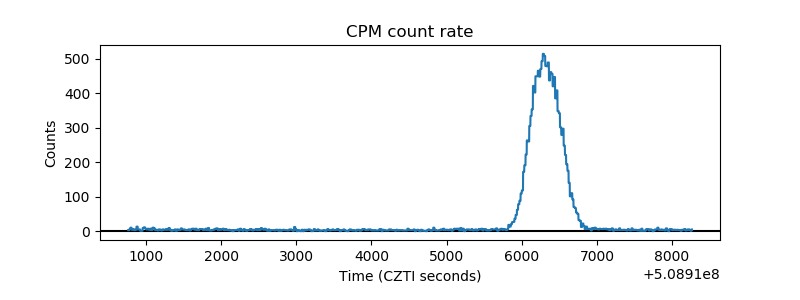 |
| CZT Counter | 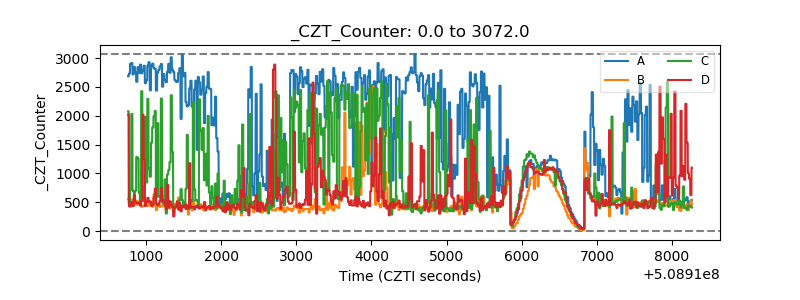 |
| +2.5 Volts monitor | 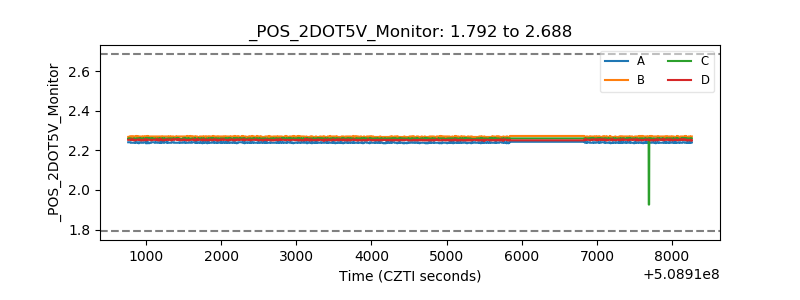 |
| +5 Volts monitor | 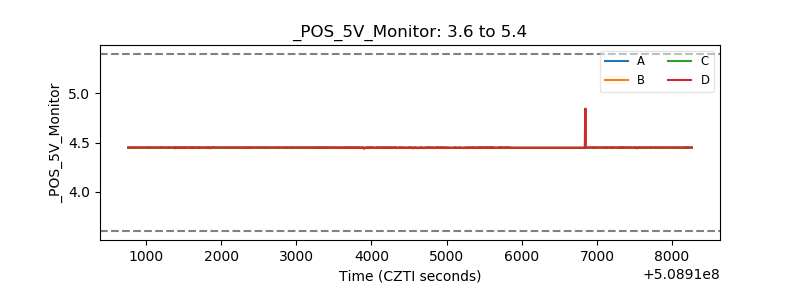 |
| _ROLL_ROT | 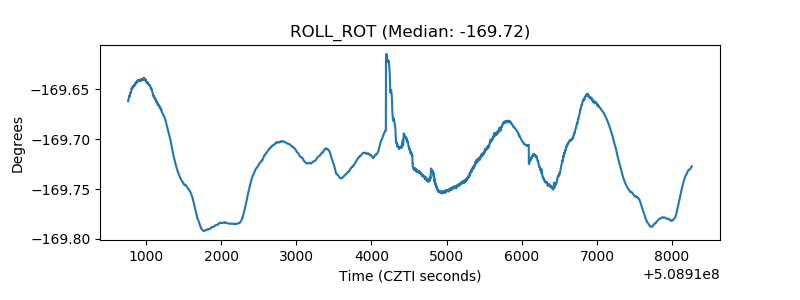 |
| _Roll_DEC |  |
| _Roll_RA | 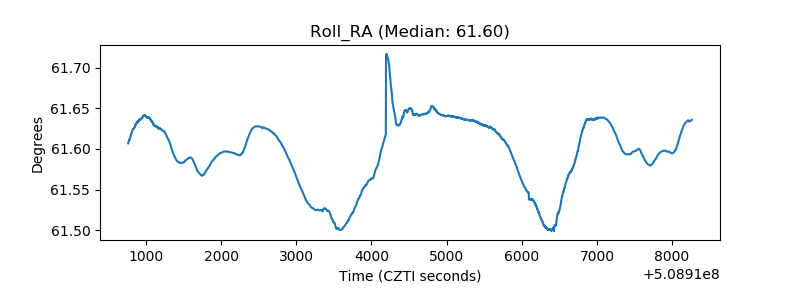 |
| Veto Counter | 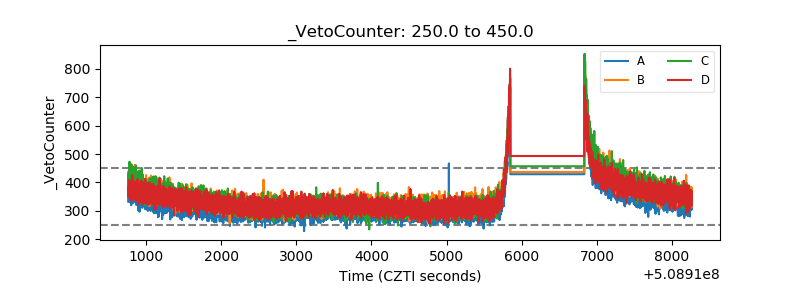 |