| Param | Original file | Final file |
|---|---|---|
| Filename | modeM0/AS1A14_083T04_9000006550_56200cztM0_level2.fits | modeM0/AS1A14_083T04_9000006550_56200cztM0_level2_quad_clean.evt |
| Size (bytes) | 645,675,840 | 92,298,240 |
| Size | 615.8 MB | 88.0 MB |
| Events in quadrant A | 7,755,212 | 547,621 |
| Events in quadrant B | 3,432,544 | 698,417 |
| Events in quadrant C | 5,914,869 | 558,099 |
| Events in quadrant D | 6,289,622 | 532,875 |
| Mode SS | |||
|---|---|---|---|
| Quadrant | BADHDUFLAG | Total packets | Discarded packets |
| A | 0 | 134 | 0 |
| B | 0 | 134 | 0 |
| C | 0 | 134 | 0 |
| D | 0 | 134 | 0 |
| Mode M9 | |||
|---|---|---|---|
| Quadrant | BADHDUFLAG | Total packets | Discarded packets |
| A | 0 | 13 | 0 |
| B | 0 | 14 | 0 |
| C | 0 | 14 | 0 |
| D | 0 | 14 | 0 |
| Mode M0 | |||
|---|---|---|---|
| Quadrant | BADHDUFLAG | Total packets | Discarded packets |
| A | 0 | 27491 | 2 |
| B | 0 | 14579 | 2 |
| C | 0 | 22293 | 4 |
| D | 0 | 23117 | 2 |
| Quadrant | Total seconds | Saturated seconds | Saturation percentage |
|---|---|---|---|
| A | 6560 | 1399 | 21.326220% |
| B | 6560 | 191 | 2.911585% |
| C | 6559 | 980 | 14.941302% |
| D | 6559 | 856 | 13.050770% |
Noise dominated data is calculated using 1-second bins in cleaned event files. If a bin has >2000 counts, and if more than 50% of those come from <1% of pixels, then it is considered to be noise-dominated and hence unusable.
| Quadrant | # 1 sec bins | Bins with >0 counts | Bins with >2000 counts | High rate bins dominated by noise | Noise dominated (total time) | Noise dominated (detector-on time) | Marked lightcurve |
|---|---|---|---|---|---|---|---|
| A | 7625 | 6560 | 1080 | 1080 | 14.16% | 16.46% | 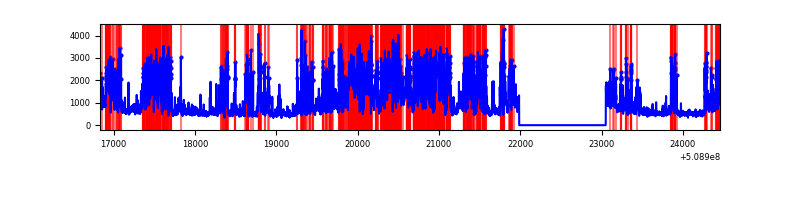 |
| B | 7625 | 6560 | 20 | 20 | 0.26% | 0.30% | 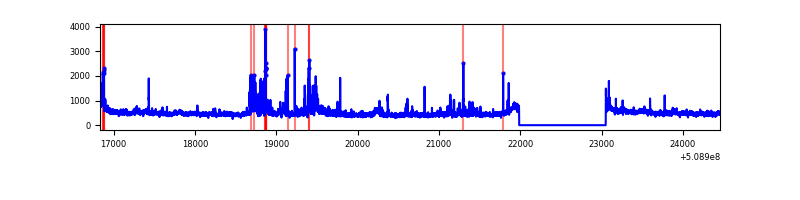 |
| C | 7623 | 6558 | 699 | 699 | 9.17% | 10.66% | 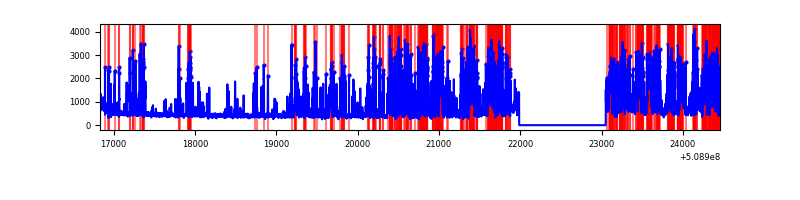 |
| D | 7624 | 6559 | 676 | 676 | 8.87% | 10.31% | 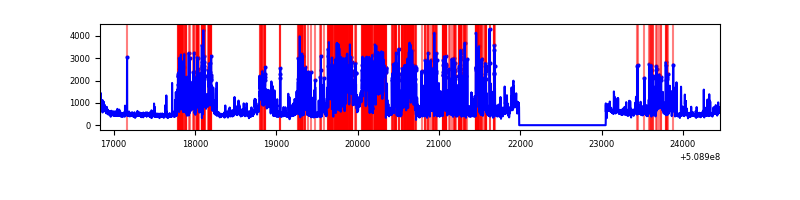 |
Top three noisy pixels from each quadrant. If the there are fewer than three noisy pixels in the level2.evt file, extra rows are filled as -1
| Pixel properties | Quadrant properties | ||||||
|---|---|---|---|---|---|---|---|
| Quadrant | DetID | PixID | Counts | Sigma | Mean | Median | Sigma |
| A | 15 | 32 | 3521220 | 20621.6 | 685 | 668 | 170.7 |
| A | 8 | 176 | 519050 | 3036.42 | 685 | 668 | 170.7 |
| A | 7 | 64 | 324996 | 1899.75 | 685 | 668 | 170.7 |
| B | 5 | 185 | 276568 | 1784.94 | 723 | 697 | 154.6 |
| B | 0 | 63 | 87761 | 563.32 | 723 | 697 | 154.6 |
| B | 4 | 21 | 32583 | 206.31 | 723 | 697 | 154.6 |
| C | 12 | 254 | 2389462 | 12994.78 | 676 | 671 | 183.8 |
| C | 12 | 252 | 691599 | 3758.58 | 676 | 671 | 183.8 |
| C | 1 | 12 | 85104 | 459.31 | 676 | 671 | 183.8 |
| D | 11 | 129 | 3056763 | 15736.62 | 688 | 657 | 194.2 |
| D | 2 | 249 | 169579 | 869.82 | 688 | 657 | 194.2 |
| D | 3 | 176 | 116802 | 598.06 | 688 | 657 | 194.2 |
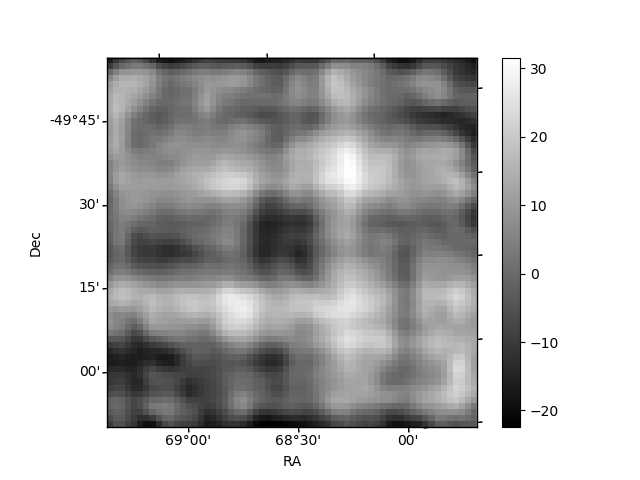
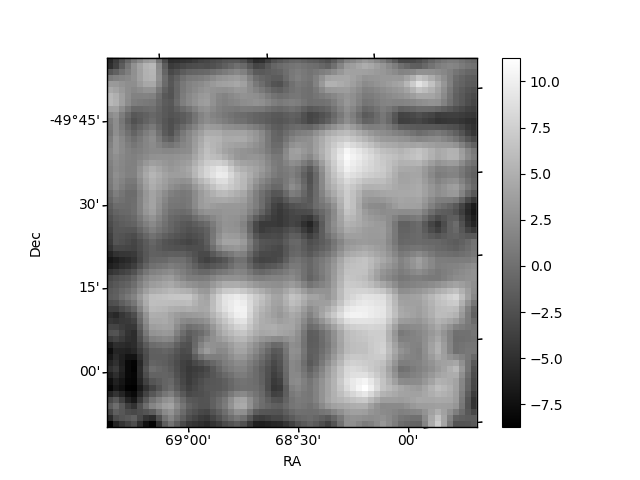
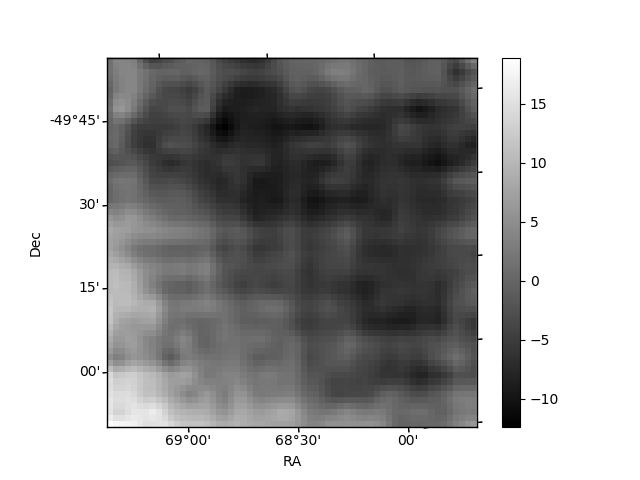
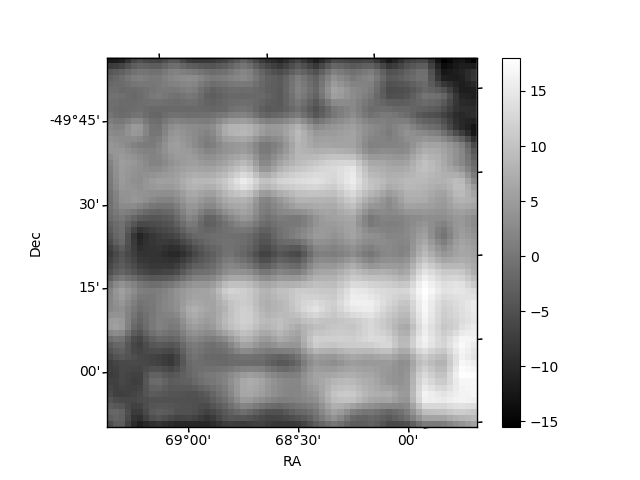
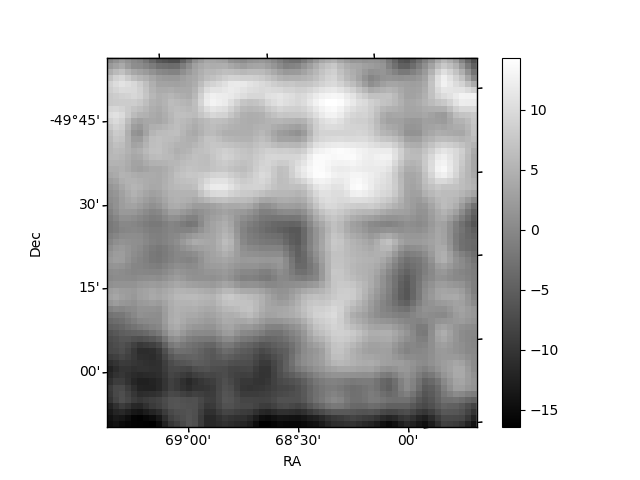
Histogram calculated using DETX and DETY for each event in the final _common_clean file
| Quadrant A | 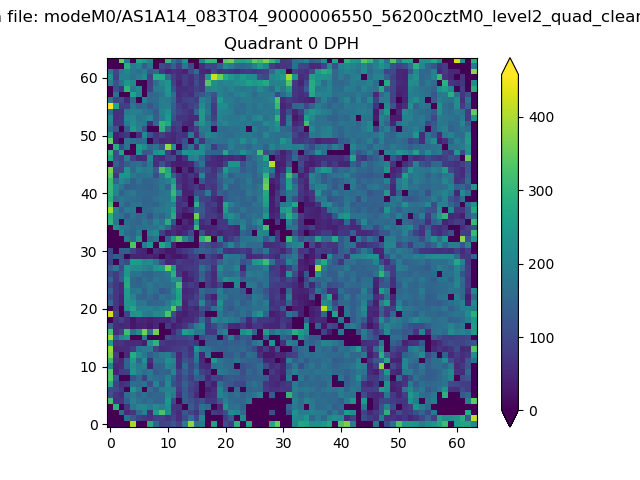 |
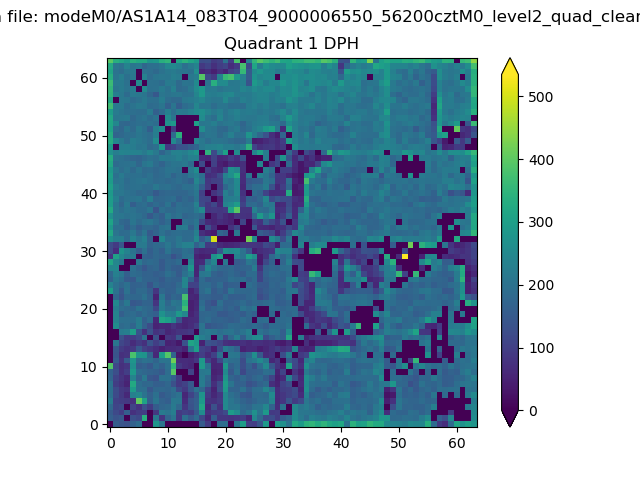 |
Quadrant B |
|---|---|---|---|
| Quadrant D | 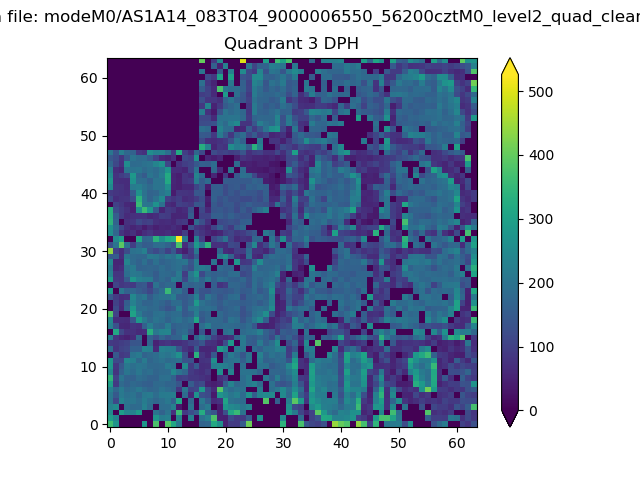 |
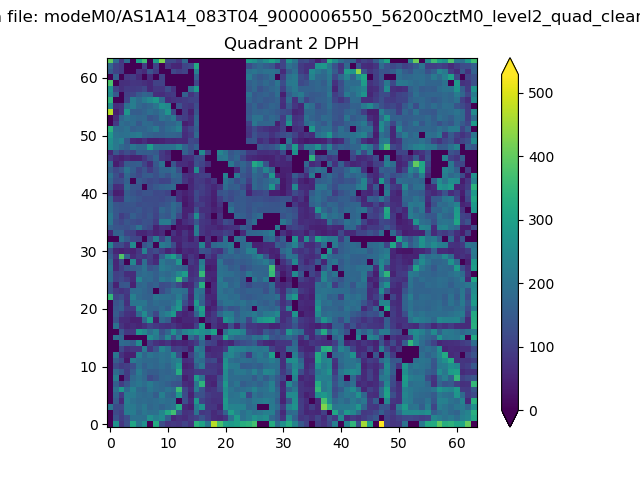 |
Quadrant C |
| Plot type | Count rate plots | Images |
|---|---|---|
| Comparison with Poisson distribution Blue bars denote a histogram of data divided into 1 sec bins. Red curve is a Poisson curve with rate = median count rate of data. |
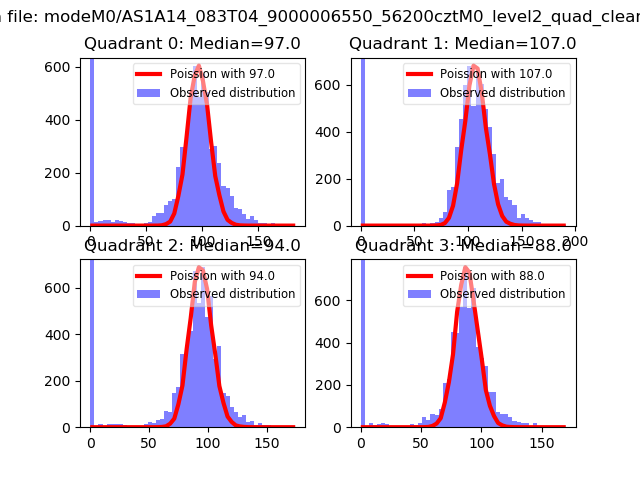 |
 |
| Quadrant-wise count rates Data is divided into 100 sec bins |
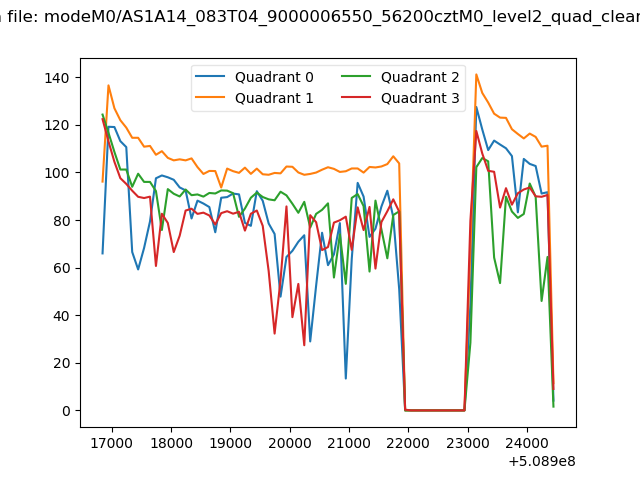 |
|
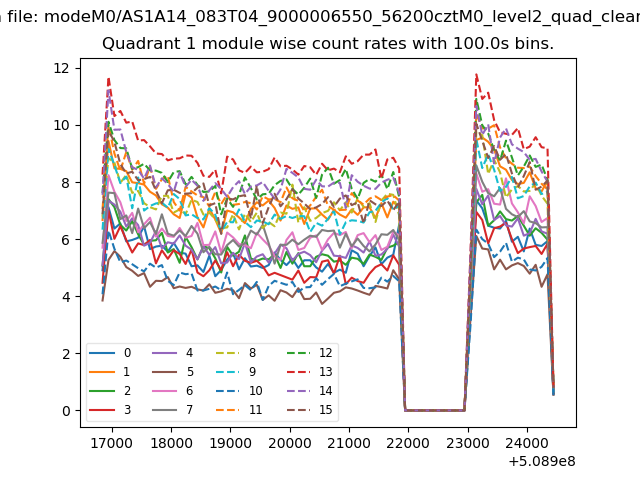
| Module-wise count rates for Quadrant A Data is divided into 100 sec bins |
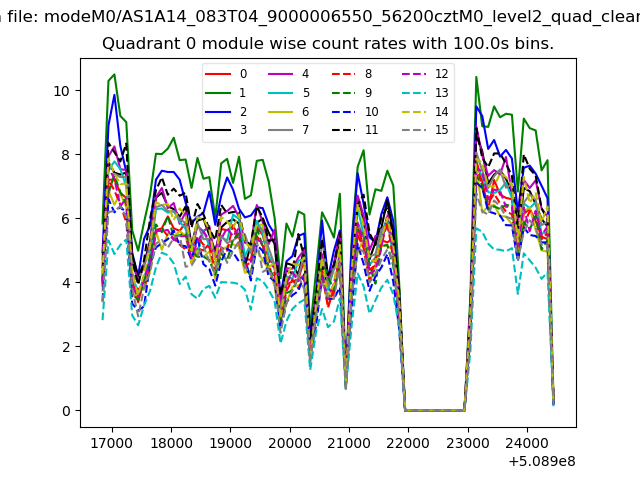 |
 |
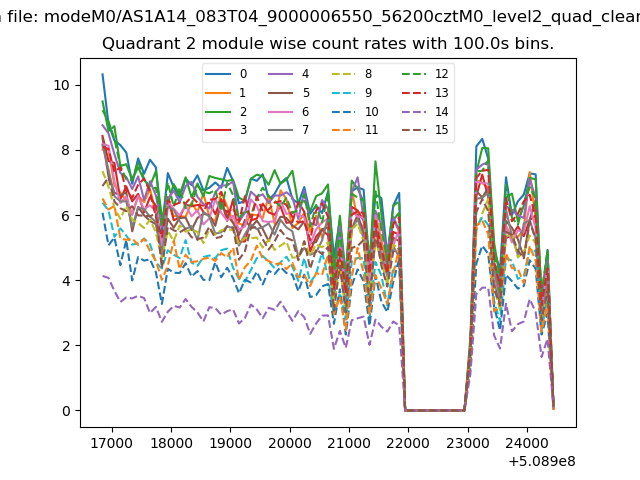
| Module-wise count rates for Quadrant B Data is divided into 100 sec bins |
 |
 |
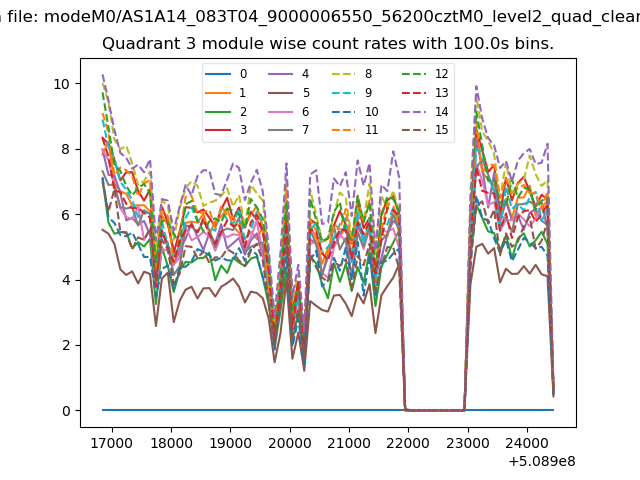
| Module-wise count rates for Quadrant C Data is divided into 100 sec bins |
 |
 |
| Module-wise count rates for Quadrant D Data is divided into 100 sec bins |
 |
 |
| Parameter | Plot |
|---|---|
| CZT HV Monitor | 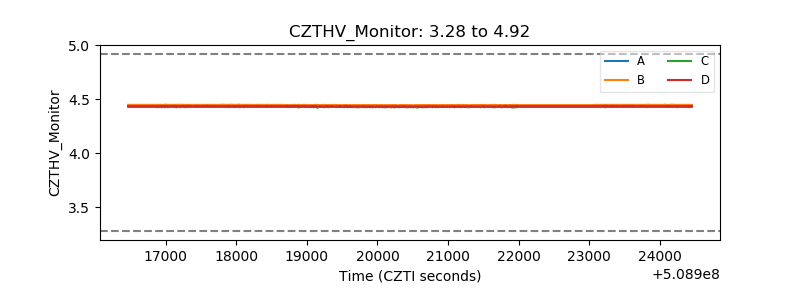 |
| D_VDD | 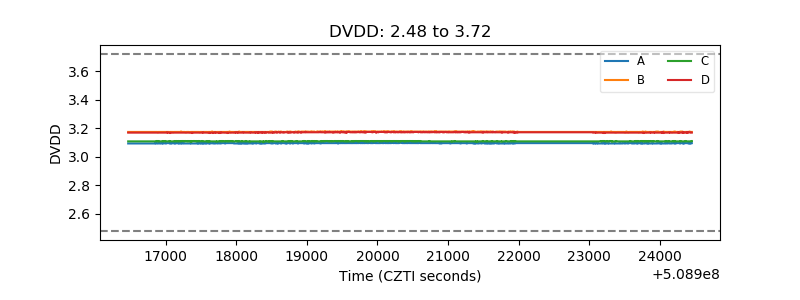 |
| Temperature 1 | 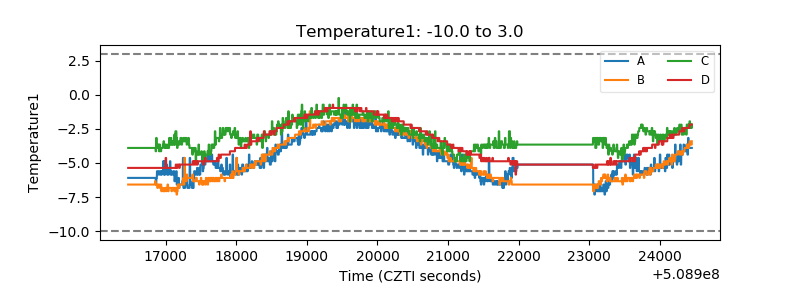 |
| Veto HV Monitor |  |
| Veto LLD | 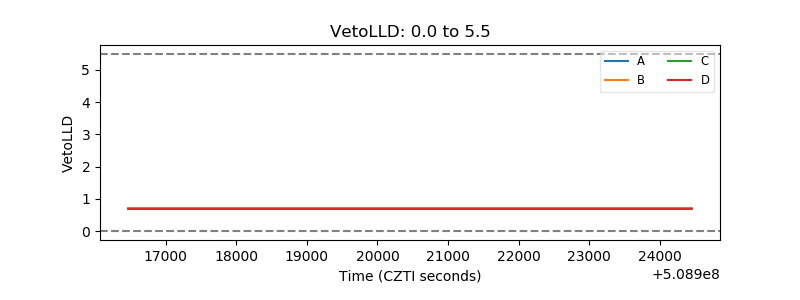 |
| Alpha Counter | 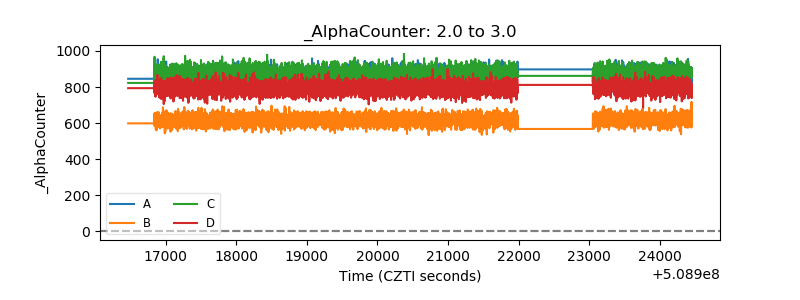 |
| _CPM_Rate | 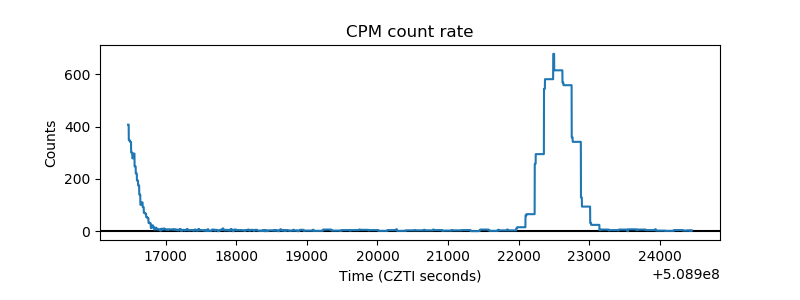 |
| CZT Counter | 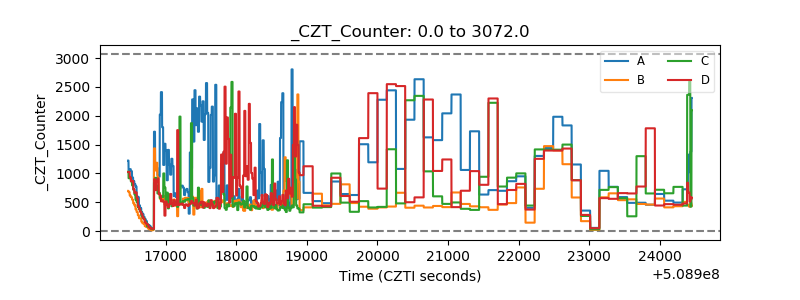 |
| +2.5 Volts monitor | 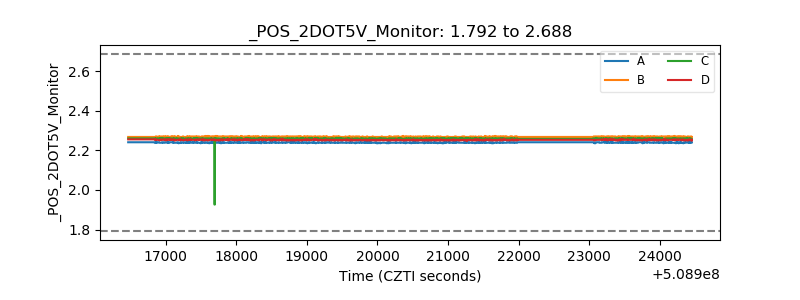 |
| +5 Volts monitor | 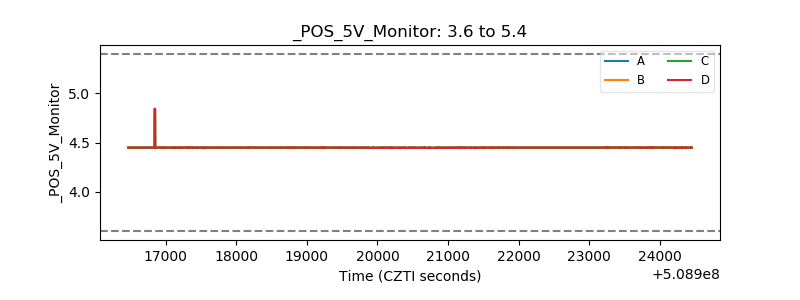 |
| _ROLL_ROT | 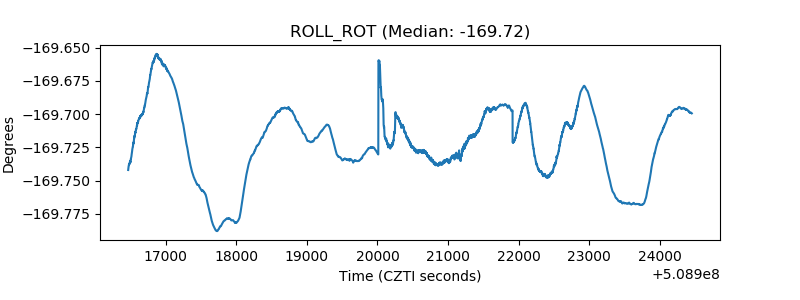 |
| _Roll_DEC | 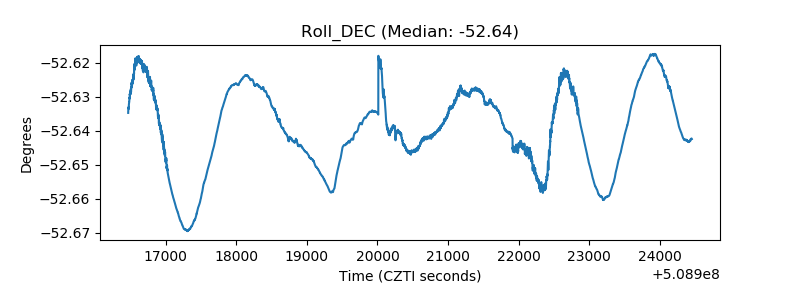 |
| _Roll_RA | 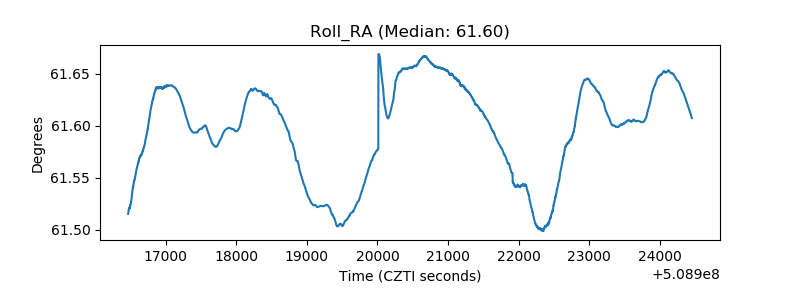 |
| Veto Counter | 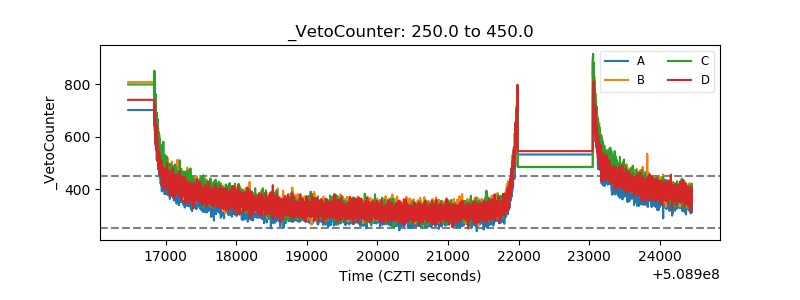 |