| Param | Original file | Final file |
|---|---|---|
| Filename | modeM0/AS1A14_083T04_9000006550_56201cztM0_level2.fits | modeM0/AS1A14_083T04_9000006550_56201cztM0_level2_quad_clean.evt |
| Size (bytes) | 597,775,680 | 93,202,560 |
| Size | 570.1 MB | 88.9 MB |
| Events in quadrant A | 8,021,432 | 537,230 |
| Events in quadrant B | 3,290,852 | 702,698 |
| Events in quadrant C | 5,546,762 | 566,635 |
| Events in quadrant D | 4,771,151 | 568,177 |
| Mode SS | |||
|---|---|---|---|
| Quadrant | BADHDUFLAG | Total packets | Discarded packets |
| A | 0 | 130 | 0 |
| B | 0 | 130 | 0 |
| C | 0 | 130 | 0 |
| D | 0 | 130 | 0 |
| Mode M9 | |||
|---|---|---|---|
| Quadrant | BADHDUFLAG | Total packets | Discarded packets |
| A | 0 | 14 | 0 |
| B | 0 | 14 | 0 |
| C | 0 | 15 | 0 |
| D | 0 | 15 | 0 |
| Mode M0 | |||
|---|---|---|---|
| Quadrant | BADHDUFLAG | Total packets | Discarded packets |
| A | 0 | 28410 | 2 |
| B | 0 | 14038 | 3 |
| C | 0 | 21040 | 2 |
| D | 0 | 18523 | 2 |
| Quadrant | Total seconds | Saturated seconds | Saturation percentage |
|---|---|---|---|
| A | 6416 | 1460 | 22.755611% |
| B | 6415 | 173 | 2.696804% |
| C | 6415 | 848 | 13.219018% |
| D | 6415 | 343 | 5.346843% |
Noise dominated data is calculated using 1-second bins in cleaned event files. If a bin has >2000 counts, and if more than 50% of those come from <1% of pixels, then it is considered to be noise-dominated and hence unusable.
| Quadrant | # 1 sec bins | Bins with >0 counts | Bins with >2000 counts | High rate bins dominated by noise | Noise dominated (total time) | Noise dominated (detector-on time) | Marked lightcurve |
|---|---|---|---|---|---|---|---|
| A | 7586 | 6416 | 1242 | 1242 | 16.37% | 19.36% | 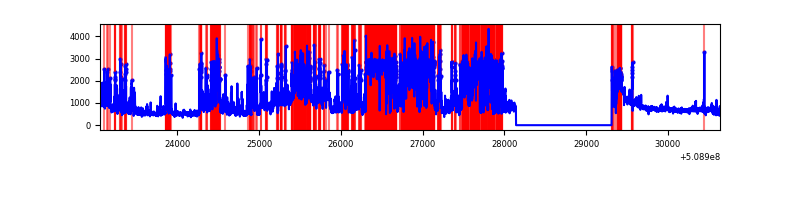 |
| B | 7585 | 6415 | 19 | 19 | 0.25% | 0.30% | 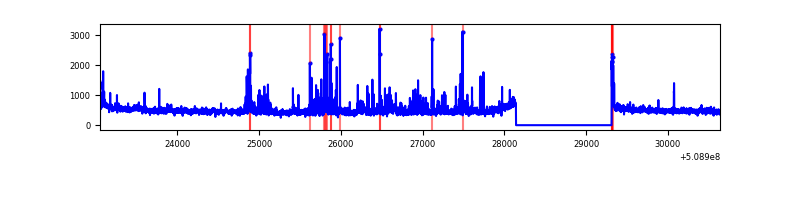 |
| C | 7585 | 6416 | 617 | 617 | 8.13% | 9.62% | 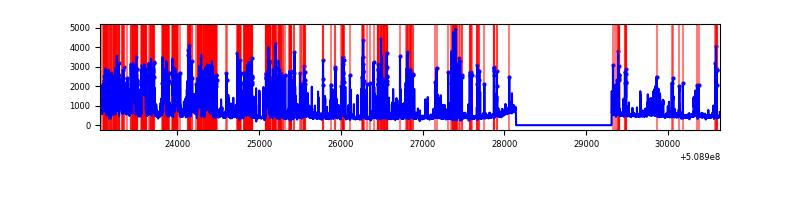 |
| D | 7585 | 6416 | 231 | 231 | 3.05% | 3.60% | 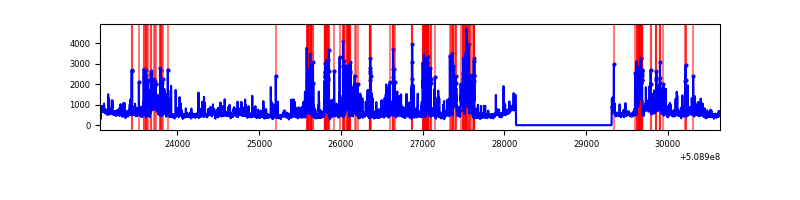 |
Top three noisy pixels from each quadrant. If the there are fewer than three noisy pixels in the level2.evt file, extra rows are filled as -1
| Pixel properties | Quadrant properties | ||||||
|---|---|---|---|---|---|---|---|
| Quadrant | DetID | PixID | Counts | Sigma | Mean | Median | Sigma |
| A | 15 | 32 | 2662013 | 16173.38 | 668 | 653 | 164.6 |
| A | 8 | 176 | 1123060 | 6820.99 | 668 | 653 | 164.6 |
| A | 12 | 115 | 895599 | 5438.69 | 668 | 653 | 164.6 |
| B | 4 | 156 | 143547 | 953.55 | 715 | 691 | 149.8 |
| B | 5 | 185 | 85926 | 568.94 | 715 | 691 | 149.8 |
| B | 10 | 247 | 47804 | 314.48 | 715 | 691 | 149.8 |
| C | 12 | 254 | 2112676 | 11565.55 | 668 | 661 | 182.6 |
| C | 12 | 252 | 669243 | 3661.2 | 668 | 661 | 182.6 |
| C | 6 | 223 | 48808 | 263.66 | 668 | 661 | 182.6 |
| D | 11 | 129 | 756087 | 3855.59 | 696 | 664 | 195.9 |
| D | 6 | 239 | 328360 | 1672.52 | 696 | 664 | 195.9 |
| D | 2 | 249 | 301635 | 1536.12 | 696 | 664 | 195.9 |
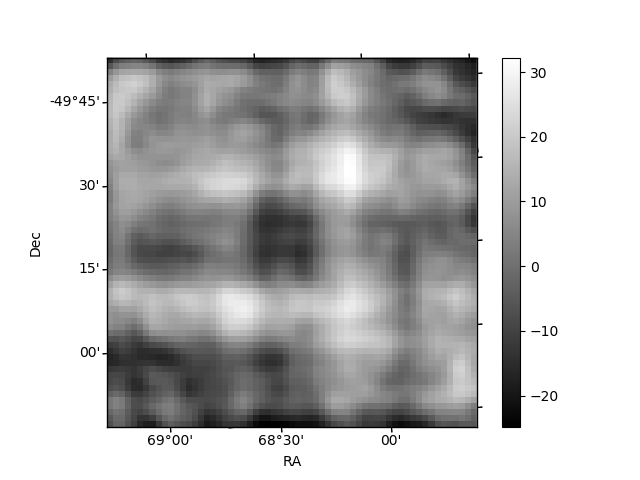
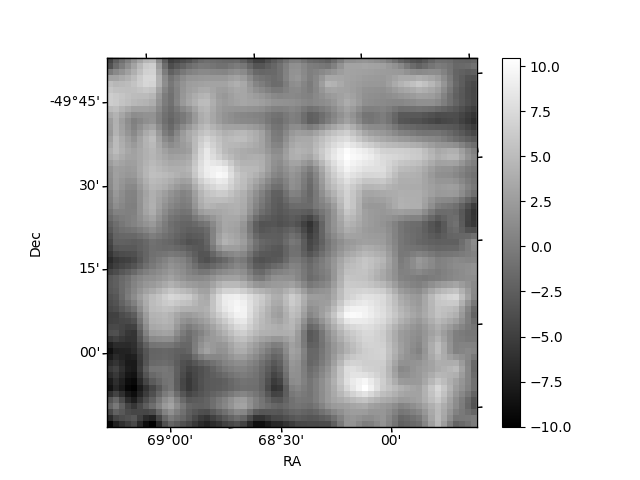
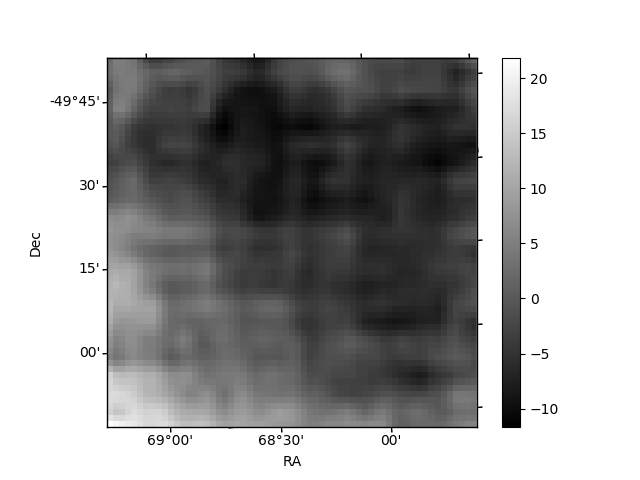
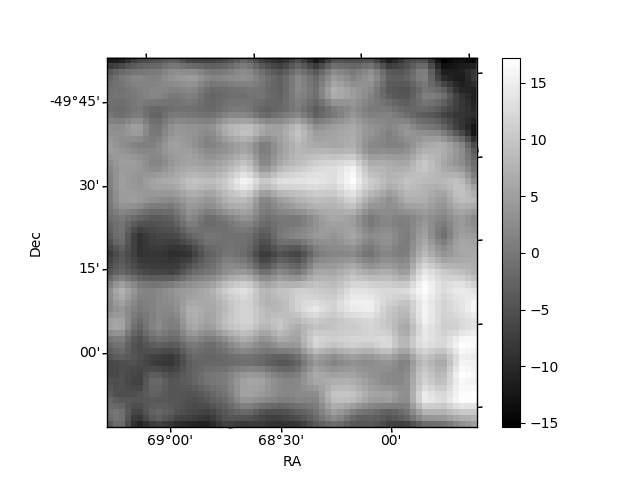
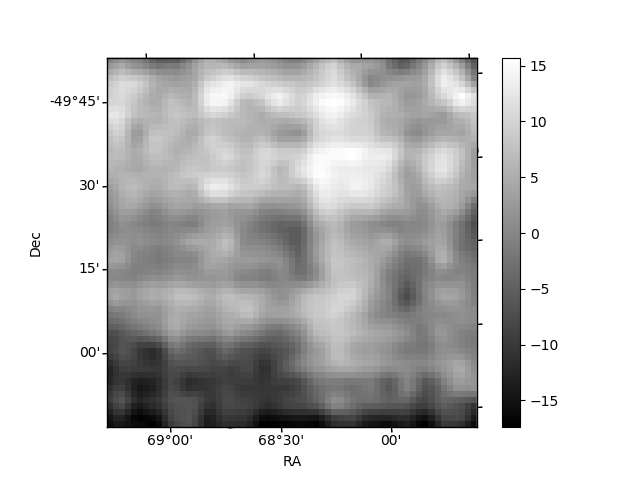
Histogram calculated using DETX and DETY for each event in the final _common_clean file
| Quadrant A | 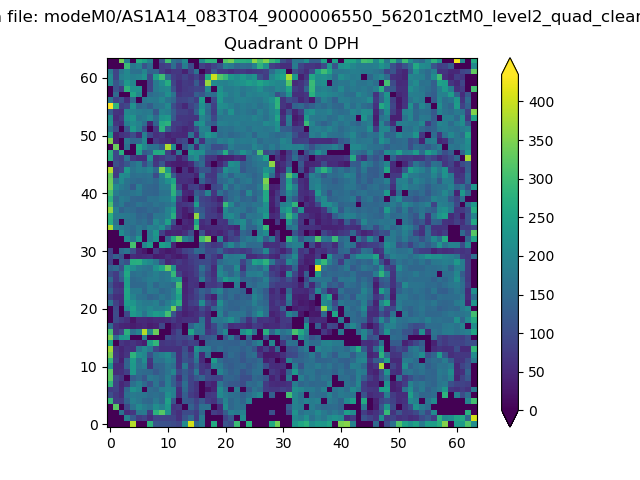 |
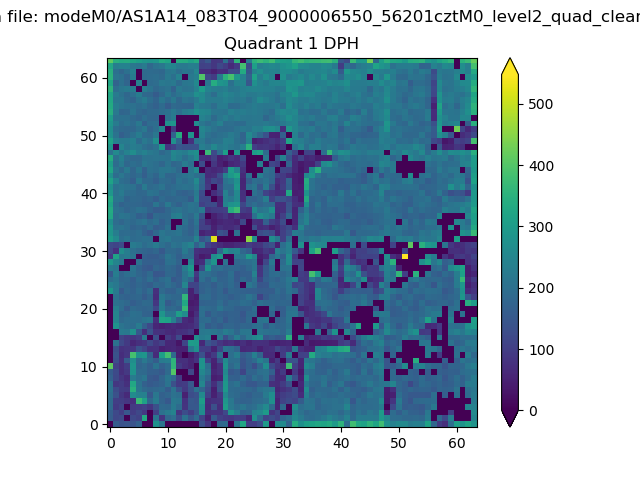 |
Quadrant B |
|---|---|---|---|
| Quadrant D | 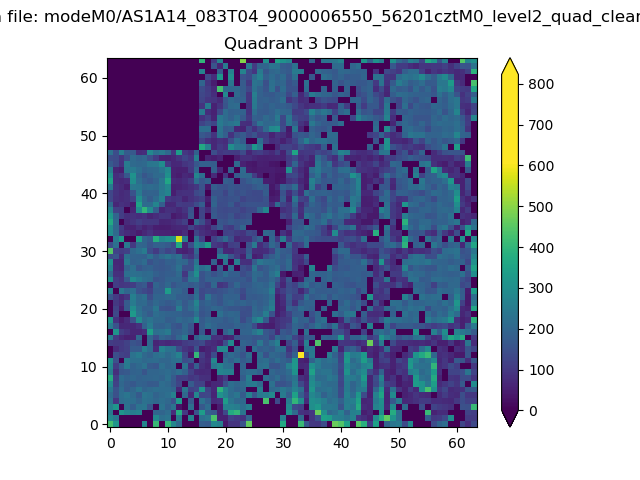 |
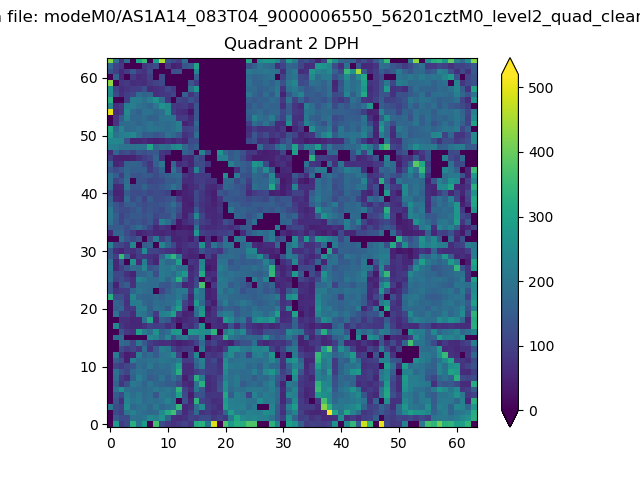 |
Quadrant C |
| Plot type | Count rate plots | Images |
|---|---|---|
| Comparison with Poisson distribution Blue bars denote a histogram of data divided into 1 sec bins. Red curve is a Poisson curve with rate = median count rate of data. |
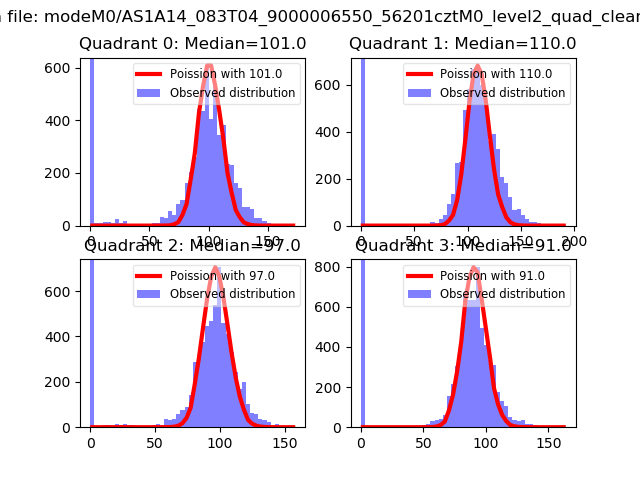 |
 |
| Quadrant-wise count rates Data is divided into 100 sec bins |
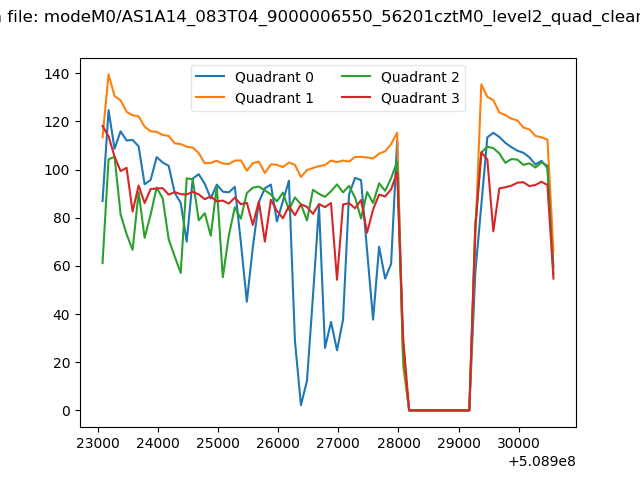 |
|
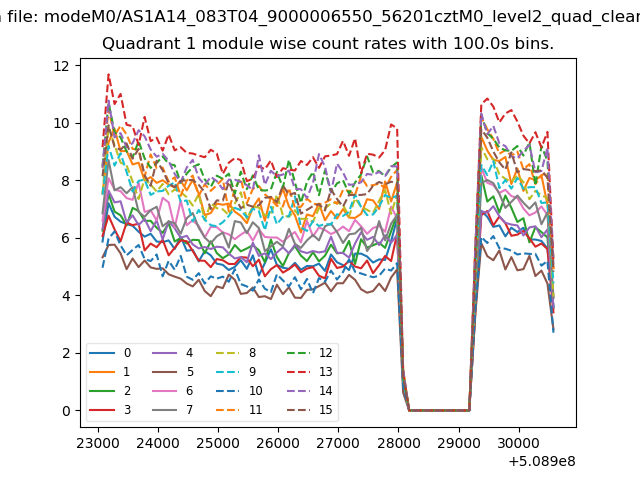
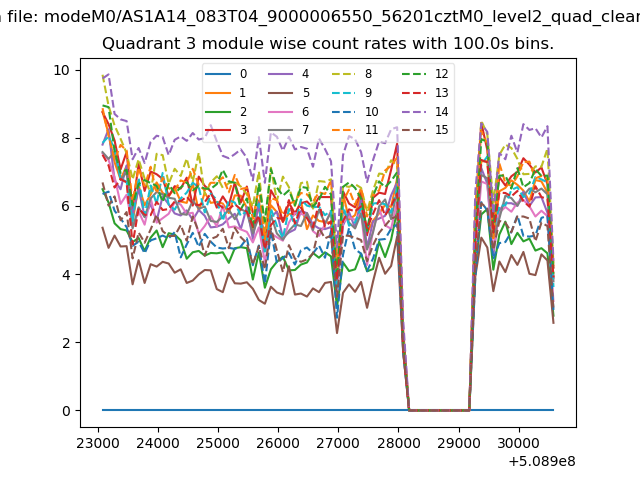
| Module-wise count rates for Quadrant A Data is divided into 100 sec bins |
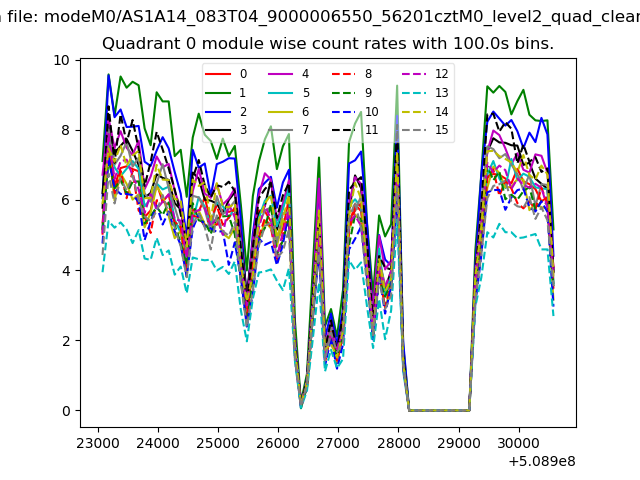 |
 |
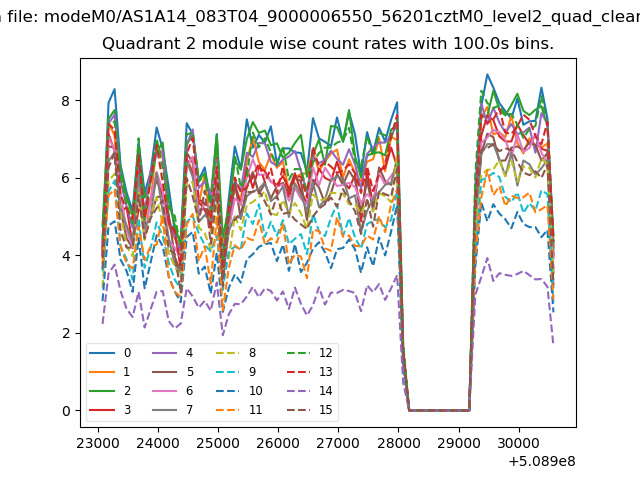
| Module-wise count rates for Quadrant B Data is divided into 100 sec bins |
 |
 |
| Module-wise count rates for Quadrant C Data is divided into 100 sec bins |
 |
 |
| Module-wise count rates for Quadrant D Data is divided into 100 sec bins |
 |
 |
| Parameter | Plot |
|---|---|
| CZT HV Monitor | 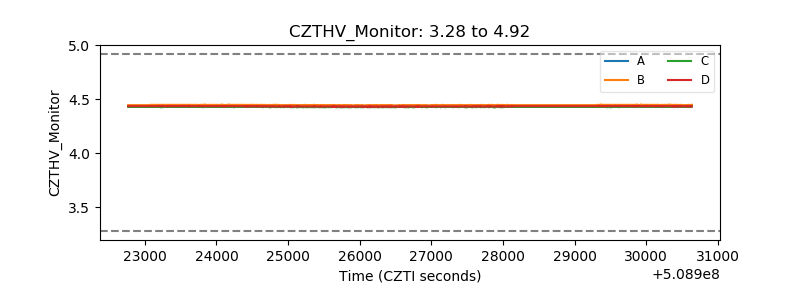 |
| D_VDD | 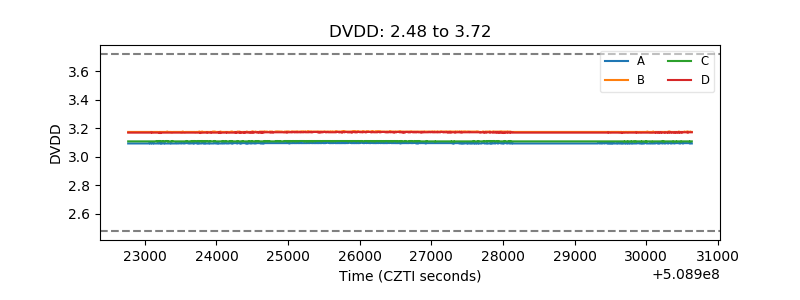 |
| Temperature 1 | 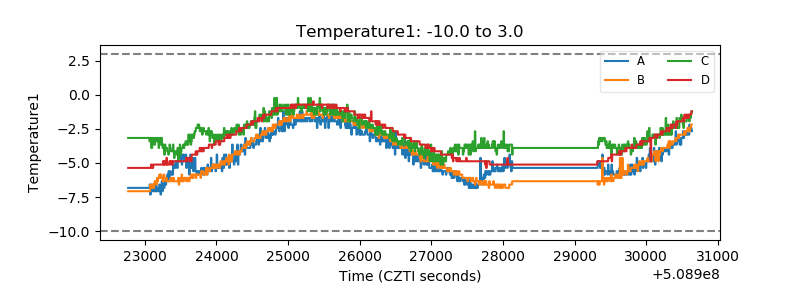 |
| Veto HV Monitor | 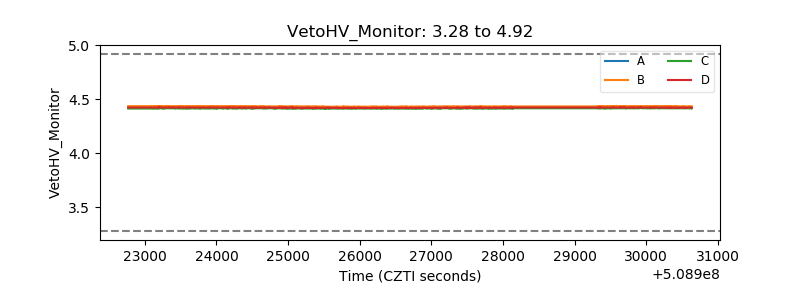 |
| Veto LLD | 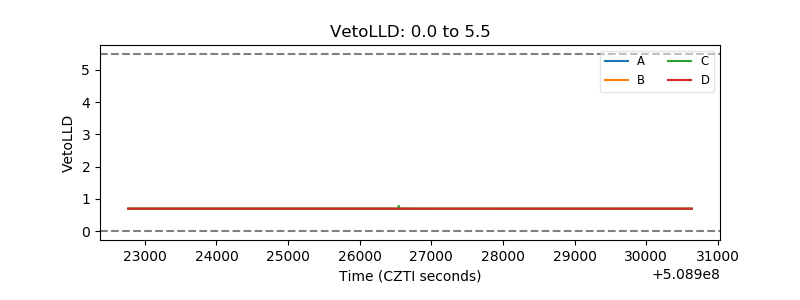 |
| Alpha Counter | 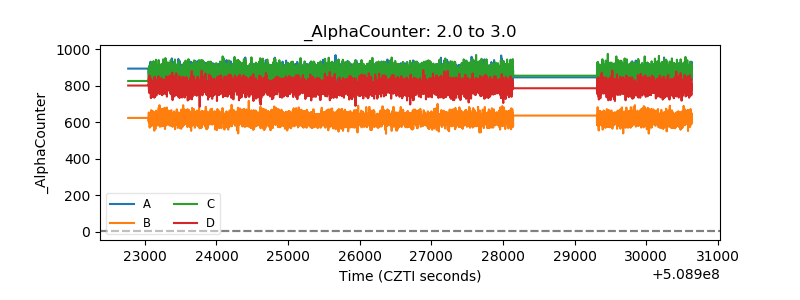 |
| _CPM_Rate | 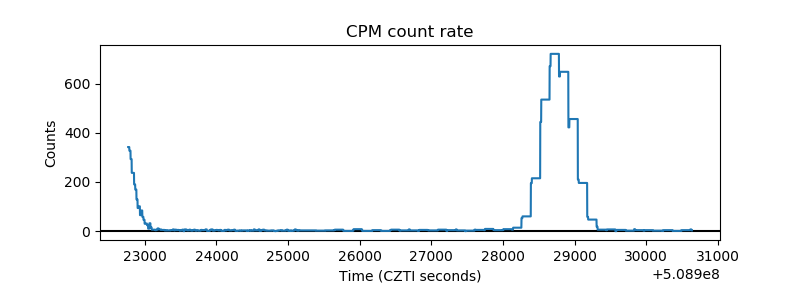 |
| CZT Counter | 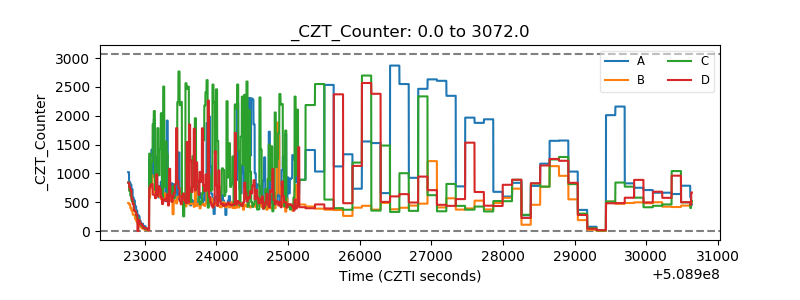 |
| +2.5 Volts monitor |  |
| +5 Volts monitor |  |
| _ROLL_ROT | 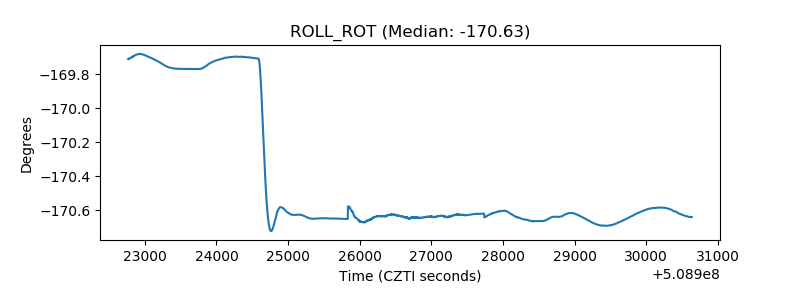 |
| _Roll_DEC | 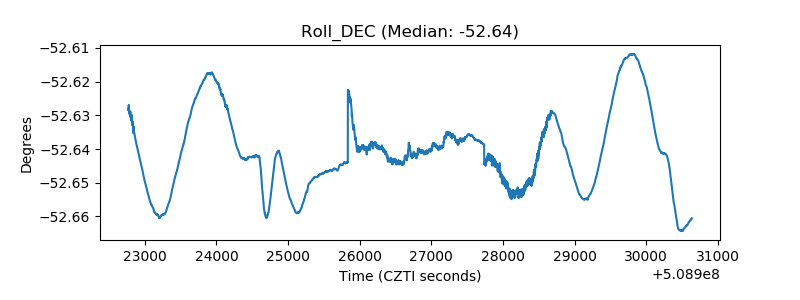 |
| _Roll_RA | 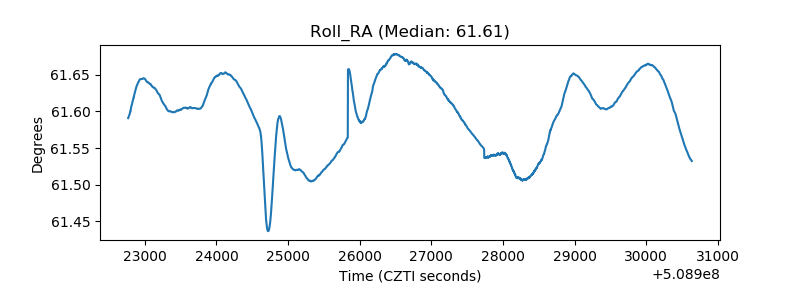 |
| Veto Counter | 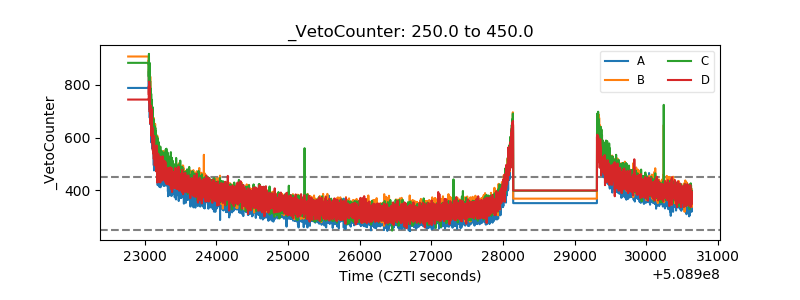 |