| Param | Original file | Final file |
|---|---|---|
| Filename | modeM0/AS1A14_083T04_9000006550_56202cztM0_level2.fits | modeM0/AS1A14_083T04_9000006550_56202cztM0_level2_quad_clean.evt |
| Size (bytes) | 655,876,800 | 92,710,080 |
| Size | 625.5 MB | 88.4 MB |
| Events in quadrant A | 7,323,894 | 561,524 |
| Events in quadrant B | 3,739,683 | 691,743 |
| Events in quadrant C | 4,727,050 | 606,271 |
| Events in quadrant D | 7,982,021 | 492,420 |
| Mode SS | |||
|---|---|---|---|
| Quadrant | BADHDUFLAG | Total packets | Discarded packets |
| A | 0 | 132 | 0 |
| B | 0 | 132 | 0 |
| C | 0 | 132 | 0 |
| D | 0 | 132 | 0 |
| Mode M9 | |||
|---|---|---|---|
| Quadrant | BADHDUFLAG | Total packets | Discarded packets |
| A | 0 | 12 | 0 |
| B | 0 | 12 | 0 |
| C | 0 | 12 | 0 |
| D | 0 | 12 | 0 |
| Mode M0 | |||
|---|---|---|---|
| Quadrant | BADHDUFLAG | Total packets | Discarded packets |
| A | 0 | 26473 | 1 |
| B | 0 | 15523 | 5 |
| C | 0 | 18667 | 1 |
| D | 0 | 28215 | 1 |
| Quadrant | Total seconds | Saturated seconds | Saturation percentage |
|---|---|---|---|
| A | 6533 | 1191 | 18.230522% |
| B | 6533 | 295 | 4.515537% |
| C | 6533 | 404 | 6.183989% |
| D | 6533 | 1295 | 19.822440% |
Noise dominated data is calculated using 1-second bins in cleaned event files. If a bin has >2000 counts, and if more than 50% of those come from <1% of pixels, then it is considered to be noise-dominated and hence unusable.
| Quadrant | # 1 sec bins | Bins with >0 counts | Bins with >2000 counts | High rate bins dominated by noise | Noise dominated (total time) | Noise dominated (detector-on time) | Marked lightcurve |
|---|---|---|---|---|---|---|---|
| A | 7653 | 6533 | 981 | 981 | 12.82% | 15.02% | 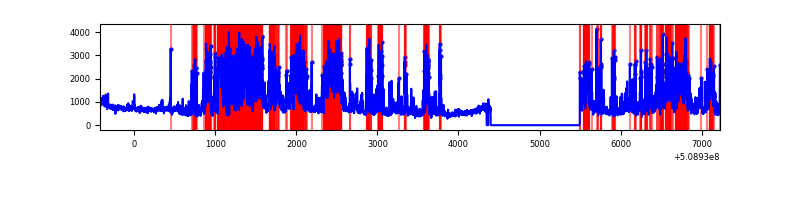 |
| B | 7652 | 6532 | 101 | 101 | 1.32% | 1.55% | 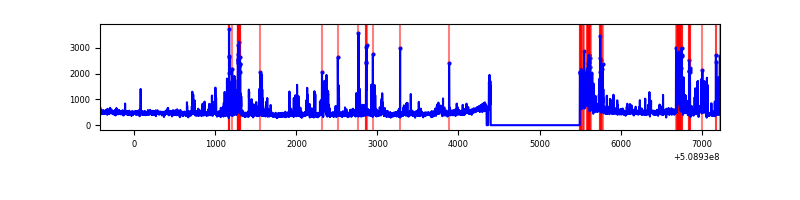 |
| C | 7653 | 6533 | 291 | 291 | 3.80% | 4.45% | 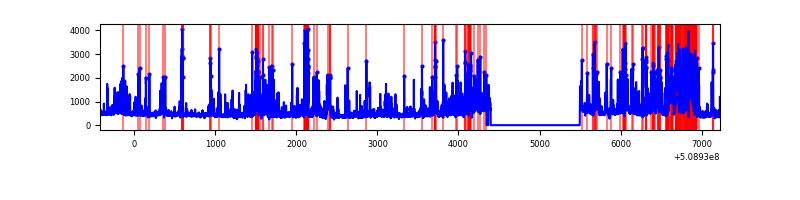 |
| D | 7653 | 6533 | 1221 | 1221 | 15.95% | 18.69% | 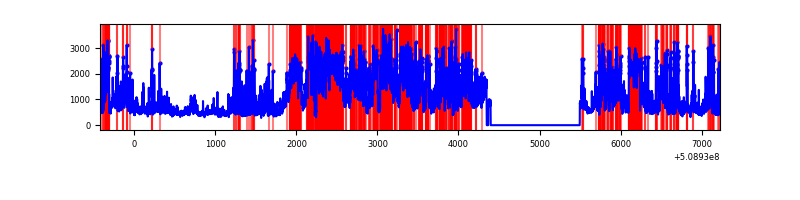 |
Top three noisy pixels from each quadrant. If the there are fewer than three noisy pixels in the level2.evt file, extra rows are filled as -1
| Pixel properties | Quadrant properties | ||||||
|---|---|---|---|---|---|---|---|
| Quadrant | DetID | PixID | Counts | Sigma | Mean | Median | Sigma |
| A | 15 | 32 | 1791113 | 10678.34 | 683 | 666 | 167.7 |
| A | 12 | 115 | 1082551 | 6452.43 | 683 | 666 | 167.7 |
| A | 8 | 176 | 856665 | 5105.23 | 683 | 666 | 167.7 |
| B | 5 | 185 | 471843 | 3142.35 | 708 | 686 | 149.9 |
| B | 4 | 156 | 261866 | 1741.92 | 708 | 686 | 149.9 |
| B | 10 | 247 | 41520 | 272.34 | 708 | 686 | 149.9 |
| C | 12 | 254 | 1427469 | 7600.72 | 688 | 680 | 187.7 |
| C | 12 | 252 | 346353 | 1841.45 | 688 | 680 | 187.7 |
| C | 6 | 223 | 76663 | 404.77 | 688 | 680 | 187.7 |
| D | 11 | 129 | 3936586 | 21128.44 | 657 | 627 | 186.3 |
| D | 4 | 230 | 405920 | 2175.64 | 657 | 627 | 186.3 |
| D | 2 | 249 | 251827 | 1348.46 | 657 | 627 | 186.3 |
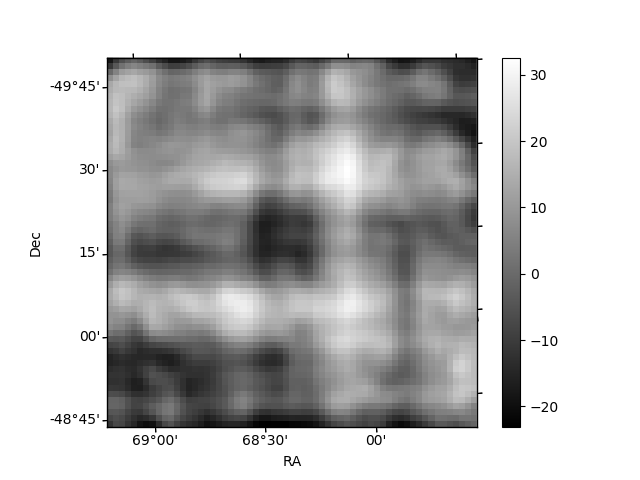
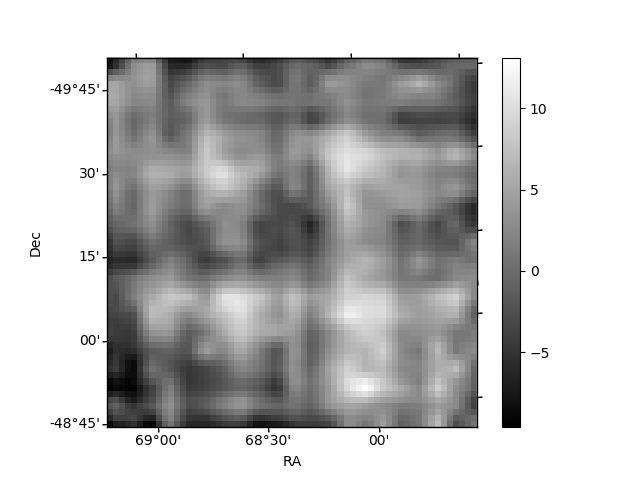
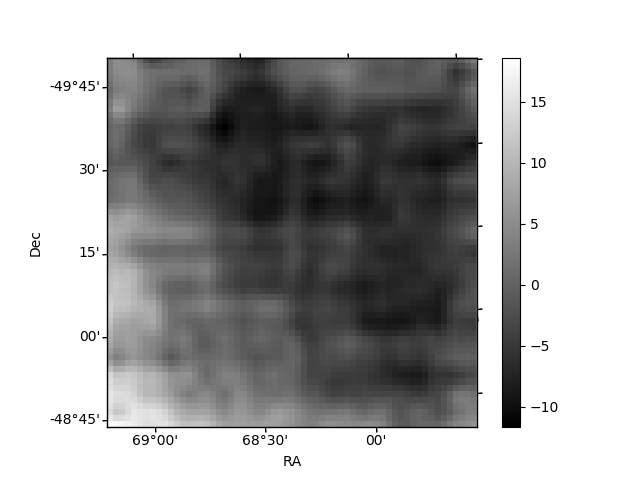
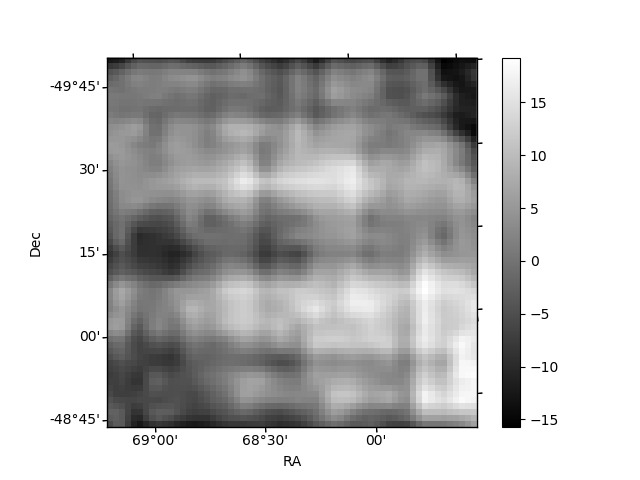
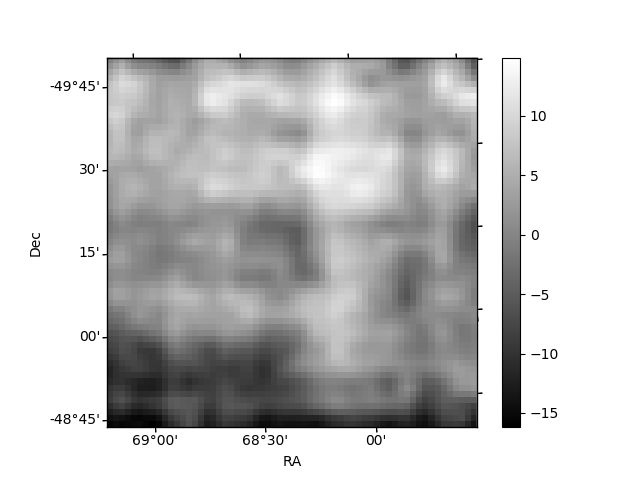
Histogram calculated using DETX and DETY for each event in the final _common_clean file
| Quadrant A | 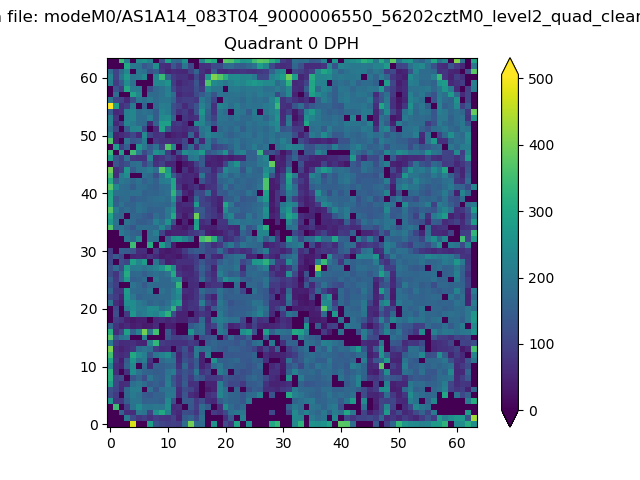 |
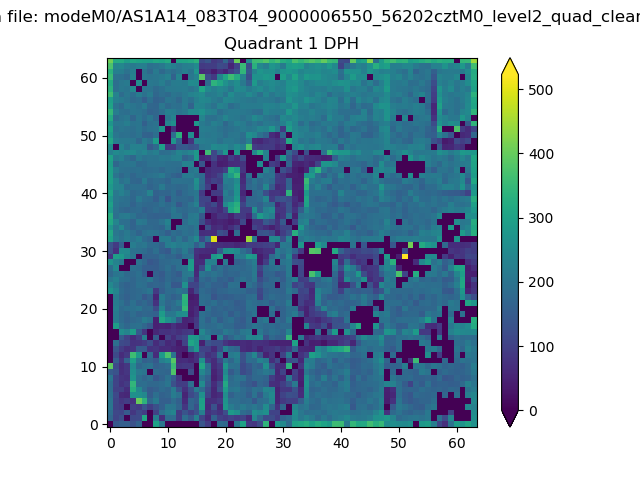 |
Quadrant B |
|---|---|---|---|
| Quadrant D | 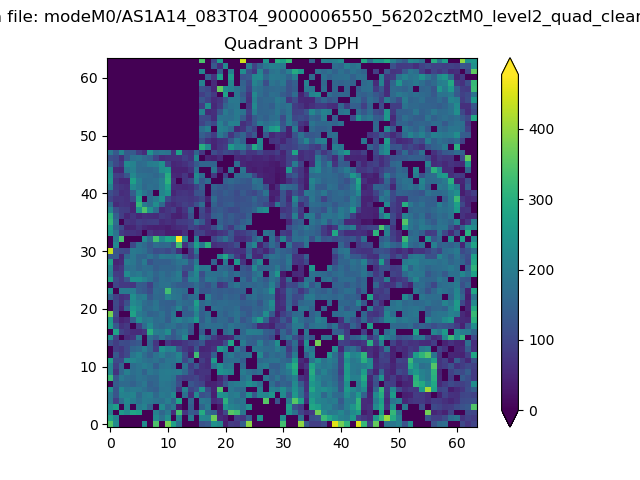 |
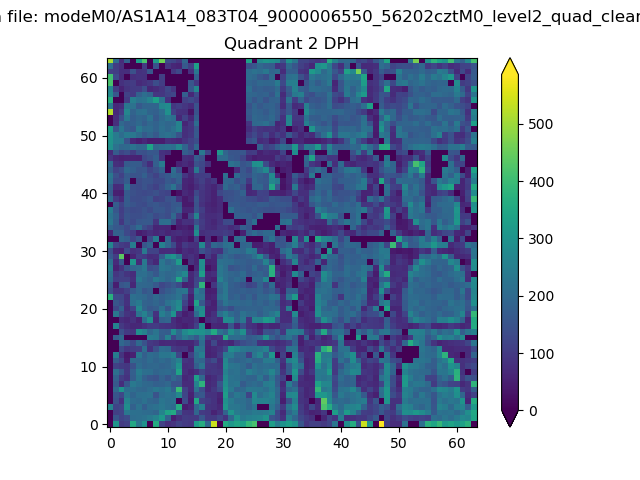 |
Quadrant C |
| Plot type | Count rate plots | Images |
|---|---|---|
| Comparison with Poisson distribution Blue bars denote a histogram of data divided into 1 sec bins. Red curve is a Poisson curve with rate = median count rate of data. |
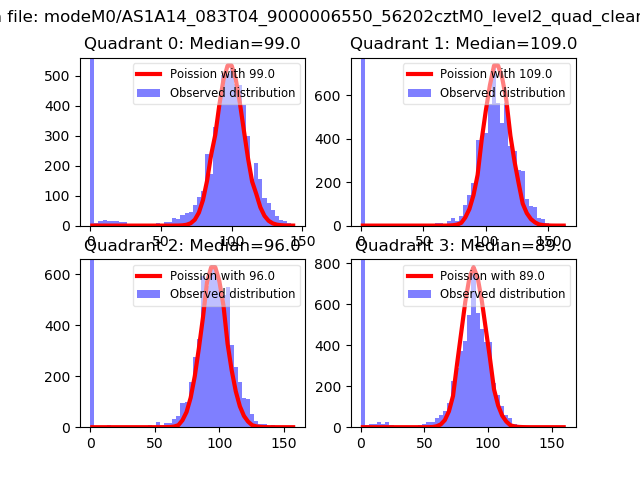 |
 |
| Quadrant-wise count rates Data is divided into 100 sec bins |
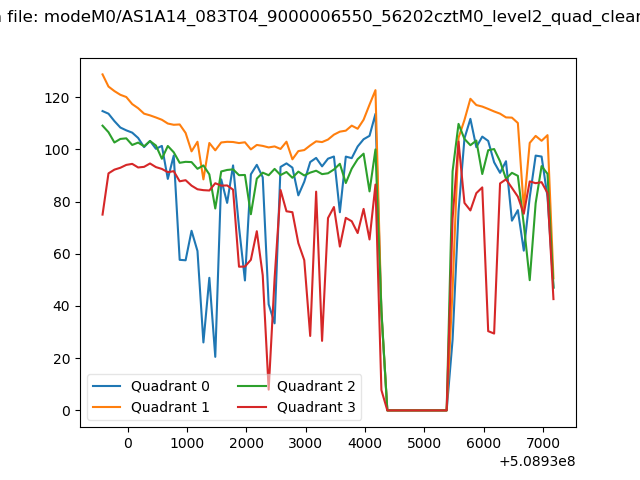 |
|
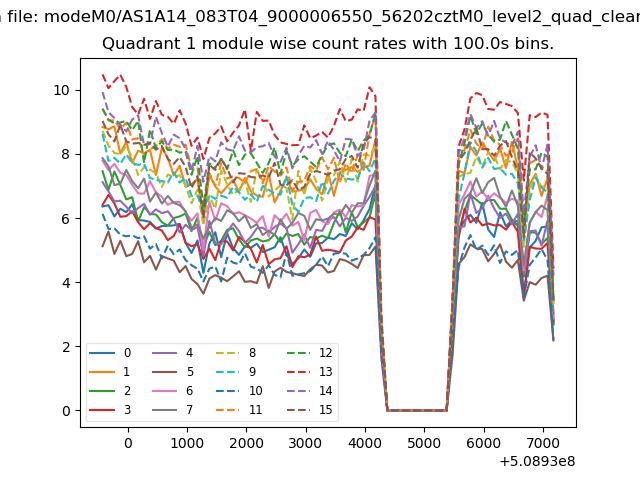
| Module-wise count rates for Quadrant A Data is divided into 100 sec bins |
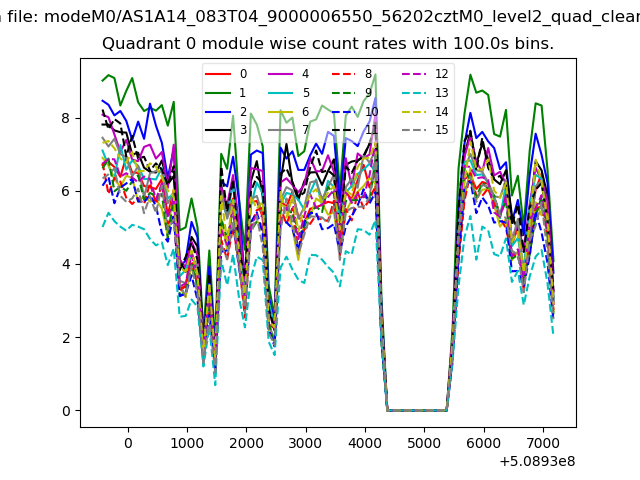 |
 |
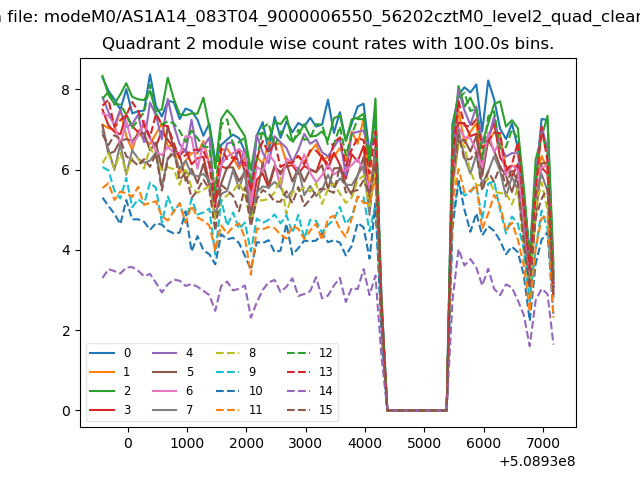
| Module-wise count rates for Quadrant B Data is divided into 100 sec bins |
 |
 |
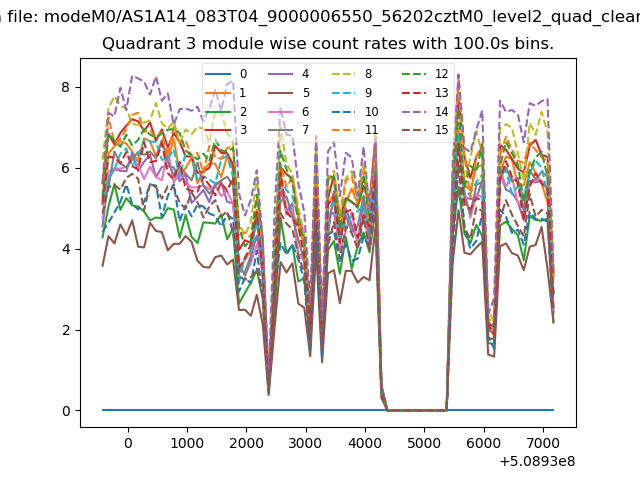
| Module-wise count rates for Quadrant C Data is divided into 100 sec bins |
 |
 |
| Module-wise count rates for Quadrant D Data is divided into 100 sec bins |
 |
 |
| Parameter | Plot |
|---|---|
| CZT HV Monitor | 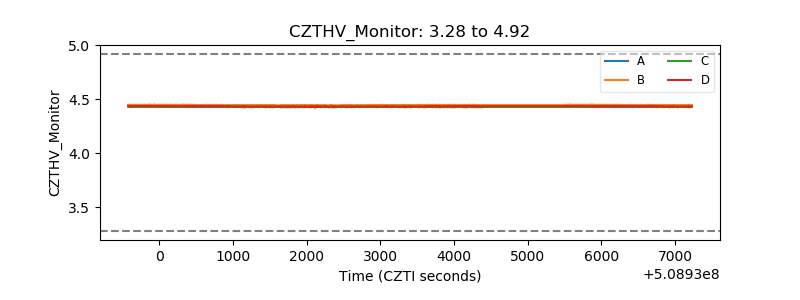 |
| D_VDD | 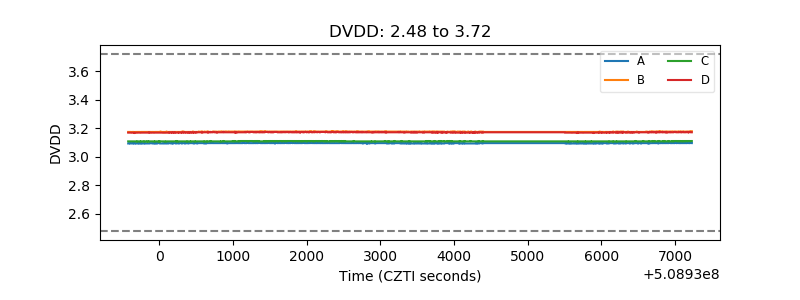 |
| Temperature 1 | 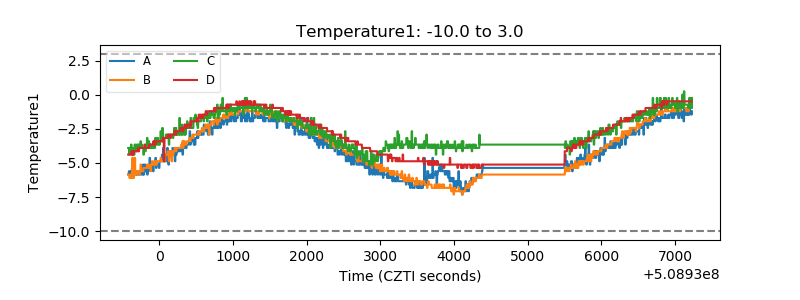 |
| Veto HV Monitor | 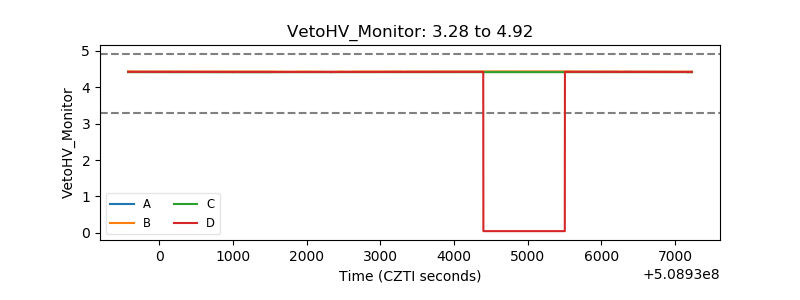 |
| Veto LLD | 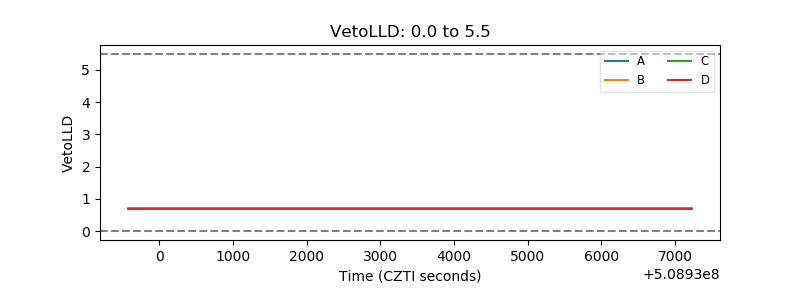 |
| Alpha Counter | 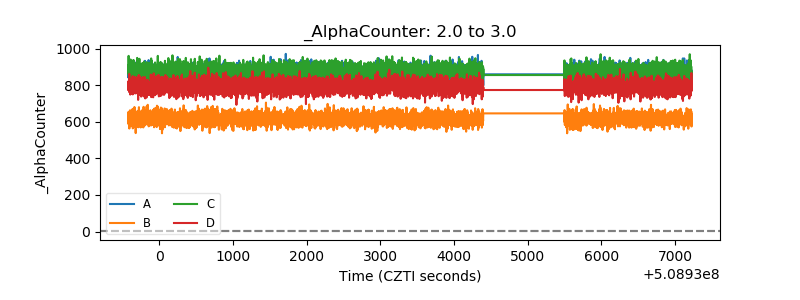 |
| _CPM_Rate | 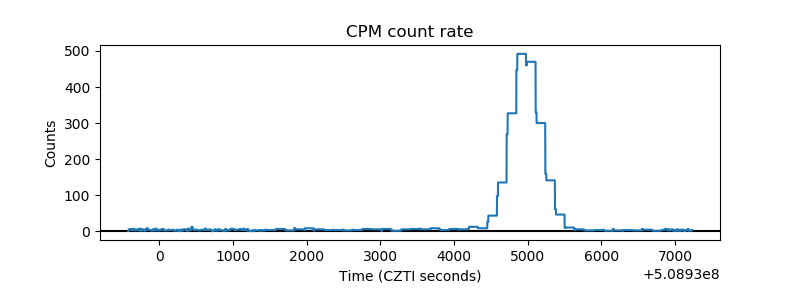 |
| CZT Counter | 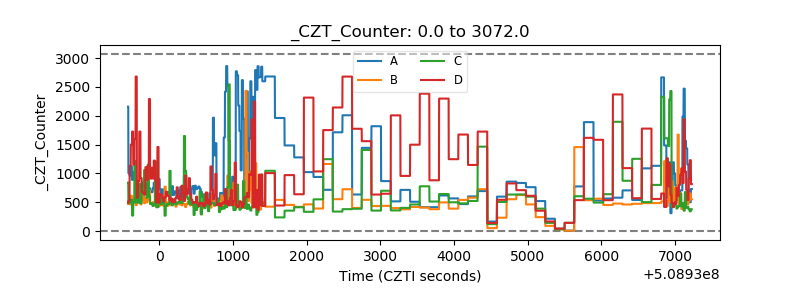 |
| +2.5 Volts monitor | 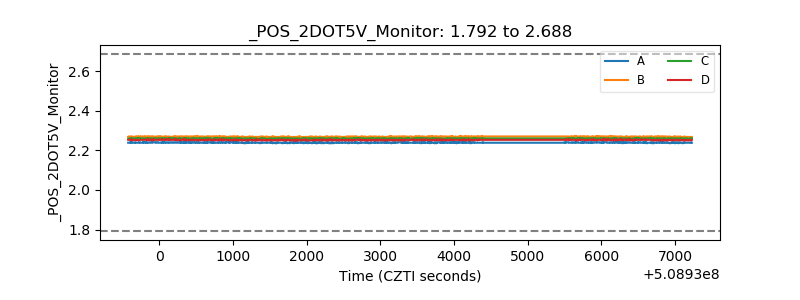 |
| +5 Volts monitor |  |
| _ROLL_ROT | 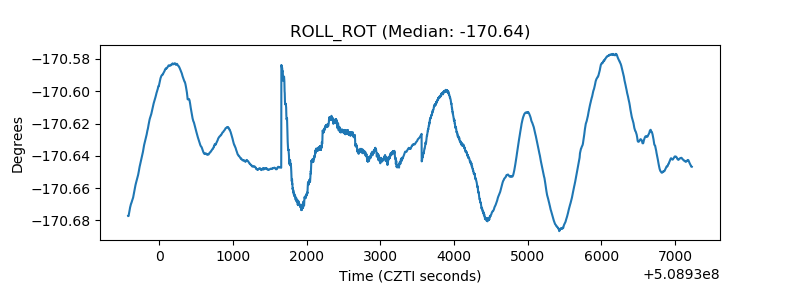 |
| _Roll_DEC | 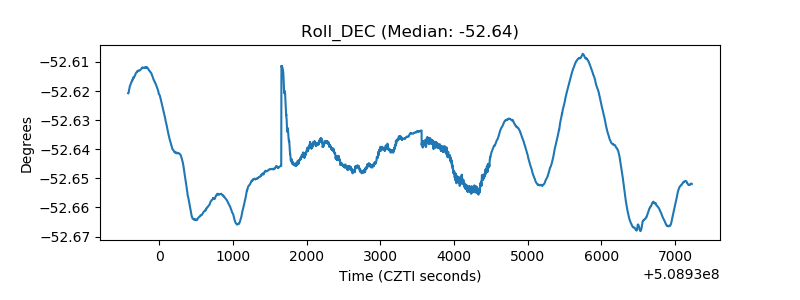 |
| _Roll_RA | 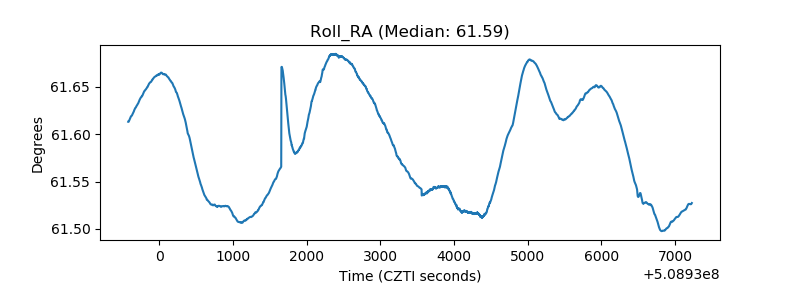 |
| Veto Counter | 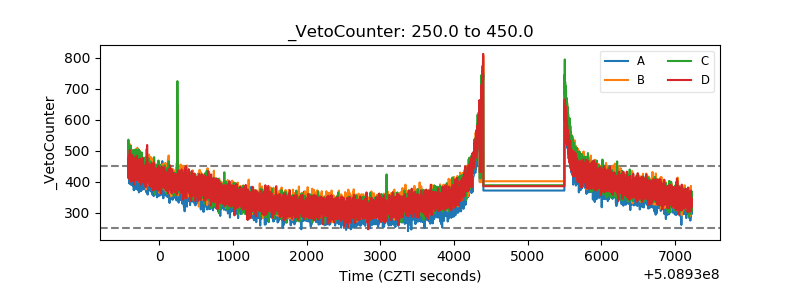 |