| Param | Original file | Final file |
|---|---|---|
| Filename | modeM0/AS1A14_083T04_9000006550_56203cztM0_level2.fits | modeM0/AS1A14_083T04_9000006550_56203cztM0_level2_quad_clean.evt |
| Size (bytes) | 633,415,680 | 90,547,200 |
| Size | 604.1 MB | 86.4 MB |
| Events in quadrant A | 7,934,614 | 533,176 |
| Events in quadrant B | 3,986,982 | 665,787 |
| Events in quadrant C | 4,695,638 | 575,037 |
| Events in quadrant D | 6,328,082 | 515,613 |
| Mode SS | |||
|---|---|---|---|
| Quadrant | BADHDUFLAG | Total packets | Discarded packets |
| A | 0 | 132 | 0 |
| B | 0 | 132 | 0 |
| C | 0 | 132 | 0 |
| D | 0 | 132 | 0 |
| Mode M9 | |||
|---|---|---|---|
| Quadrant | BADHDUFLAG | Total packets | Discarded packets |
| A | 0 | 10 | 0 |
| B | 0 | 10 | 0 |
| C | 0 | 10 | 0 |
| D | 0 | 10 | 0 |
| Mode M0 | |||
|---|---|---|---|
| Quadrant | BADHDUFLAG | Total packets | Discarded packets |
| A | 0 | 28050 | 1 |
| B | 0 | 16347 | 1 |
| C | 0 | 18743 | 1 |
| D | 0 | 23215 | 1 |
| Quadrant | Total seconds | Saturated seconds | Saturation percentage |
|---|---|---|---|
| A | 6476 | 1310 | 20.228536% |
| B | 6476 | 311 | 4.802347% |
| C | 6477 | 498 | 7.688745% |
| D | 6477 | 733 | 11.316968% |
Noise dominated data is calculated using 1-second bins in cleaned event files. If a bin has >2000 counts, and if more than 50% of those come from <1% of pixels, then it is considered to be noise-dominated and hence unusable.
| Quadrant | # 1 sec bins | Bins with >0 counts | Bins with >2000 counts | High rate bins dominated by noise | Noise dominated (total time) | Noise dominated (detector-on time) | Marked lightcurve |
|---|---|---|---|---|---|---|---|
| A | 7501 | 6476 | 1012 | 1012 | 13.49% | 15.63% |  |
| B | 7501 | 6476 | 121 | 121 | 1.61% | 1.87% |  |
| C | 7502 | 6477 | 373 | 373 | 4.97% | 5.76% |  |
| D | 7502 | 6477 | 668 | 668 | 8.90% | 10.31% |  |
Top three noisy pixels from each quadrant. If the there are fewer than three noisy pixels in the level2.evt file, extra rows are filled as -1
| Pixel properties | Quadrant properties | ||||||
|---|---|---|---|---|---|---|---|
| Quadrant | DetID | PixID | Counts | Sigma | Mean | Median | Sigma |
| A | 15 | 32 | 1721268 | 10544.48 | 654 | 637 | 163.2 |
| A | 8 | 176 | 1483898 | 9089.81 | 654 | 637 | 163.2 |
| A | 12 | 115 | 876556 | 5367.86 | 654 | 637 | 163.2 |
| B | 5 | 185 | 509050 | 3462.07 | 688 | 663 | 146.8 |
| B | 4 | 171 | 451631 | 3071.06 | 688 | 663 | 146.8 |
| B | 0 | 63 | 70738 | 477.21 | 688 | 663 | 146.8 |
| C | 12 | 254 | 1569680 | 8659.18 | 662 | 656 | 181.2 |
| C | 12 | 252 | 248136 | 1365.8 | 662 | 656 | 181.2 |
| C | 6 | 223 | 147675 | 811.37 | 662 | 656 | 181.2 |
| D | 11 | 129 | 2597920 | 13969.6 | 653 | 622 | 185.9 |
| D | 6 | 239 | 189879 | 1017.92 | 653 | 622 | 185.9 |
| D | 8 | 129 | 171926 | 921.36 | 653 | 622 | 185.9 |
Histogram calculated using DETX and DETY for each event in the final _common_clean file
| Quadrant A |  |
 |
Quadrant B |
|---|---|---|---|
| Quadrant D |  |
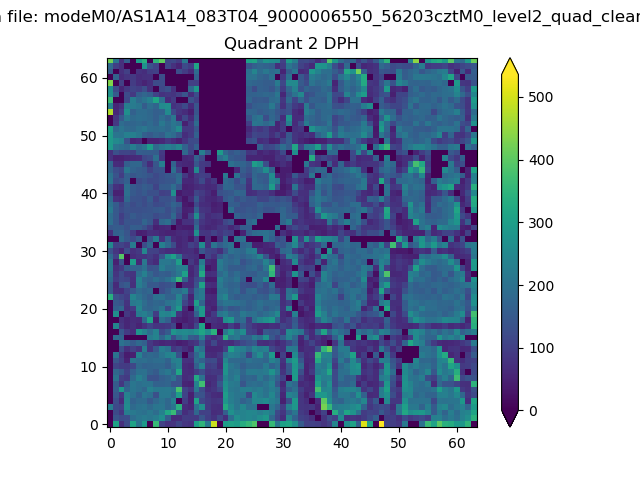 |
Quadrant C |
| Plot type | Count rate plots | Images |
|---|---|---|
| Comparison with Poisson distribution Blue bars denote a histogram of data divided into 1 sec bins. Red curve is a Poisson curve with rate = median count rate of data. |
 |
 |
| Quadrant-wise count rates Data is divided into 100 sec bins |
 |
|
| Module-wise count rates for Quadrant A Data is divided into 100 sec bins |
 |
 |
| Module-wise count rates for Quadrant B Data is divided into 100 sec bins |
 |
 |
| Module-wise count rates for Quadrant C Data is divided into 100 sec bins |
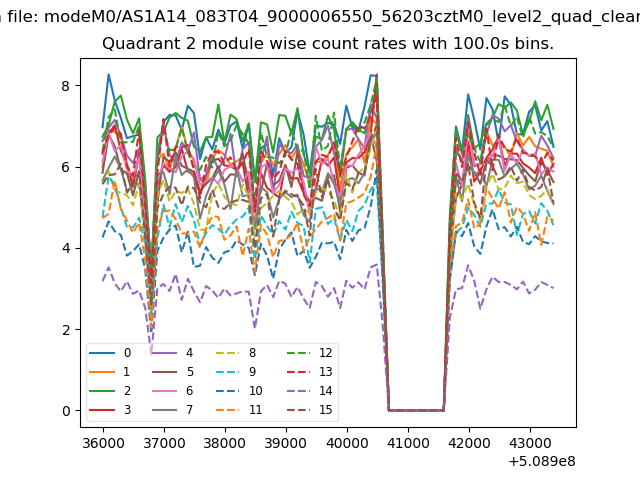 |
 |
| Module-wise count rates for Quadrant D Data is divided into 100 sec bins |
 |
 |
| Parameter | Plot |
|---|---|
| CZT HV Monitor |  |
| D_VDD |  |
| Temperature 1 |  |
| Veto HV Monitor |  |
| Veto LLD |  |
| Alpha Counter |  |
| _CPM_Rate | 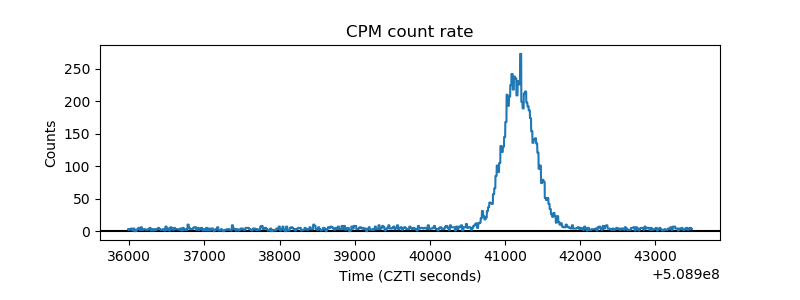 |
| CZT Counter |  |
| +2.5 Volts monitor |  |
| +5 Volts monitor |  |
| _ROLL_ROT |  |
| _Roll_DEC |  |
| _Roll_RA |  |
| Veto Counter |  |